Home > Comparison > Technology > TXN vs AMBA
The strategic rivalry between Texas Instruments Incorporated and Ambarella, Inc. shapes the semiconductor industry’s evolution. Texas Instruments operates as a diversified semiconductor powerhouse, balancing analog and embedded processing segments. Ambarella focuses on high-performance video processing chips with AI integration. This analysis explores their contrasting growth models and competitive moats to determine which offers a superior risk-adjusted return for a diversified portfolio in today’s dynamic tech landscape.

Table of contents
Companies Overview
Texas Instruments and Ambarella stand as pivotal players shaping the semiconductor landscape in 2026.
Texas Instruments Incorporated: Analog and Embedded Processing Powerhouse
Texas Instruments dominates the analog and embedded processing semiconductor market. It generates revenue by designing and selling power management and signal processing chips worldwide. In 2026, its strategic focus remains on expanding its analog segment, which underpins diverse industries from automotive to industrial applications, reinforcing its broad market presence and steady cash flow.
Ambarella, Inc.: Specialist in AI-driven Video Semiconductors
Ambarella leads in video-centric semiconductor solutions integrating AI and deep neural networks. The company’s revenue stems from system-on-chip products tailored for automotive cameras, security, and robotics. Its 2026 strategy emphasizes advancing AI computer vision for autonomous vehicles and expanding its footprint in IP security and consumer video devices, targeting high-growth niches with specialized technology.
Strategic Collision: Similarities & Divergences
While Texas Instruments pursues a broad-based analog and embedded processing approach, Ambarella opts for a focused, AI-driven video semiconductor niche. Their primary battleground lies in automotive and industrial applications, where TI’s scale contrasts with Ambarella’s innovation edge. Investors face distinct profiles: TI offers stable, diversified exposure; Ambarella presents growth potential with higher volatility.
Income Statement Comparison
This data dissects the core profitability and scalability of both corporate engines to reveal who dominates the bottom line:

| Metric | Texas Instruments Incorporated (TXN) | Ambarella, Inc. (AMBA) |
|---|---|---|
| Revenue | 17.7B | 285M |
| Cost of Revenue | 7.6B | 113M |
| Operating Expenses | 4.1B | 299M |
| Gross Profit | 10.1B | 172M |
| EBITDA | 8.3B | -101M |
| EBIT | 6.3B | -127M |
| Interest Expense | 543M | 0 |
| Net Income | 5.0B | -117M |
| EPS | 5.45 | -2.84 |
| Fiscal Year | 2025 | 2025 |
Income Statement Analysis: The Bottom-Line Duel
This income statement comparison reveals the true efficiency of each company’s financial engine through recent revenue and profit trends.
Texas Instruments Incorporated Analysis
Texas Instruments shows a mixed revenue trajectory, with 2025 revenue at 17.7B, up 13% from 2024 but down over the five-year span. Net income slipped to 5B in 2025, reflecting margin pressure despite a strong gross margin of 57%. EBIT margin remains robust at 35%, signaling operational efficiency amid fluctuating net margins.
Ambarella, Inc. Analysis
Ambarella posts a smaller scale with 285M revenue in 2025, growing 26% year-over-year and 28% over five years. Despite a favorable gross margin of 60.5%, Ambarella’s EBIT margin stays deeply negative at -44%, with net losses widening to -117M. Yet, recent improvements in EBIT and net margin growth suggest momentum gaining in operational control.
Margin Strength vs. Growth Potential
Texas Instruments dominates in absolute scale and margin quality, delivering superior operational efficiency and positive net income. Ambarella impresses with rapid revenue growth but struggles to convert sales into profits, sustaining large net losses. Investors seeking stable profitability will favor Texas Instruments, while those targeting high-growth turnaround might watch Ambarella’s progress cautiously.
Financial Ratios Comparison
These vital ratios act as a diagnostic tool to expose the underlying fiscal health, valuation premiums, and capital efficiency of the companies compared below:
| Ratios | Texas Instruments (TXN) | Ambarella (AMBA) |
|---|---|---|
| ROE | 30.7% | -20.9% |
| ROIC | 16.5% | -21.9% |
| P/E | 31.5 | -27.1 |
| P/B | 9.69 | 5.64 |
| Current Ratio | 4.35 | 2.65 |
| Quick Ratio | 2.83 | 2.36 |
| D/E (Debt-to-Equity) | 0.86 | 0.009 |
| Debt-to-Assets | 40.6% | 0.76% |
| Interest Coverage | 11.1 | 0 |
| Asset Turnover | 0.51 | 0.41 |
| Fixed Asset Turnover | 1.44 | 19.96 |
| Payout Ratio | 100% | 0% |
| Dividend Yield | 3.17% | 0% |
| Fiscal Year | 2025 | 2025 |
Efficiency & Valuation Duel: The Vital Signs
Financial ratios act as the company’s DNA, unveiling hidden risks and operational strengths behind headline numbers.
Texas Instruments Incorporated
Texas Instruments posts robust profitability with a 30.7% ROE and a strong 28.3% net margin, signaling operational excellence. However, its valuation looks stretched, marked by a 31.5 P/E and 9.7 P/B, suggesting premium pricing. The 3.17% dividend yield rewards shareholders, balancing growth reinvestment with steady income.
Ambarella, Inc.
Ambarella struggles with negative profitability: a -20.9% ROE and a -41.1% net margin reflect ongoing losses. Its P/E ratio is negative due to lack of earnings, while a 5.6 P/B indicates moderate market value. The company pays no dividends, aggressively reinvesting in R&D, though its financial health remains challenged.
Premium Valuation vs. Operational Distress
Texas Instruments offers a strong profitability foundation but trades at a premium, posing valuation risk. Ambarella shows financial distress with negative returns despite moderate valuation multiples. Investors seeking stability may prefer Texas Instruments, while those favoring turnaround potential face higher risk with Ambarella.
Which one offers the Superior Shareholder Reward?
I see Texas Instruments (TXN) delivers a superior shareholder reward compared to Ambarella (AMBA). TXN pays a consistent 3.17% dividend yield with nearly 100% payout ratio, signaling strong free cash flow coverage of 0.75x. It also pursues steady buybacks, supporting shareholder value. AMBA, in contrast, pays no dividends and posts losses with negative profit margins. Its reinvestment focuses on growth, but free cash flow remains modest at 0.57/share. TXN’s distribution model is more sustainable, balancing dividends and buybacks with solid cash flows. I conclude TXN offers the more attractive total return profile for 2026 investors.
Comparative Score Analysis: The Strategic Profile
The radar chart reveals the core financial DNA and strategic trade-offs between Texas Instruments and Ambarella, illustrating their competitive positioning:

Texas Instruments shows strength in profitability with top ROE and ROA scores (5 each), while Ambarella lags significantly in these areas (both 1). However, Ambarella maintains a healthier balance sheet with a better debt-to-equity score (4 vs. TXN’s 1). Both firms share moderate discounted cash flow scores (3), but Texas Instruments’ valuation metrics (P/E and P/B scores at 2 and 1) indicate potential overvaluation compared to Ambarella’s weaker pricing scores. Overall, Texas Instruments has a more balanced, profit-driven profile, whereas Ambarella relies on financial prudence and lower leverage amid weaker profitability.
Bankruptcy Risk: Solvency Showdown
The Altman Z-Scores of both Texas Instruments (10.19) and Ambarella (10.08) place them firmly in the safe zone:
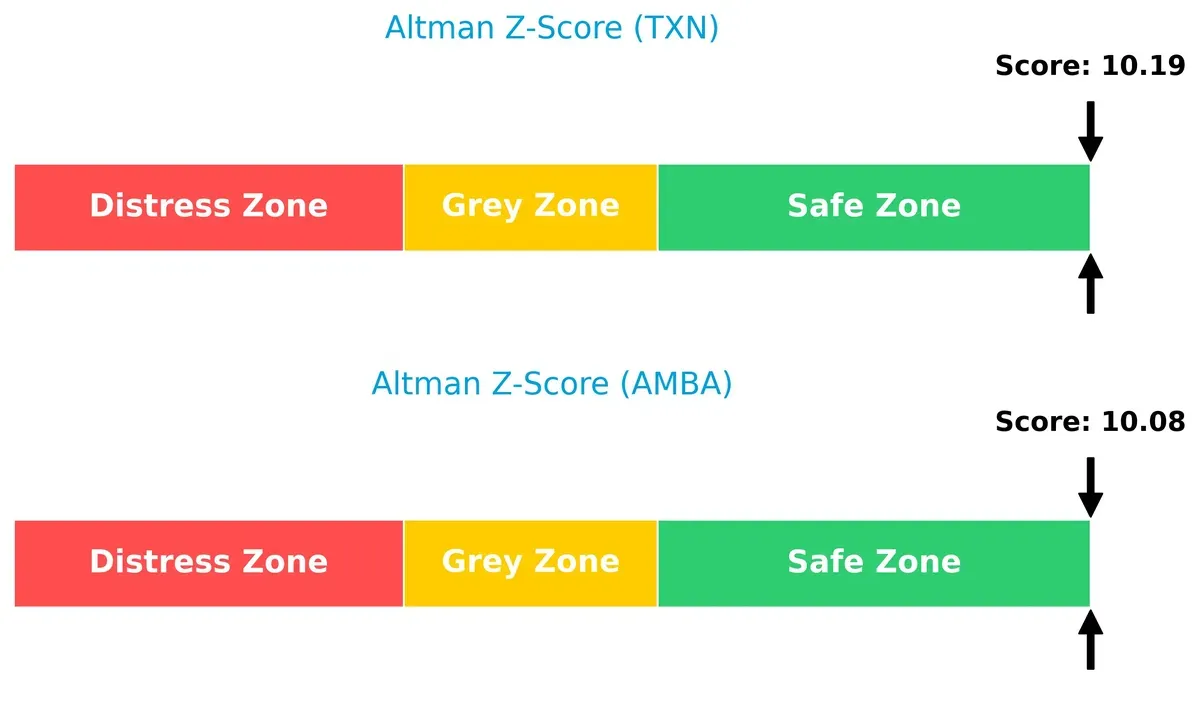
These high scores confirm both firms’ strong solvency and low bankruptcy risk in the current cycle. Their financial resilience provides investors confidence in their long-term survival despite sector volatility.
Financial Health: Quality of Operations
Texas Instruments’ Piotroski F-Score of 7 signals strong financial health, contrasting sharply with Ambarella’s weak score of 3, raising red flags:
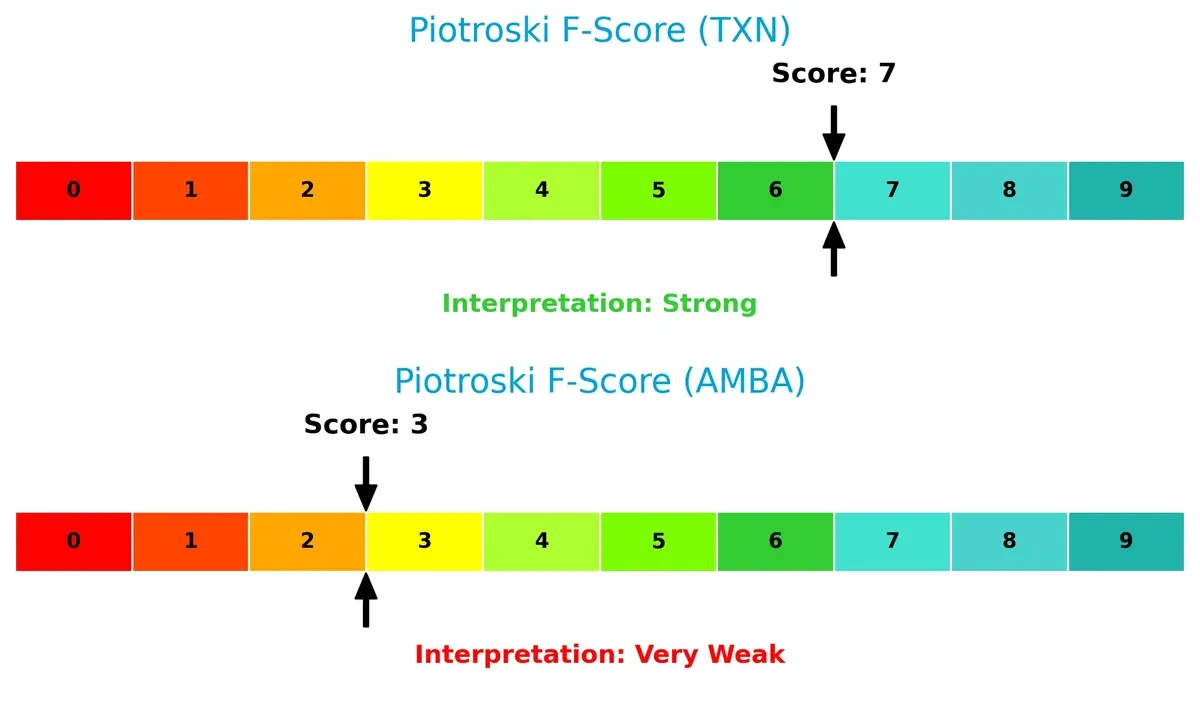
This gap suggests Texas Instruments executes superior operational efficiency, profitability, and balance sheet management. Ambarella’s low score highlights potential internal weaknesses and risks, cautioning investors about its underlying financial quality.
How are the two companies positioned?
This section dissects the operational DNA of TXN and AMBA by comparing their revenue distribution and internal dynamics. The goal is to confront their economic moats to identify which model delivers the most resilient competitive advantage today.
Revenue Segmentation: The Strategic Mix
The following comparison dissects how Texas Instruments Incorporated and Ambarella, Inc. diversify their income streams and reveals their primary sector bets:

Texas Instruments anchors its revenue in Analog, generating $14B in 2025, dwarfing its $2.7B Embedded Processing segment. This concentration signals a strong moat in analog infrastructure. Ambarella lacks available segmentation data, preventing a direct comparison. TXN’s reliance on Analog showcases ecosystem lock-in but also concentration risk if analog demand shifts. I see TXN as a classic example of focused dominance versus diversification uncertainty for AMBA.
Strengths and Weaknesses Comparison
This table compares the Strengths and Weaknesses of Texas Instruments Incorporated and Ambarella, Inc.:
Texas Instruments Strengths
- Strong profitability with 28.28% net margin and 30.73% ROE
- Favorable quick ratio of 2.83 and interest coverage of 11.52
- Diverse revenue from Analog and Embedded Processing segments
- Significant global presence with large revenues in US, China, and EMEA
- Dividend yield of 3.17% supports shareholder returns
Ambarella Strengths
- Favorable current and quick ratios indicating liquidity
- Minimal debt with 0.01 D/E and 0.76% debt to assets
- High fixed asset turnover at 19.96 suggests efficient asset use
- Favorable P/E ratio reflecting potential growth expectations
- Revenue concentrated in Asia Pacific and Taiwan markets
Texas Instruments Weaknesses
- Unfavorable valuation metrics with high P/E of 31.53 and PB of 9.69
- High current ratio of 4.35 may indicate inefficient asset usage
- Neutral debt levels at 0.86 D/E and 40.62% debt to assets
- Asset turnover relatively low at 0.51, limiting capital efficiency
- Limited innovation disclosure compared to Ambarella
Ambarella Weaknesses
- Negative profitability metrics with -41.12% net margin and -20.86% ROE
- Unfavorable WACC at 12.9% increases capital costs
- Interest coverage of 0 signals risk in meeting interest obligations
- Negative ROIC at -21.96% indicates value destruction
- No dividend yield, limiting income appeal to investors
Texas Instruments demonstrates strong profitability and global diversification but faces valuation and capital efficiency challenges. Ambarella shows solid liquidity and asset use but struggles with sustained profitability and financial risk. These factors shape each company’s strategic priorities.
The Moat Duel: Analyzing Competitive Defensibility
A structural moat alone shields long-term profits from relentless competitive erosion. Let’s dissect how Texas Instruments and Ambarella defend their turf:
Texas Instruments Incorporated: Cost Advantage Fortress
Texas Instruments leverages a durable cost advantage, reflected by a robust 35% EBIT margin and stable gross margins near 57%. Despite a declining ROIC trend, its scale and analog expertise deepen the moat, with growth potential in industrial and automotive markets in 2026.
Ambarella, Inc.: Innovation-Driven Network Effects
Ambarella’s moat stems from specialized AI and video processing chips, targeting niche markets like autonomous vehicles and security cameras. Yet, negative EBIT and net margins signal a fragile position. Its fast revenue growth hints at expansion, but profitability hurdles could weaken the moat further.
Scale and Cost Mastery vs. Niche Innovation Struggles
Texas Instruments holds the wider moat, generating consistent value above WACC despite ROIC decline. Ambarella battles profitability losses despite growth, making TI better equipped to defend market share in 2026’s competitive semiconductor landscape.
Which stock offers better returns?
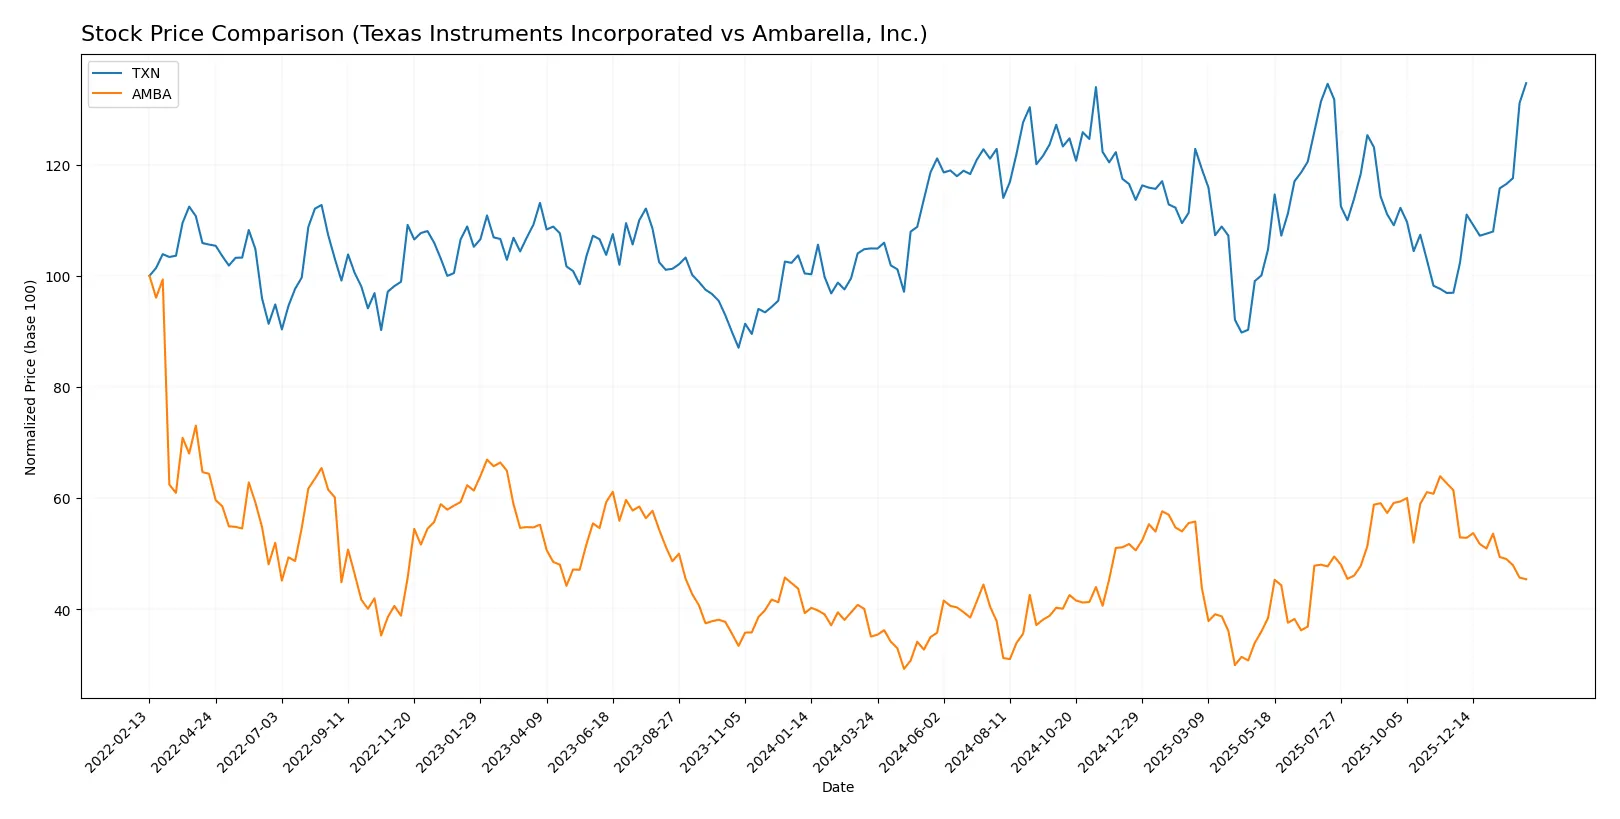
The past year shows clear divergence in stock price trends for Texas Instruments and Ambarella, marked by contrasting recent momentum and trading volume dynamics.
Trend Comparison
Texas Instruments’ stock rose 28.36% over the past 12 months, reflecting a bullish trend with accelerating gains and high volatility, peaking at 221.44 and bottoming at 147.6.
Ambarella’s stock increased 29.48% over the year, also bullish but with decelerating momentum, lower volatility than Texas Instruments, and a high of 89.67 and low of 40.99.
Texas Instruments outperformed recently with a 38.92% gain versus Ambarella’s 26.12% loss, showing stronger buyer dominance and accelerating price appreciation.
Target Prices
Analysts present a cautiously optimistic consensus on target prices for Texas Instruments and Ambarella.
| Company | Target Low | Target High | Consensus |
|---|---|---|---|
| Texas Instruments Incorporated | 160 | 260 | 204.64 |
| Ambarella, Inc. | 80 | 115 | 97.5 |
The target consensus for Texas Instruments sits below the current price of $221.44, indicating some room for downside risk. Ambarella’s consensus target of $97.5 stands significantly above its $63.64 market price, suggesting notable upside potential.

Don’t Let Luck Decide Your Entry Point
Optimize your entry points with our advanced ProRealTime indicators. You’ll get efficient buy signals with precise price targets for maximum performance. Start outperforming now!
How do institutions grade them?
Texas Instruments Incorporated Grades
Here are the latest institutional grades for Texas Instruments Incorporated:
| Grading Company | Action | New Grade | Date |
|---|---|---|---|
| Rosenblatt | Maintain | Buy | 2026-02-05 |
| Rosenblatt | Maintain | Buy | 2026-01-28 |
| Goldman Sachs | Maintain | Sell | 2026-01-28 |
| Deutsche Bank | Maintain | Hold | 2026-01-28 |
| Keybanc | Maintain | Overweight | 2026-01-28 |
| Stifel | Maintain | Hold | 2026-01-28 |
| Benchmark | Maintain | Buy | 2026-01-28 |
| Jefferies | Maintain | Hold | 2026-01-28 |
| B of A Securities | Upgrade | Neutral | 2026-01-28 |
| Wells Fargo | Maintain | Equal Weight | 2026-01-28 |
Ambarella, Inc. Grades
Below are the most recent institutional grades for Ambarella, Inc.:
| Grading Company | Action | New Grade | Date |
|---|---|---|---|
| Stifel | Maintain | Buy | 2025-11-26 |
| Rosenblatt | Maintain | Buy | 2025-11-26 |
| B of A Securities | Maintain | Neutral | 2025-11-26 |
| Needham | Maintain | Buy | 2025-11-26 |
| Rosenblatt | Maintain | Buy | 2025-11-24 |
| Northland Capital Markets | Maintain | Outperform | 2025-08-29 |
| Morgan Stanley | Maintain | Overweight | 2025-08-29 |
| Rosenblatt | Maintain | Buy | 2025-08-29 |
| Stifel | Maintain | Buy | 2025-08-29 |
| Oppenheimer | Maintain | Perform | 2025-08-29 |
Which company has the best grades?
Ambarella, Inc. consistently receives “Buy” and “Outperform” ratings, indicating stronger institutional confidence. Texas Instruments shows mixed grades, including “Sell” and “Hold,” signaling more cautious views. Investors may interpret Ambarella’s grades as more bullish, while Texas Instruments’ ratings suggest greater uncertainty.
Risks specific to each company
The following categories identify the critical pressure points and systemic threats facing both firms in the 2026 market environment:
1. Market & Competition
Texas Instruments Incorporated
- Dominates analog and embedded processing with broad end-market exposure, but faces intense semiconductor competition.
Ambarella, Inc.
- Focuses on niche video processing chips but struggles with negative margins and fierce market rivalry.
2. Capital Structure & Debt
Texas Instruments Incorporated
- Maintains moderate leverage (D/E 0.86) with strong interest coverage (11.5x), signaling solid debt management.
Ambarella, Inc.
- Virtually debt-free (D/E 0.01) but zero interest coverage indicates lack of earnings to cover fixed costs.
3. Stock Volatility
Texas Instruments Incorporated
- Beta near 1 (0.995) suggests market-aligned volatility, offering relative stability.
Ambarella, Inc.
- High beta (1.94) signals elevated price swings and higher investor risk.
4. Regulatory & Legal
Texas Instruments Incorporated
- Operates globally with typical semiconductor regulatory scrutiny; no major legal red flags evident.
Ambarella, Inc.
- Faces industry-specific compliance risks, especially in automotive and AI sectors, with no disclosed major legal issues.
5. Supply Chain & Operations
Texas Instruments Incorporated
- Established global manufacturing mitigates supply chain disruptions but semiconductor shortages remain a risk.
Ambarella, Inc.
- Smaller scale and specialized production increase vulnerability to supply chain shocks.
6. ESG & Climate Transition
Texas Instruments Incorporated
- Larger firm likely invests in ESG initiatives; no explicit risks reported but sector-wide pressure applies.
Ambarella, Inc.
- ESG risks under scrutiny due to AI applications; limited disclosures may concern investors.
7. Geopolitical Exposure
Texas Instruments Incorporated
- US-based with global sales; geopolitical tensions (e.g., US-China tech relations) could impact supply and sales.
Ambarella, Inc.
- Also US-based but smaller footprint; geopolitical disruptions can disproportionately affect operations.
Which company shows a better risk-adjusted profile?
Texas Instruments faces competitive and geopolitical risks but shows robust capital structure, stable stock volatility, and strong financial health. Ambarella’s niche focus, high stock volatility, and poor profitability raise significant concerns. TI’s Altman Z-score (10.19) and Piotroski score (7) confirm financial safety and strength. Ambarella’s similar Z-score (10.08) masks weak operational health, reflected in its low Piotroski score (3).
Texas Instruments’ single most impactful risk is competition in a cyclical semiconductor market. Ambarella’s major risk is sustained negative profitability undermining capital efficiency. TI’s balanced leverage and dividend yield contrast sharply with Ambarella’s financial fragility. Recent data show Ambarella’s negative net margin (-41%) and poor ROIC (-22%), justifying caution. Overall, Texas Instruments offers a superior risk-adjusted profile in 2026.
Final Verdict: Which stock to choose?
Texas Instruments Incorporated wields unmatched operational efficiency and a robust economic moat, consistently generating strong returns on invested capital. Its main point of vigilance is a relatively high valuation and stretched current ratio, suggesting careful monitoring of liquidity. This stock suits portfolios aiming for steady, long-term growth with moderate risk tolerance.
Ambarella, Inc. offers a strategic moat rooted in its cutting-edge R&D and promising revenue growth, despite recent profitability challenges. Its low leverage and healthier liquidity profile provide a safety cushion relative to Texas Instruments. It fits well in growth-at-a-reasonable-price portfolios that can endure volatility while banking on a turnaround.
If you prioritize durable profitability and capital efficiency, Texas Instruments outshines as the compelling choice due to its established economic moat and strong financial health. However, if you seek higher growth potential with tolerance for operational risks, Ambarella offers superior upside through innovation and revenue momentum, albeit with greater uncertainty.
Disclaimer: Investment carries a risk of loss of initial capital. The past performance is not a reliable indicator of future results. Be sure to understand risks before making an investment decision.
Go Further
I encourage you to read the complete analyses of Texas Instruments Incorporated and Ambarella, Inc. to enhance your investment decisions: