Home > Comparison > Technology > TER vs AMBA
The strategic rivalry between Teradyne, Inc. and Ambarella, Inc. shapes the semiconductor sector’s innovation frontier. Teradyne operates as a capital-intensive test equipment and automation provider, while Ambarella excels in high-margin, AI-driven video processing chips. This head-to-head encapsulates a broader clash between industrial scale and cutting-edge niche specialization. This analysis will determine which trajectory offers superior risk-adjusted returns for a diversified portfolio.

Table of contents
Companies Overview
Teradyne and Ambarella stand as pivotal players in the semiconductor sector, each commanding distinct market niches.
Teradyne, Inc.: Global Leader in Automated Test Equipment
Teradyne dominates the semiconductor testing market with its automatic test equipment across multiple segments, including Semiconductor Test and Industrial Automation. Its revenue stems from testing solutions for wafer-level devices, memory chips, and wireless communications. In 2026, Teradyne focuses strategically on expanding its Industrial Automation segment, leveraging robotics and autonomous systems to diversify beyond core semiconductor testing.
Ambarella, Inc.: Specialist in Video Semiconductor Solutions
Ambarella excels in system-on-a-chip designs for high-definition video processing and AI-driven computer vision. Its revenue primarily derives from chips used in automotive cameras, security systems, and consumer electronics. The company’s 2026 strategy centers on enhancing AI capabilities for autonomous vehicles and expanding its footprint in professional and consumer video markets.
Strategic Collision: Similarities & Divergences
Teradyne and Ambarella both innovate within semiconductors but pursue contrasting philosophies: Teradyne embraces a broad hardware-centric testing ecosystem, while Ambarella focuses on integrated AI-driven video processing chips. Their primary battleground is the expanding demand for intelligent automation and vision systems. Investors should note Teradyne’s scale and diversification versus Ambarella’s focused technology edge and growth potential.
Income Statement Comparison
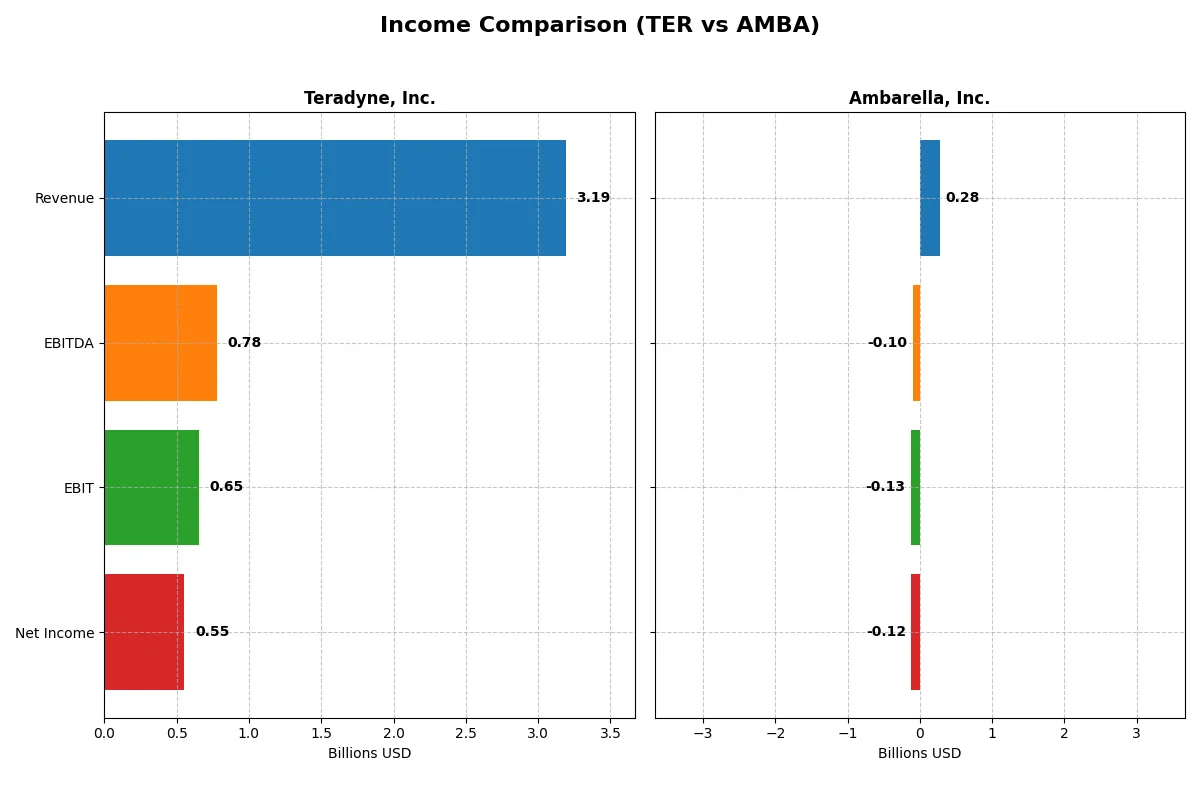
This data dissects the core profitability and scalability of both corporate engines to reveal who dominates the bottom line:
| Metric | Teradyne, Inc. (TER) | Ambarella, Inc. (AMBA) |
|---|---|---|
| Revenue | 3.19B | 285M |
| Cost of Revenue | 1.32B | 113M |
| Operating Expenses | 1.17B | 299M |
| Gross Profit | 1.87B | 172M |
| EBITDA | 780M | -101M |
| EBIT | 653M | -127M |
| Interest Expense | 8.0M | 0 |
| Net Income | 554M | -117M |
| EPS | 3.49 | -2.84 |
| Fiscal Year | 2025 | 2025 |
Income Statement Analysis: The Bottom-Line Duel
This income statement comparison reveals the true efficiency of Teradyne and Ambarella’s corporate engines through their revenue and profitability trends.
Teradyne, Inc. Analysis
Teradyne’s revenue dips 14% over five years but rebounds 13% in 2025 to $3.19B, driving gross profit growth. Its gross margin holds firm at 58.6%, signaling strong production efficiency. Despite a net income decline over five years, 2025’s $554M net income and 17.4% net margin show resilient profitability and improving EPS momentum.
Ambarella, Inc. Analysis
Ambarella’s revenue rises 28% across five years, hitting $285M in 2025 with a favorable 60.5% gross margin. Yet, persistent net losses culminate in a -41.1% net margin and -$117M net income in 2025. Though recent growth in revenue and EBIT signals operational progress, profitability remains elusive, reflecting ongoing cost challenges.
Margin Strength vs. Profitability Recovery
Teradyne commands superior scale and solid profitability, with consistently positive margins and net income. Ambarella shows promising revenue growth but struggles with deep losses and negative net margins. For investors prioritizing stable earnings, Teradyne’s profile offers a more attractive blend of margin strength and bottom-line resilience.
Financial Ratios Comparison
These vital ratios act as a diagnostic tool to expose the underlying fiscal health, valuation premiums, and capital efficiency of the companies compared below:
| Ratios | Teradyne, Inc. (TER) | Ambarella, Inc. (AMBA) |
|---|---|---|
| ROE | 19.2% (2024) | -20.9% (2025) |
| ROIC | 17.2% (2024) | -21.9% (2025) |
| P/E | 36.9 (2024) | -27.1 (2025) |
| P/B | 7.1 (2024) | 5.6 (2025) |
| Current Ratio | 2.91 (2024) | 2.65 (2025) |
| Quick Ratio | 1.84 (2024) | 2.36 (2025) |
| D/E | 0.05 (2024) | 0.01 (2025) |
| Debt-to-Assets | 3.6% (2024) | 0.8% (2025) |
| Interest Coverage | 166 (2024) | 0 (2025) |
| Asset Turnover | 0.76 (2024) | 0.41 (2025) |
| Fixed Asset Turnover | 4.88 (2024) | 20.0 (2025) |
| Payout ratio | 14.1% (2024) | 0% (2025) |
| Dividend yield | 0.38% (2024) | 0% (2025) |
| Fiscal Year | 2024 | 2025 |
Efficiency & Valuation Duel: The Vital Signs
Financial ratios act as a company’s DNA, unveiling hidden risks and operational strengths critical for investment decisions.
Teradyne, Inc.
Teradyne shows a strong net margin of 17.37%, signaling operational efficiency. However, its P/E ratio is stretched at 54.64, suggesting a pricey valuation. The company returns modest dividends at 0.25%, indicating some shareholder rewards while maintaining solid interest coverage at 81.43, reflecting financial stability.
Ambarella, Inc.
Ambarella suffers from negative profitability, with a net margin of -41.12% and negative ROE, indicating operational challenges. Its P/E ratio is favorable due to negative earnings, but the P/B ratio of 5.64 suggests an expensive stock relative to book value. Ambarella reinvests heavily in R&D but pays no dividends, reflecting a growth focus amid financial strain.
Premium Valuation vs. Operational Struggles
Teradyne balances solid profitability and financial health despite a high valuation. Ambarella’s metrics reveal deep profitability issues but a growth-oriented profile. Teradyne offers a safer risk-reward balance, while Ambarella suits investors targeting turnaround potential with higher risk tolerance.
Which one offers the Superior Shareholder Reward?
Teradyne, Inc. (TER) delivers a modest 0.38% dividend yield with a prudent 14% payout ratio, well-covered by free cash flow (FCF). It pairs this with consistent buybacks, reinforcing shareholder value. Ambarella, Inc. (AMBA) pays no dividend, reinvesting heavily in growth amid losses, with minimal buyback activity. TER’s balanced distribution and buyback program offer a more sustainable, attractive total return in 2026. I favor Teradyne for superior shareholder reward.
Comparative Score Analysis: The Strategic Profile
The radar chart reveals the core DNA and strategic trade-offs of Teradyne, Inc. and Ambarella, Inc., highlighting their financial strengths and weaknesses:
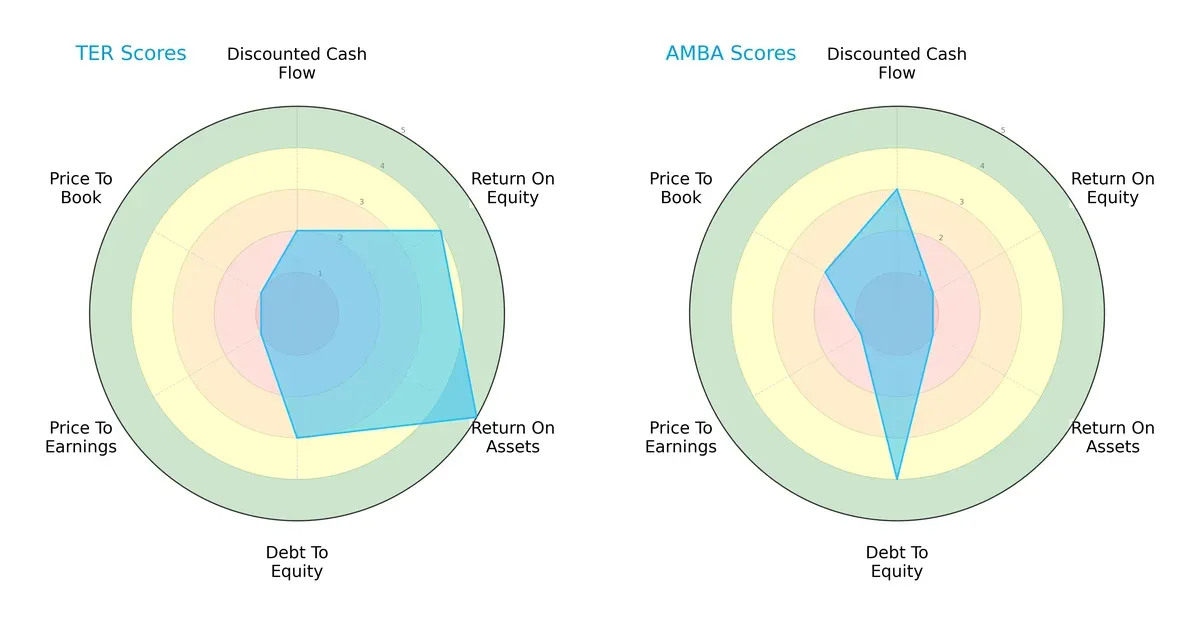
Teradyne delivers a more balanced financial profile with strong ROE (4) and ROA (5) scores, signaling efficient profitability and asset use. Ambarella leans on a lower debt-to-equity risk (4) but struggles with weak returns (ROE and ROA at 1). Both firms share very unfavorable valuations (P/E and P/B), but Teradyne’s moderate DCF score contrasts with Ambarella’s slight edge there. Overall, Teradyne’s diversified strength beats Ambarella’s niche financial stability.
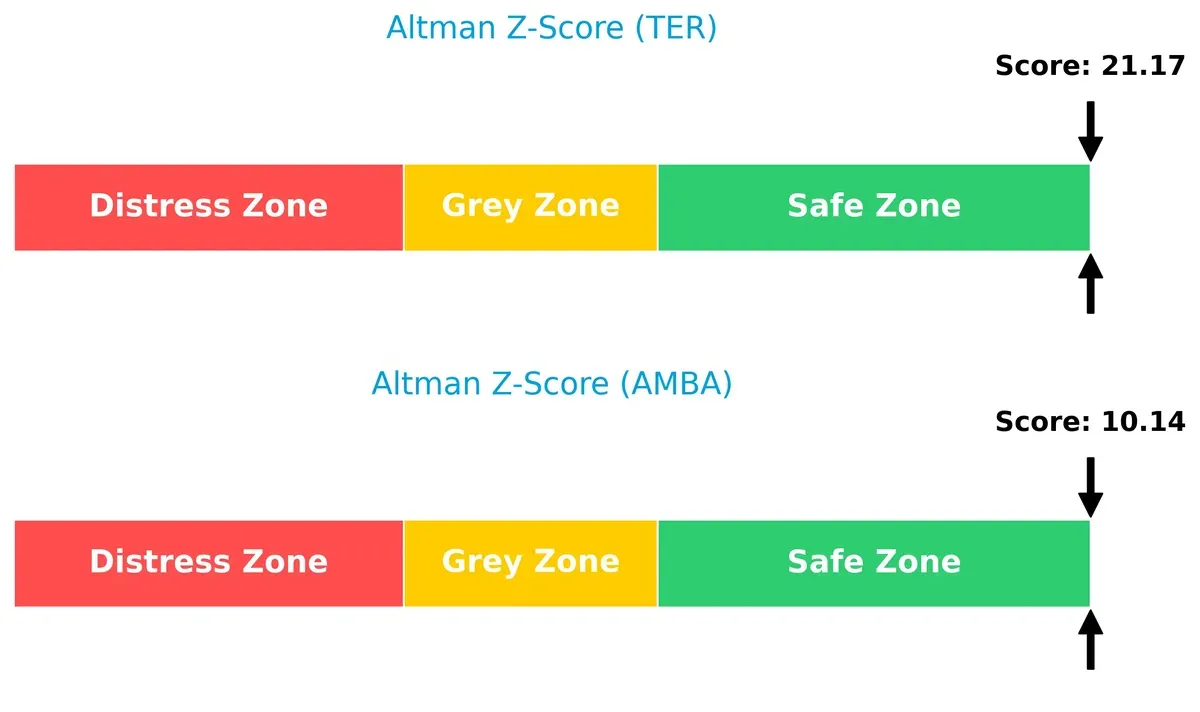
Bankruptcy Risk: Solvency Showdown
Teradyne’s Altman Z-Score (21.17) far exceeds Ambarella’s (10.14), both safely above distress thresholds, indicating robust long-term solvency for both, but with Teradyne commanding a stronger cushion:
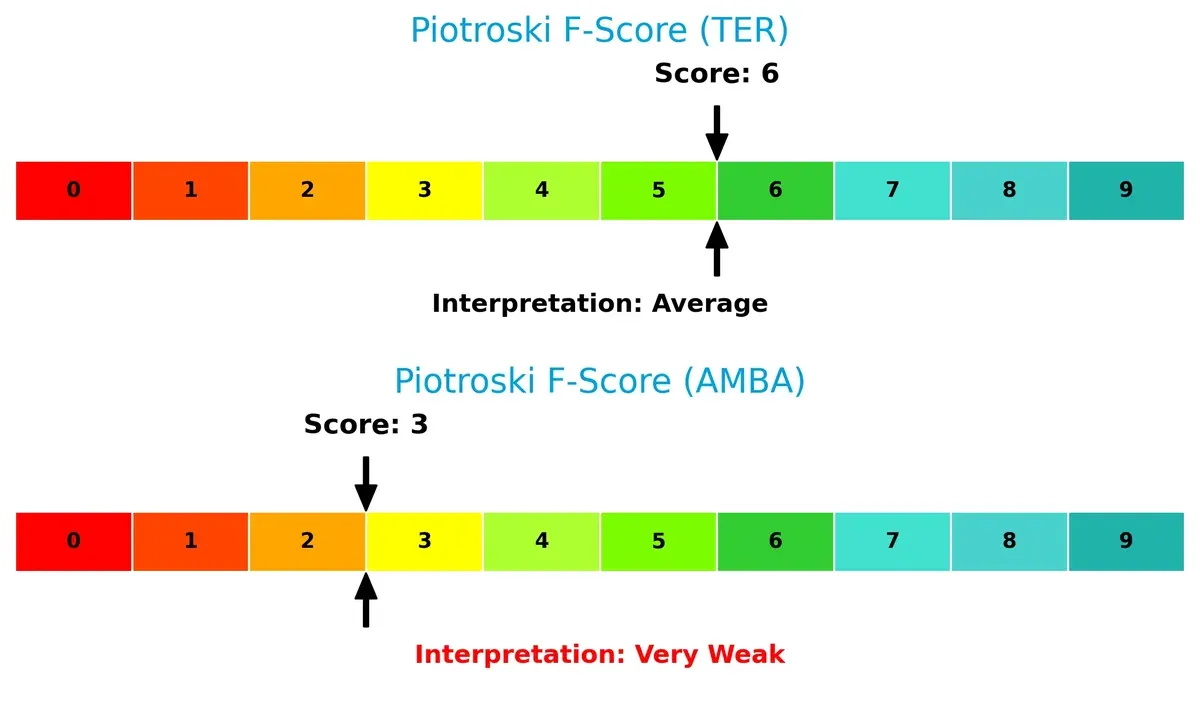
Financial Health: Quality of Operations
Teradyne’s Piotroski F-Score of 6 reflects solid operational health, while Ambarella’s score of 3 flags internal weaknesses, suggesting Teradyne maintains superior financial quality and fewer red flags:
How are the two companies positioned?
This section dissects the operational DNA of Teradyne and Ambarella by comparing their revenue distribution by segment and internal dynamics. The goal is to confront their economic moats and identify which model offers the most resilient and sustainable competitive advantage today.
Revenue Segmentation: The Strategic Mix
This visual comparison dissects how Teradyne, Inc. and Ambarella, Inc. diversify their income streams and reveals where their primary sector bets lie:
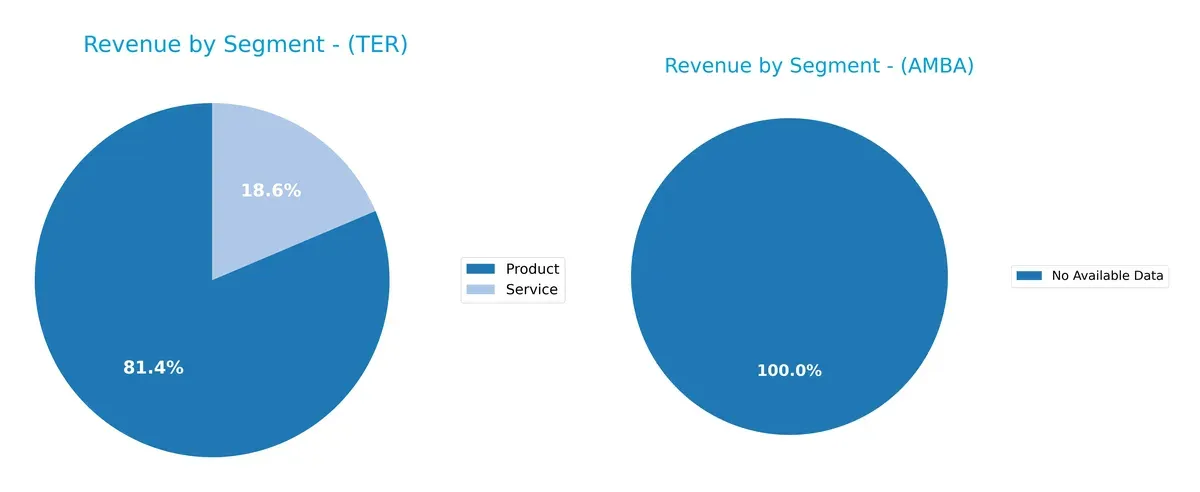
Teradyne anchors its revenue heavily in Product sales, with $2.3B in 2024, dwarfing its $525M Service segment. This concentration indicates a strong focus on product innovation and market leadership but carries moderate concentration risk. Ambarella lacks disclosed segmentation data, preventing a direct comparison. Teradyne’s reliance on product sales underscores its ecosystem lock-in strategy, crucial in semiconductor test and automation markets.
Strengths and Weaknesses Comparison
This table compares the Strengths and Weaknesses of Teradyne, Inc. and Ambarella, Inc.:
Teradyne Strengths
- Favorable net margin of 17.37%
- Low debt-to-assets ratio at 0%
- High interest coverage ratio of 81.43
- Diverse product and service revenue streams
- Broad global presence including strong Asia and US sales
Ambarella Strengths
- Strong current ratio of 2.65 and quick ratio of 2.36 indicating liquidity
- Low debt-to-assets ratio of 0.76%
- High fixed asset turnover at 19.96
- Global presence with focus on Asia Pacific and Taiwan markets
Teradyne Weaknesses
- Zero ROE and ROIC indicate profitability challenges
- Unfavorable P/E ratio at 54.64
- Unavailable WACC complicates cost of capital assessment
- Weak current and quick ratios at 0
- Low asset and fixed asset turnover
- Minimal dividend yield of 0.25%
Ambarella Weaknesses
- Negative net margin of -41.12% and ROE of -20.86%
- Unfavorable WACC at 12.97% and asset turnover at 0.41
- Negative P/E of -27.05 but high PB of 5.64
- No interest coverage ratio
- No dividend yield
Teradyne shows solid profitability and low leverage but struggles with returns and liquidity ratios. Ambarella maintains strong liquidity and asset efficiency but faces significant profitability and capital cost headwinds. These contrasts highlight differing financial and operational challenges shaping each company’s strategic focus.
The Moat Duel: Analyzing Competitive Defensibility
A structural moat is the sole barrier protecting long-term profits from relentless competition’s erosion. Let’s dissect Teradyne and Ambarella’s moats:
Teradyne, Inc.: Diverse Automation & Test Equipment Moat
Teradyne’s moat stems from its broad portfolio in semiconductor and industrial automation testing. Stable 20% EBIT margins reflect efficient capital use. Expansion into robotics offers growth but rising competition pressures its ROIC sustainability in 2026.
Ambarella, Inc.: Specialized AI Video Processing Moat
Ambarella’s moat relies on AI-driven video processing chips, targeting automotive and security markets. Despite a niche focus, negative EBIT margins and declining ROIC signal trouble. However, growing revenue and AI adoption could spark a turnaround if profitability improves.
Verdict: Broad Industrial Scale vs. Niche AI Innovation
Teradyne’s wider moat benefits from diverse product lines and stable profitability. Ambarella’s deeper tech moat is undermined by persistent losses and shrinking ROIC. Teradyne is better positioned to defend market share against competitive threats in 2026.
Which stock offers better returns?
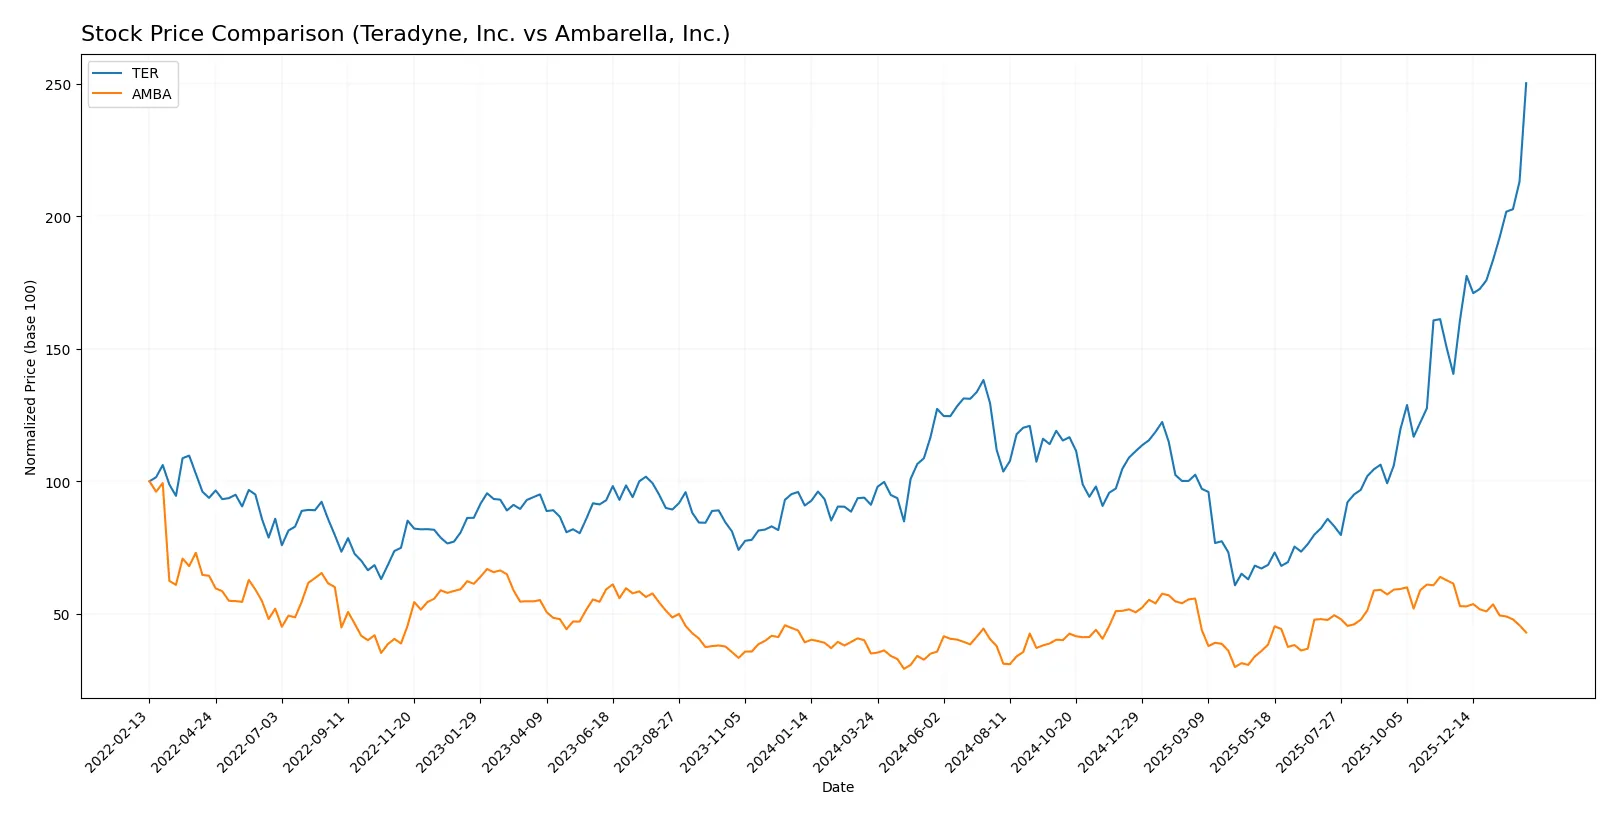
Over the past year, Teradyne, Inc. and Ambarella, Inc. displayed divergent stock price dynamics, with Teradyne showing strong upward momentum and Ambarella facing recent downward pressures.
Trend Comparison
Teradyne, Inc. posted a robust 174.58% price increase over the past 12 months, reflecting a bullish trend with accelerating gains and a high volatility measured by a 39.72 standard deviation.
Ambarella, Inc. recorded a 22.54% price increase over the same period, indicating a bullish but decelerating trend with moderate volatility at a 12.78 standard deviation.
Teradyne’s stock outperformed Ambarella’s by a significant margin despite recent volatility, delivering substantially higher market returns over the past year.
Target Prices
Analysts set a clear price target consensus for Teradyne, Inc. and Ambarella, Inc.
| Company | Target Low | Target High | Consensus |
|---|---|---|---|
| Teradyne, Inc. | 175 | 300 | 251.17 |
| Ambarella, Inc. | 80 | 115 | 97.5 |
Teradyne’s consensus target of 251.17 sits slightly below its current price of 282.98, signaling modest downside risk. Ambarella’s 97.5 target suggests substantial upside from its 60.23 market price.

Don’t Let Luck Decide Your Entry Point
Optimize your entry points with our advanced ProRealTime indicators. You’ll get efficient buy signals with precise price targets for maximum performance. Start outperforming now!
How do institutions grade them?
Teradyne, Inc. Grades
The following table shows recent grades from reputable analysts for Teradyne, Inc.:
| Grading Company | Action | New Grade | Date |
|---|---|---|---|
| Evercore ISI Group | maintain | Outperform | 2026-02-03 |
| Cantor Fitzgerald | maintain | Overweight | 2026-02-02 |
| Stifel | maintain | Buy | 2026-01-30 |
| UBS | maintain | Buy | 2026-01-26 |
| B of A Securities | maintain | Buy | 2026-01-22 |
| Stifel | maintain | Buy | 2026-01-14 |
| B of A Securities | maintain | Buy | 2026-01-13 |
| Goldman Sachs | upgrade | Buy | 2025-12-16 |
| Stifel | upgrade | Buy | 2025-12-02 |
| Citigroup | maintain | Buy | 2025-11-12 |
Ambarella, Inc. Grades
The following table summarizes recent analyst grades for Ambarella, Inc.:
| Grading Company | Action | New Grade | Date |
|---|---|---|---|
| B of A Securities | maintain | Neutral | 2025-11-26 |
| Rosenblatt | maintain | Buy | 2025-11-26 |
| Stifel | maintain | Buy | 2025-11-26 |
| Needham | maintain | Buy | 2025-11-26 |
| Rosenblatt | maintain | Buy | 2025-11-24 |
| B of A Securities | maintain | Neutral | 2025-08-29 |
| Northland Capital Markets | maintain | Outperform | 2025-08-29 |
| Morgan Stanley | maintain | Overweight | 2025-08-29 |
| Oppenheimer | maintain | Perform | 2025-08-29 |
| Rosenblatt | maintain | Buy | 2025-08-29 |
Which company has the best grades?
Teradyne consistently earns Buy or better grades from leading firms, showing strong analyst confidence. Ambarella receives a mix of Buy, Neutral, and Outperform ratings, reflecting more varied sentiment. This difference could influence investor perception of stability and growth prospects.
Risks specific to each company
The following categories outline the critical pressure points and systemic threats facing Teradyne, Inc. and Ambarella, Inc. in the 2026 market environment:
1. Market & Competition
Teradyne, Inc.
- Operates in diverse semiconductor test segments, facing intense competition from established players and fabless firms.
Ambarella, Inc.
- Focuses on video semiconductor solutions, competing with larger chip designers and emerging AI-driven competitors.
2. Capital Structure & Debt
Teradyne, Inc.
- Maintains a low debt-to-equity ratio and strong interest coverage, indicating prudent leverage management.
Ambarella, Inc.
- Exhibits minimal debt but struggles with interest coverage, signaling potential liquidity constraints.
3. Stock Volatility
Teradyne, Inc.
- Beta at 1.82 suggests above-market volatility, common in tech but manageable with strong fundamentals.
Ambarella, Inc.
- Higher beta near 1.94 reflects elevated price swings, increasing risk for risk-averse investors.
4. Regulatory & Legal
Teradyne, Inc.
- Operates globally with exposure to export controls and semiconductor trade policies.
Ambarella, Inc.
- Faces regulatory scrutiny in AI and video surveillance markets, heightening compliance risks.
5. Supply Chain & Operations
Teradyne, Inc.
- Relies on global semiconductor supply chains; vulnerable to chip shortages and geopolitical disruptions.
Ambarella, Inc.
- Dependent on foundries and component suppliers, susceptible to manufacturing delays and cost inflation.
6. ESG & Climate Transition
Teradyne, Inc.
- Increasing focus on sustainability in industrial automation; moderate ESG risk profile.
Ambarella, Inc.
- Faces challenges integrating ESG into product lifecycle amid growing regulatory ESG demands.
7. Geopolitical Exposure
Teradyne, Inc.
- Sensitive to US-China tensions impacting semiconductor equipment exports.
Ambarella, Inc.
- Exposure to Asian markets complicates risk from shifting trade policies and supply chain localization.
Which company shows a better risk-adjusted profile?
Teradyne’s strongest risk is market competition in a cyclical semiconductor sector. Ambarella’s greatest risk lies in weak profitability and liquidity amid stiff competition and regulatory pressures. Teradyne’s robust debt management and safer Altman Z-score underpin a superior risk-adjusted profile. Ambarella’s profitability deficits and low Piotroski score raise red flags. The widening net margin gap confirms Teradyne’s more resilient financial footing in 2026.
Final Verdict: Which stock to choose?
Teradyne, Inc. (TER) shines as a cash-generating powerhouse with a solid operational track record. Its ability to sustain healthy margins and generate free cash flow underpins its financial strength. However, investors should monitor its declining long-term profitability as a point of vigilance. TER suits portfolios seeking steady, aggressive growth backed by operational resilience.
Ambarella, Inc. (AMBA) boasts a strategic moat rooted in its advanced R&D capabilities and niche market presence. Its relatively strong liquidity and low leverage profile offer a safer cushion compared to TER. Yet, AMBA’s ongoing value destruction and negative returns highlight elevated risk. It fits growth-at-a-reasonable-price (GARP) portfolios willing to bet on a turnaround.
If you prioritize operational efficiency and cash flow reliability, Teradyne outshines with better stability despite valuation concerns. However, if you seek speculative growth with potential upside from innovation, Ambarella offers an analytical scenario for risk-tolerant investors, albeit with a higher chance of value erosion.
Disclaimer: Investment carries a risk of loss of initial capital. The past performance is not a reliable indicator of future results. Be sure to understand risks before making an investment decision.
Go Further
I encourage you to read the complete analyses of Teradyne, Inc. and Ambarella, Inc. to enhance your investment decisions: