In the dynamic semiconductor industry, Taiwan Semiconductor Manufacturing Company Limited (TSM) and Ambarella, Inc. (AMBA) stand out for their distinct yet overlapping innovations. TSM dominates wafer fabrication with cutting-edge manufacturing processes, while Ambarella excels in system-on-chip solutions for video and AI applications. Comparing these leaders reveals different growth paths and market focuses. Join me as we explore which company presents the more compelling investment opportunity in 2026.

Table of contents
Companies Overview
I will begin the comparison between Taiwan Semiconductor Manufacturing Company Limited and Ambarella, Inc. by providing an overview of these two companies and their main differences.
Taiwan Semiconductor Manufacturing Company Limited Overview
Taiwan Semiconductor Manufacturing Company Limited (TSM) is a global leader in semiconductor manufacturing, providing wafer fabrication services and integrated circuits. Founded in 1987 and headquartered in Hsinchu City, Taiwan, TSM serves diverse markets including high performance computing, smartphones, IoT, automotive, and digital consumer electronics. It operates internationally, emphasizing advanced technology development and comprehensive engineering support.
Ambarella, Inc. Overview
Ambarella, Inc. (AMBA) specializes in semiconductor solutions for video processing and AI computer vision, focusing on HD and ultra HD compression technologies. Established in 2004 and based in Santa Clara, California, Ambarella targets automotive cameras, security systems, robotics, and consumer electronics markets. Its single-chip system-on-a-chip designs integrate video, image, and audio processing to deliver low power consumption and enhanced functionality.
Key similarities and differences
Both companies operate in the semiconductor sector but differ significantly in scale and focus. TSM is a massive contract manufacturer serving a broad range of semiconductor needs globally, while Ambarella is a smaller, specialized designer of video and AI processing chips, primarily targeting niche markets such as automotive and security. TSM’s business model emphasizes manufacturing and technology services, whereas Ambarella focuses on integrated system solutions and chip design for video applications.
Income Statement Comparison
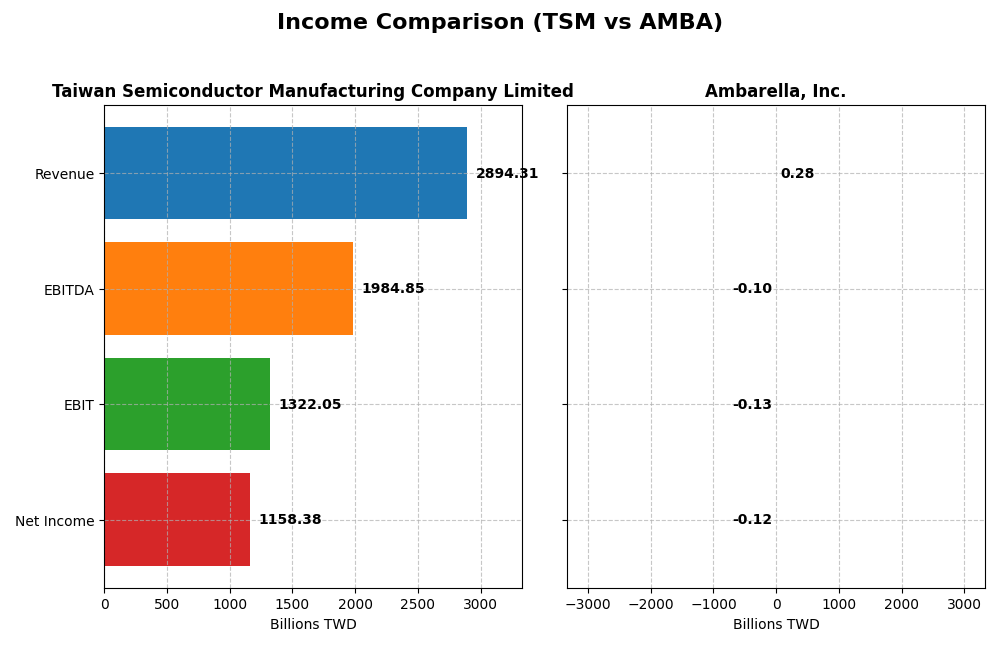
The table below presents the latest fiscal year income statement figures for Taiwan Semiconductor Manufacturing Company Limited and Ambarella, Inc., highlighting key financial metrics for a straightforward comparison.
| Metric | Taiwan Semiconductor Manufacturing Company Limited | Ambarella, Inc. |
|---|---|---|
| Market Cap | 1.7T TWD | 2.7B USD |
| Revenue | 2.89T TWD | 285M USD |
| EBITDA | 1.98T TWD | -101M USD |
| EBIT | 1.32T TWD | -127M USD |
| Net Income | 1.16T TWD | -117M USD |
| EPS | 223.4 TWD | -2.84 USD |
| Fiscal Year | 2024 | 2025 |
Income Statement Interpretations
Taiwan Semiconductor Manufacturing Company Limited
Taiwan Semiconductor Manufacturing Company Limited (TSM) has shown strong revenue growth, rising from 1.34T TWD in 2020 to 2.89T TWD in 2024, with net income increasing from 510B to 1.16T TWD. Margins remain solid, with a gross margin of 56.12% and net margin near 40%. The latest year saw revenue growth accelerate by 33.9%, while net margin held stable, indicating robust profitability.
Ambarella, Inc.
Ambarella, Inc. (AMBA) experienced revenue growth from $223M in 2021 to $285M in 2025, a moderate increase of 27.75% over the period. However, net income declined sharply, reaching a loss of $117M in 2025 from a loss of $60M in 2021. Despite a favorable gross margin of 60.5%, both EBIT and net margins remain negative, though recent year improvements suggest some operational progress.
Which one has the stronger fundamentals?
TSM demonstrates stronger fundamentals with consistent revenue and net income growth, healthy profit margins, and favorable income statement metrics across the board. AMBA shows some revenue gains but suffers from persistent net losses and unfavorable EBIT and net margins. Overall, TSM’s financials exhibit greater stability and profitability compared to AMBA’s more volatile performance.
Financial Ratios Comparison
The table below presents the most recent financial ratios for Taiwan Semiconductor Manufacturing Company Limited (TSM) and Ambarella, Inc. (AMBA), reflecting their latest fiscal year data.
| Ratios | TSM (2024) | AMBA (2025) |
|---|---|---|
| ROE | 27.3% | -20.9% |
| ROIC | 20.0% | -21.9% |
| P/E | 29.0 | -27.1 |
| P/B | 7.92 | 5.64 |
| Current Ratio | 2.36 | 2.65 |
| Quick Ratio | 2.14 | 2.36 |
| D/E | 0.25 | 0.0094 |
| Debt-to-Assets | 15.6% | 0.76% |
| Interest Coverage | 126.0 | 0 |
| Asset Turnover | 0.43 | 0.41 |
| Fixed Asset Turnover | 0.88 | 19.96 |
| Payout ratio | 31.3% | 0 |
| Dividend yield | 1.08% | 0 |
Interpretation of the Ratios
Taiwan Semiconductor Manufacturing Company Limited
TSM shows strong profitability with a net margin of 40.02% and a return on equity of 27.29%, but valuation ratios like PE at 29.04 and PB at 7.92 seem stretched. Its liquidity and debt management are favorable, supported by a current ratio of 2.36 and a low debt-to-assets of 15.65%. The company pays dividends with a 1.08% yield, indicating moderate shareholder returns supported by solid free cash flow.
Ambarella, Inc.
AMBA’s financial ratios reflect challenges with negative net margin (-41.12%) and return on equity (-20.86%), signaling weak profitability and returns. Though liquidity metrics are strong, including a current ratio of 2.65, the company does not pay dividends, consistent with its negative earnings and focus on reinvestment and R&D, which accounts for nearly 79% of revenue. Shareholder returns rely on growth prospects rather than income distribution.
Which one has the best ratios?
TSM exhibits a generally favorable ratio profile with strong profitability, sound liquidity, and manageable debt, despite some valuation concerns. In contrast, AMBA’s ratios indicate financial stress with negative profitability and no dividend returns, reflecting a less favorable position. Overall, TSM’s ratios present a more robust financial standing compared to AMBA.
Strategic Positioning
This section compares the strategic positioning of Taiwan Semiconductor Manufacturing Company Limited (TSM) and Ambarella, Inc. (AMBA) in terms of market position, key segments, and exposure to technological disruption:
Taiwan Semiconductor Manufacturing Company Limited
- Leading global semiconductor manufacturer facing intense competition in wafer fabrication.
- Focuses on wafer fabrication processes and integrated circuits for computing, smartphones, automotive, and IoT.
- Exposed to technological disruption via advanced wafer fabrication and process innovation investments.
Ambarella, Inc.
- Smaller semiconductor player specializing in video processing chips, operating in a niche market.
- Develops system-on-a-chip solutions for automotive cameras, security, robotics, and consumer video devices.
- Faces disruption risks in fast-evolving AI vision and video compression technologies.
Taiwan Semiconductor Manufacturing Company Limited vs Ambarella, Inc. Positioning
TSM has a diversified business with a broad wafer fabrication portfolio serving multiple end markets, while AMBA concentrates on video and AI vision semiconductor solutions. TSM benefits from scale and global reach, whereas AMBA targets specialized technology segments.
Which has the best competitive advantage?
TSM shows a slightly favorable moat with consistent value creation despite declining profitability. AMBA’s moat is very unfavorable, indicating value destruction and decreasing profitability, reflecting weaker competitive advantage.
Stock Comparison
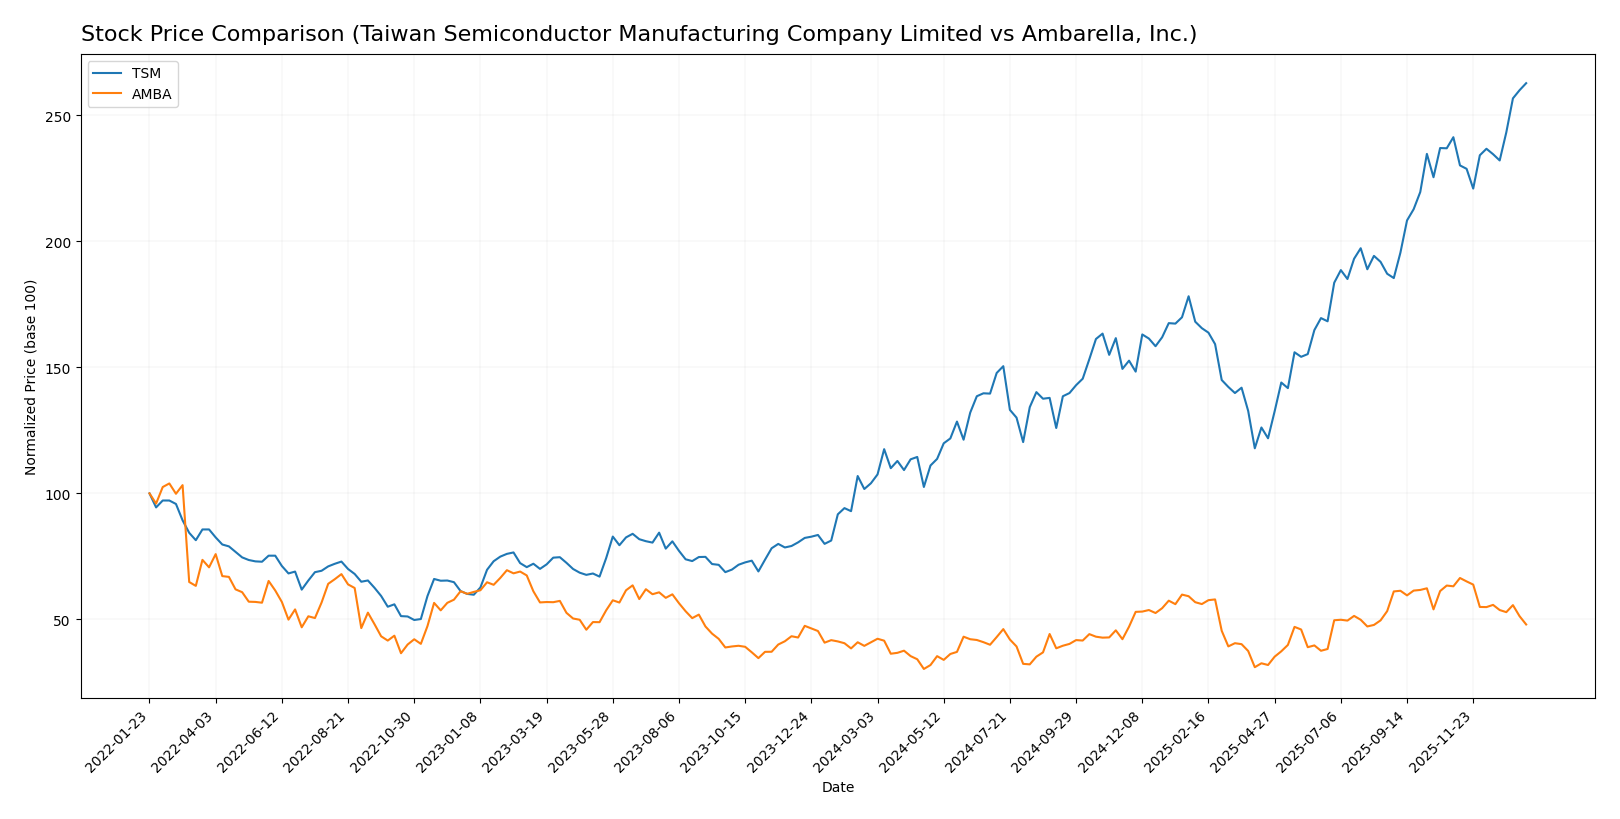
The past year has seen significant price movements with TSM exhibiting strong bullish momentum and accelerating gains, while AMBA experienced moderate bullish growth overall but recent bearish pressures.
Trend Analysis
Taiwan Semiconductor Manufacturing Company Limited (TSM) showed a robust bullish trend over the past 12 months with a 152.54% price increase, accelerating price gains, and a high volatility level indicated by a 51.25 standard deviation.
Ambarella, Inc. (AMBA) posted a 17.26% price gain over the same period, indicating a bullish trend but with decelerating momentum and lower volatility at a 12.81 standard deviation.
Comparing both stocks, TSM delivered the highest market performance with a substantially greater price increase and acceleration compared to AMBA’s moderate growth and recent downward trend.
Target Prices
Analysts present a generally optimistic consensus on target prices for these semiconductor companies.
| Company | Target High | Target Low | Consensus |
|---|---|---|---|
| Taiwan Semiconductor Manufacturing Company Limited | 400 | 330 | 361.25 |
| Ambarella, Inc. | 115 | 80 | 97.5 |
The consensus target prices for TSM and AMBA exceed their current stock prices of 327.11 and 64.8 respectively, indicating analysts expect upside potential for both stocks in the near term.
Analyst Opinions Comparison
This section compares analysts’ ratings and grades for Taiwan Semiconductor Manufacturing Company Limited and Ambarella, Inc.:
Rating Comparison
TSM Rating
- Rating: A- indicating a very favorable overall assessment of financial standing.
- Discounted Cash Flow Score: 5, very favorable, signals strong future cash flow projections.
- ROE Score: 5, very favorable, showing efficient profit generation from equity.
- ROA Score: 5, very favorable, demonstrating effective asset utilization.
- Debt To Equity Score: 3, moderate, indicating balanced financial risk.
- Overall Score: 4, favorable, summarizing strong financial health.
AMBA Rating
- Rating: C+ reflecting a moderate overall assessment.
- Discounted Cash Flow Score: 3, moderate, suggests average valuation prospects.
- ROE Score: 1, very unfavorable, indicating weak profitability from equity.
- ROA Score: 1, very unfavorable, showing poor asset efficiency.
- Debt To Equity Score: 4, favorable, reflecting lower reliance on debt.
- Overall Score: 2, moderate, reflecting weaker financial performance overall.
Which one is the best rated?
Based strictly on provided data, TSM is better rated with a higher overall score of 4 versus AMBA’s 2. TSM shows very favorable returns on equity and assets and stronger discounted cash flow prospects, while AMBA scores lower in profitability metrics but has a slightly better debt-to-equity score.
Scores Comparison
Here is a comparison of the Altman Z-Score and Piotroski Score for the two companies:
TSM Scores
- Altman Z-Score: 2.94, indicating moderate bankruptcy risk in the grey zone.
- Piotroski Score: 8, reflecting very strong financial health.
AMBA Scores
- Altman Z-Score: 10.69, indicating very low bankruptcy risk in the safe zone.
- Piotroski Score: 3, reflecting very weak financial health.
Which company has the best scores?
Based on the provided data, AMBA has a significantly higher Altman Z-Score, signaling very low bankruptcy risk, while TSM has a much stronger Piotroski Score, indicating better financial health. Each excels in different score categories.
Grades Comparison
Here is a comparison of recent grades and ratings for Taiwan Semiconductor Manufacturing Company Limited and Ambarella, Inc.:
Taiwan Semiconductor Manufacturing Company Limited Grades
The table below shows recent grades assigned by reputable grading companies for Taiwan Semiconductor Manufacturing Company Limited:
| Grading Company | Action | New Grade | Date |
|---|---|---|---|
| Bernstein | Maintain | Outperform | 2025-12-08 |
| Needham | Maintain | Buy | 2025-10-27 |
| Barclays | Maintain | Overweight | 2025-10-17 |
| Needham | Maintain | Buy | 2025-10-16 |
| Susquehanna | Maintain | Positive | 2025-10-10 |
| Barclays | Maintain | Overweight | 2025-10-09 |
| Barclays | Maintain | Overweight | 2025-09-16 |
| Needham | Maintain | Buy | 2025-07-17 |
| Susquehanna | Maintain | Positive | 2025-07-14 |
| Needham | Maintain | Buy | 2025-07-01 |
Taiwan Semiconductor consistently maintains positive ratings, predominantly “Buy” and “Outperform,” reflecting stable confidence among analysts.
Ambarella, Inc. Grades
The table below summarizes recent grades assigned by recognized grading companies for Ambarella, Inc.:
| Grading Company | Action | New Grade | Date |
|---|---|---|---|
| B of A Securities | Maintain | Neutral | 2025-11-26 |
| Needham | Maintain | Buy | 2025-11-26 |
| Stifel | Maintain | Buy | 2025-11-26 |
| Rosenblatt | Maintain | Buy | 2025-11-26 |
| Rosenblatt | Maintain | Buy | 2025-11-24 |
| Stifel | Maintain | Buy | 2025-08-29 |
| Needham | Maintain | Buy | 2025-08-29 |
| Northland Capital Markets | Maintain | Outperform | 2025-08-29 |
| Morgan Stanley | Maintain | Overweight | 2025-08-29 |
| Oppenheimer | Maintain | Perform | 2025-08-29 |
Ambarella shows a generally positive consensus with multiple “Buy” and “Outperform” ratings, though some variation exists including a “Neutral” and “Perform” rating.
Which company has the best grades?
Both companies have an overall “Buy” consensus, but Taiwan Semiconductor Manufacturing Company Limited shows a more uniform positive grade pattern with repeated “Buy” and “Outperform” ratings, indicating stronger analyst conviction. Ambarella, Inc. presents a wider spread of ratings, which may suggest slightly higher uncertainty for investors.
Strengths and Weaknesses
The table below compares key strengths and weaknesses of Taiwan Semiconductor Manufacturing Company Limited (TSM) and Ambarella, Inc. (AMBA), based on recent financial performance and strategic positioning.
| Criterion | Taiwan Semiconductor Manufacturing Company Limited (TSM) | Ambarella, Inc. (AMBA) |
|---|---|---|
| Diversification | High revenue from wafer production and other products; well diversified within semiconductor manufacturing segments | Limited product range focused mainly on video processing chips; lower diversification |
| Profitability | Strong profitability with 40.02% net margin and 27.29% ROE; creating value with ROIC > WACC | Negative net margin (-41.12%) and ROE (-20.86%); destroying value with ROIC < WACC |
| Innovation | Consistent investment in advanced semiconductor tech; strong global demand supports R&D | Innovation challenges shown by declining ROIC and profitability; struggling to sustain competitive edge |
| Global presence | Established global leader in semiconductor manufacturing with extensive client base | Smaller scale and niche market presence; less global penetration |
| Market Share | Dominant market share in wafer foundry segment, revenues in TWD 1.99T for wafers in 2022 | Smaller market share and revenue base; no recent product segmentation data available |
Key takeaways: TSM exhibits strong financial health and global leadership, though its profitability shows signs of decline. AMBA faces significant financial challenges with shrinking profitability and value destruction, highlighting higher investment risk. Investors should weigh TSM’s stability against AMBA’s volatility and uncertain turnaround prospects.
Risk Analysis
Below is a comparative table presenting key risk factors for Taiwan Semiconductor Manufacturing Company Limited (TSM) and Ambarella, Inc. (AMBA) as of the most recent fiscal years:
| Metric | Taiwan Semiconductor Manufacturing Company Limited (TSM) | Ambarella, Inc. (AMBA) |
|---|---|---|
| Market Risk | Beta 1.274, stable in semiconductor sector | Beta 1.953, higher volatility |
| Debt level | Debt-to-Equity 0.25 (favorable), low leverage | Debt-to-Equity 0.01 (very low) |
| Regulatory Risk | Exposure to Taiwan-China geopolitical tensions | US-based, less geopolitical risk |
| Operational Risk | Large scale manufacturing, supply chain dependent | Smaller scale, niche products |
| Environmental Risk | Moderate, semiconductor manufacturing impacts | Lower, focused on semiconductor chips for video |
| Geopolitical Risk | High, due to Taiwan-China relations | Moderate, US-China trade tensions |
TSM faces significant geopolitical risk due to its Taiwan base amid China tensions, which could impact supply chains. AMBA’s higher market volatility and unfavorable profitability ratios pose operational and financial risks. TSM’s strong financial health contrasts with AMBA’s current earnings challenges.
Which Stock to Choose?
Taiwan Semiconductor Manufacturing Company Limited (TSM) shows strong income growth with a 33.89% revenue increase in one year and favorable profitability metrics, including a 40.02% net margin and 27.29% ROE. Its debt levels are low with a net debt to EBITDA of -0.54 and a current ratio of 2.36, supporting a very favorable A- rating.
Ambarella, Inc. (AMBA) exhibits positive revenue growth of 25.78% but suffers from negative profitability, including a -41.12% net margin and -20.86% ROE. The company maintains low debt with a debt-to-equity ratio of 0.01 but faces challenges reflected in its very unfavorable financial ratios and a moderate C+ rating.
For investors, TSM’s favorable rating, robust income statement, and overall positive ratio evaluations could appeal to those seeking quality and stability, while AMBA’s mixed signals with negative profitability but ongoing revenue growth might attract risk-tolerant investors focused on turnaround potential.
Disclaimer: Investment carries a risk of loss of initial capital. The past performance is not a reliable indicator of future results. Be sure to understand risks before making an investment decision.
Go Further
I encourage you to read the complete analyses of Taiwan Semiconductor Manufacturing Company Limited and Ambarella, Inc. to enhance your investment decisions: