Home > Comparison > Technology > STM vs AMBA
The strategic rivalry between STMicroelectronics N.V. and Ambarella, Inc. shapes the semiconductor industry’s future. STMicroelectronics operates as a diversified, capital-intensive technology leader with a broad product portfolio spanning automotive to industrial markets. Ambarella, by contrast, specializes in high-margin, AI-driven video processing chips, targeting niche applications like autonomous vehicles and security cameras. This analysis will determine which approach offers superior risk-adjusted returns for a diversified portfolio navigating evolving tech cycles.
Table of contents
Companies Overview
STMicroelectronics and Ambarella stand as pivotal players shaping the semiconductor landscape with distinct market footprints.
STMicroelectronics N.V.: Global Semiconductor Powerhouse
STMicroelectronics commands a broad presence in semiconductor manufacturing, generating revenue through diverse product groups like automotive ICs, analog, MEMS sensors, and microcontrollers. In 2026, it sharpens its focus on automotive and industrial applications, leveraging integrated circuits and power transistors to capture evolving market demands across multiple regions.
Ambarella, Inc.: Specialized Video Semiconductor Innovator
Ambarella specializes in semiconductor solutions for high-definition video processing with integrated AI and image processing on a single chip. Its 2026 strategy centers on automotive cameras and advanced driver assistance systems, expanding into security, robotics, and consumer markets through cutting-edge video compression and neural network technologies.
Strategic Collision: Similarities & Divergences
Both companies excel in semiconductors but diverge sharply in scope and strategy. STMicroelectronics embraces a diversified, multi-segment approach, while Ambarella pursues a focused innovation path in video-centric SoCs. Their primary battleground lies in automotive electronics, where integrated solutions meet specialized imaging needs. Investors face contrasting profiles: STMicroelectronics offers scale and breadth; Ambarella delivers niche tech leadership with higher beta risk.
Income Statement Comparison
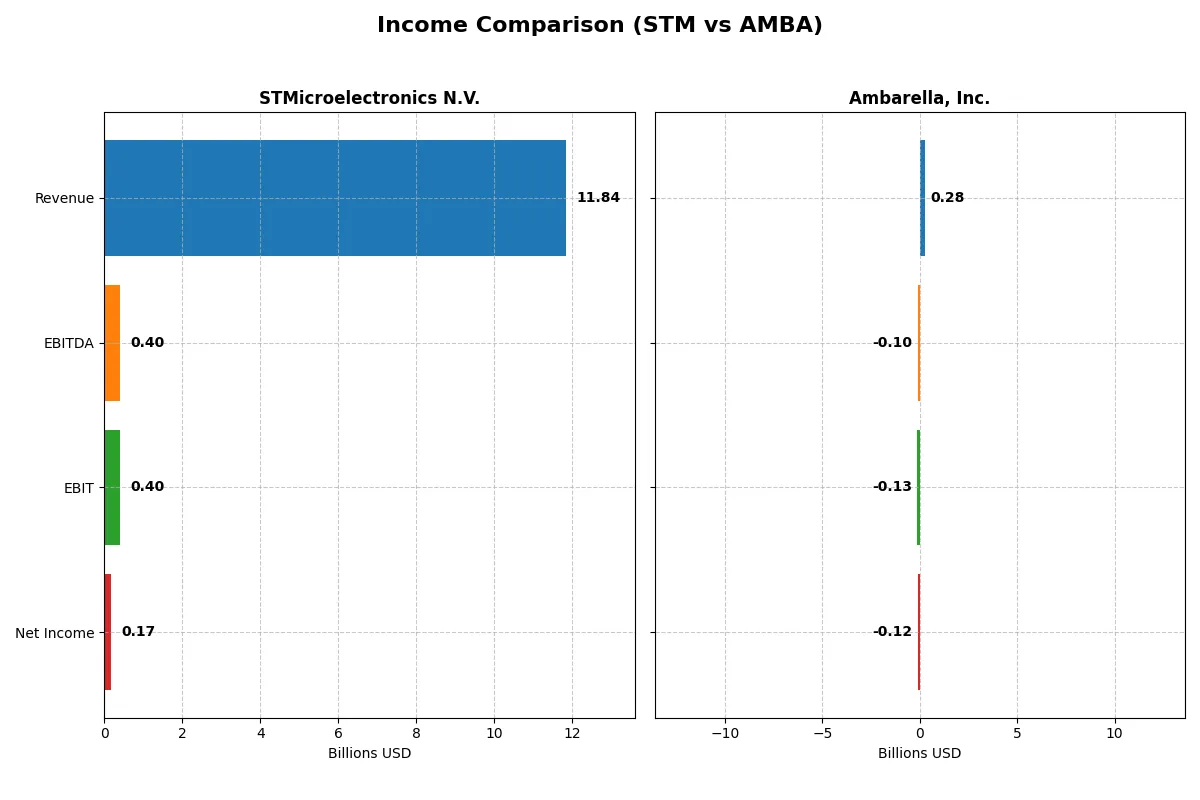
This data dissects the core profitability and scalability of both corporate engines to reveal who dominates the bottom line:
| Metric | STMicroelectronics N.V. (STM) | Ambarella, Inc. (AMBA) |
|---|---|---|
| Revenue | 11.8B | 285M |
| Cost of Revenue | 7.8B | 113M |
| Operating Expenses | 3.7B | 299M |
| Gross Profit | 4.0B | 172M |
| EBITDA | 401M | -101M |
| EBIT | 401M | -127M |
| Interest Expense | 0 | 0 |
| Net Income | 167M | -117M |
| EPS | 0.19 | -2.84 |
| Fiscal Year | 2025 | 2025 |
Income Statement Analysis: The Bottom-Line Duel
This income statement comparison reveals which company runs a more efficient and profitable corporate engine in the current economic climate.
STMicroelectronics N.V. Analysis
STMicroelectronics shows a declining revenue trend from 17.3B in 2023 to 11.8B in 2025, with net income tumbling from 4.2B to 167M. Gross margin remains solid at 33.9%, but net margin shrinks to 1.4%, signaling deteriorating profitability. The 2025 year highlights weak momentum, with EBIT and net income sharply down, reflecting margin compression and operational challenges.
Ambarella, Inc. Analysis
Ambarella posts modest revenue growth from 223M in 2021 to 285M in 2025, yet net losses persist, reaching -117M in 2025. It achieves a strong gross margin of 60.5%, but suffers from negative EBIT and net margins (-44.4% and -41.1%). Despite losses, recent revenue and margin improvements suggest operational momentum, but profitability remains elusive.
Margin Strength vs. Profit Scale
STMicroelectronics delivers far greater revenue and net income scale but faces significant margin erosion and profitability decline. Ambarella shows promising top-line growth and gross margin strength but remains unprofitable. For investors, STM’s scale and positive net income history offer stability, while AMBA’s profile suits those prioritizing growth potential over near-term profits.
Financial Ratios Comparison
These vital ratios act as a diagnostic tool to expose underlying fiscal health, valuation premiums, and capital efficiency:
| Ratios | STMicroelectronics N.V. (STM) | Ambarella, Inc. (AMBA) |
|---|---|---|
| ROE | 0.0093 | -0.2086 |
| ROIC | 0.0067 | -0.2196 |
| P/E | 14.43 | -27.05 |
| P/B | 1.29 | 5.64 |
| Current Ratio | 3.11 | 2.65 |
| Quick Ratio | 2.37 | 2.36 |
| D/E | 0.18 | 0.009 |
| Debt-to-Assets | 0.13 | 0.008 |
| Interest Coverage | 19.72 | 0 |
| Asset Turnover | 0.54 | 0.41 |
| Fixed Asset Turnover | 1.22 | 19.96 |
| Payout Ratio | 0.18 | 0 |
| Dividend Yield | 1.28% | 0 |
| Fiscal Year | 2024 | 2025 |
Efficiency & Valuation Duel: The Vital Signs
Financial ratios serve as a company’s DNA, unveiling hidden risks and operational efficiency beyond surface-level data.
STMicroelectronics N.V.
STMicroelectronics shows weak profitability with a 0.93% ROE and 1.41% net margin, signaling operational challenges. Its valuation metrics, including P/E and P/B, appear favorable, suggesting the stock is reasonably priced. The company retains earnings to fund substantial R&D, investing 15.7% of revenue into innovation instead of paying dividends.
Ambarella, Inc.
Ambarella suffers from significant losses, with a negative 20.86% ROE and a -41.12% net margin, reflecting deep profitability issues. Despite a favorable P/E due to negative earnings, the P/B ratio is high at 5.64, indicating stretched valuation. The firm reinvests heavily in R&D, allocating nearly 79.4% of revenue, foregoing dividends to support growth.
Profitability Stability vs. Growth Ambition
STMicroelectronics offers a more stable profitability profile and reasonable valuation, balancing risks better than Ambarella’s stretched valuation amid losses. Investors seeking operational safety may prefer STMicroelectronics, while those targeting aggressive growth might consider Ambarella’s high R&D commitment despite weak returns.
Which one offers the Superior Shareholder Reward?
I observe that STMicroelectronics (STM) pays a modest dividend yield of 1.28% with a payout ratio around 18%, backed by strong operating cash flow coverage. STM’s buyback programs are moderate but consistent, enhancing shareholder return. Ambarella (AMBA) pays no dividend but aggressively reinvests free cash flow (0.57/share in 2025) into R&D and growth, supported by a solid cash ratio of 1.2 and minimal debt. However, AMBA suffers from persistent net losses and negative margins, raising sustainability concerns. STM’s balanced dividend and buyback approach offers a more reliable total return profile in 2026, making it the superior shareholder reward choice.
Comparative Score Analysis: The Strategic Profile
The radar chart reveals the fundamental DNA and trade-offs of STMicroelectronics and Ambarella, highlighting their financial strengths and weaknesses:

STMicroelectronics shows a balanced profile with moderate scores in DCF (3), ROE (2), ROA (3), and Debt/Equity (3). Ambarella leans heavily on a strong Debt/Equity score (4) but suffers from weak profitability scores—ROE (1) and ROA (1). Both firms face valuation challenges, scoring very low in P/E (1) and P/B (1 for STM, 2 for AMBA). STMicroelectronics offers a more consistent operating efficiency, while Ambarella depends more on conservative leverage management.
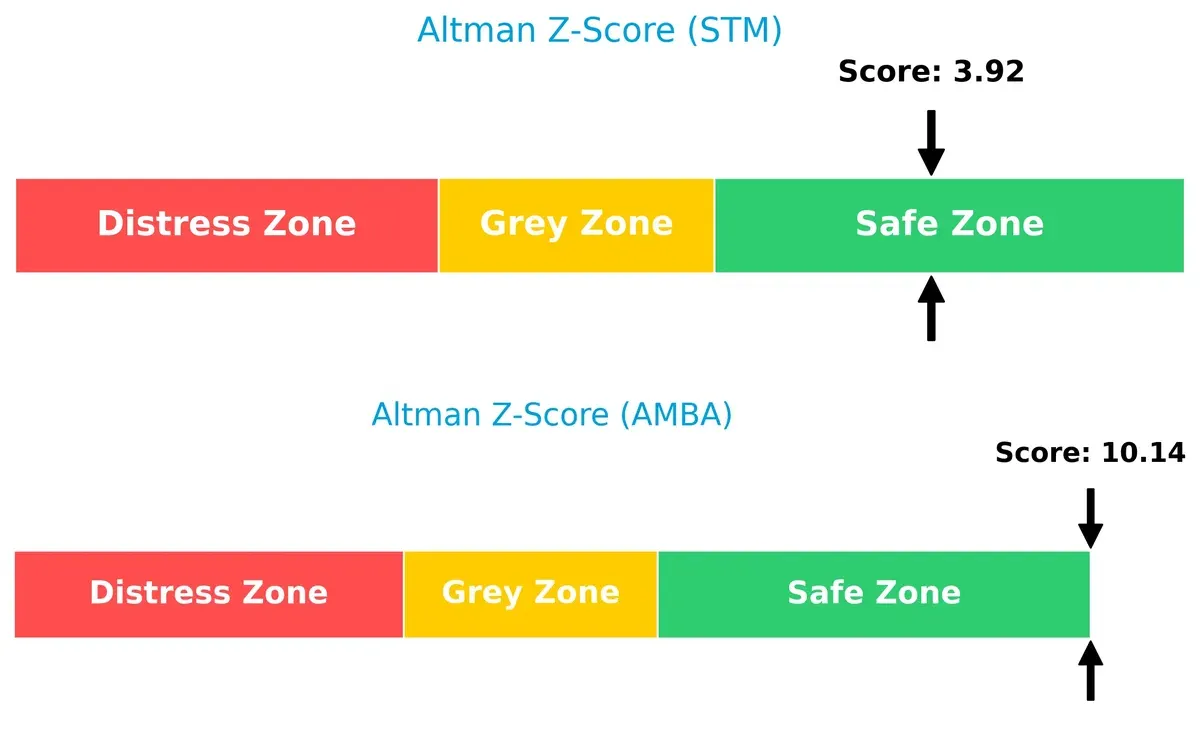
Bankruptcy Risk: Solvency Showdown
Ambarella’s Altman Z-Score at 10.14 outperforms STMicroelectronics’ 3.92, signaling superior financial safety for long-term survival in this volatile cycle:
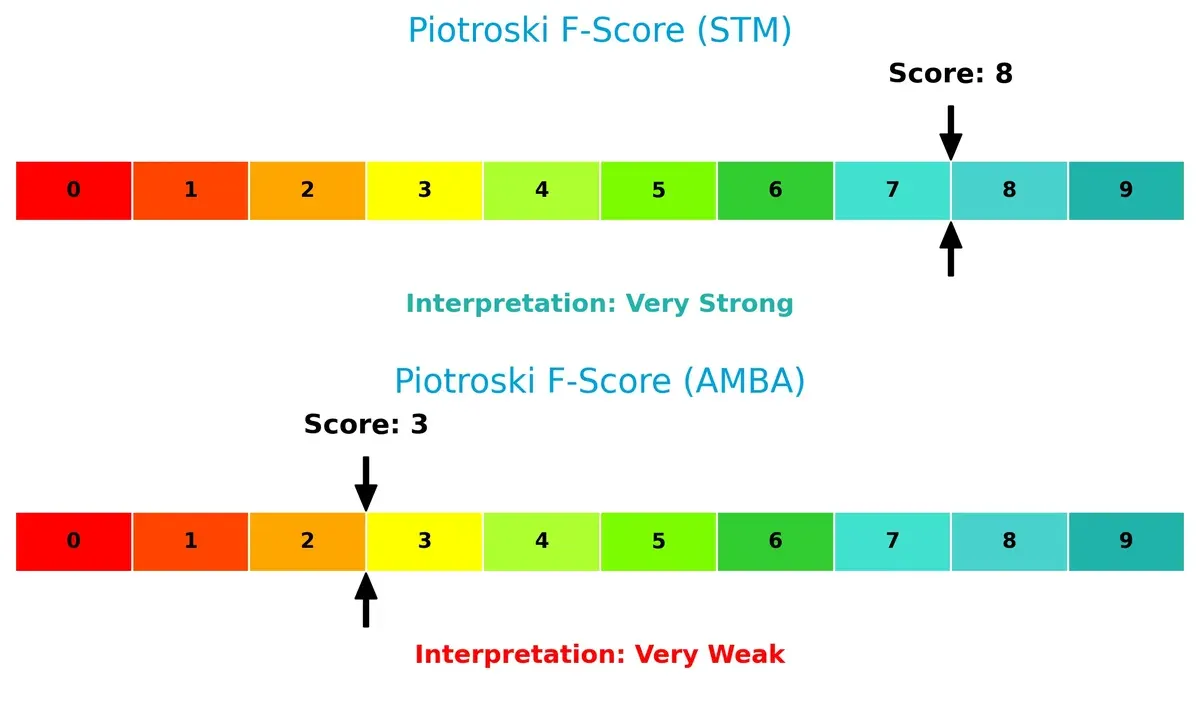
Financial Health: Quality of Operations
STMicroelectronics scores an 8 on the Piotroski scale, indicating very strong financial health, while Ambarella’s 3 reveals significant red flags in operations and internal metrics:
How are the two companies positioned?
This section dissects STM and AMBA’s operational DNA by comparing their revenue distribution and internal dynamics. The goal is to confront their economic moats and identify which model offers the most resilient competitive advantage today.
Revenue Segmentation: The Strategic Mix
This visual comparison dissects how STMicroelectronics N.V. and Ambarella, Inc. diversify their income streams and where their primary sector bets lie:
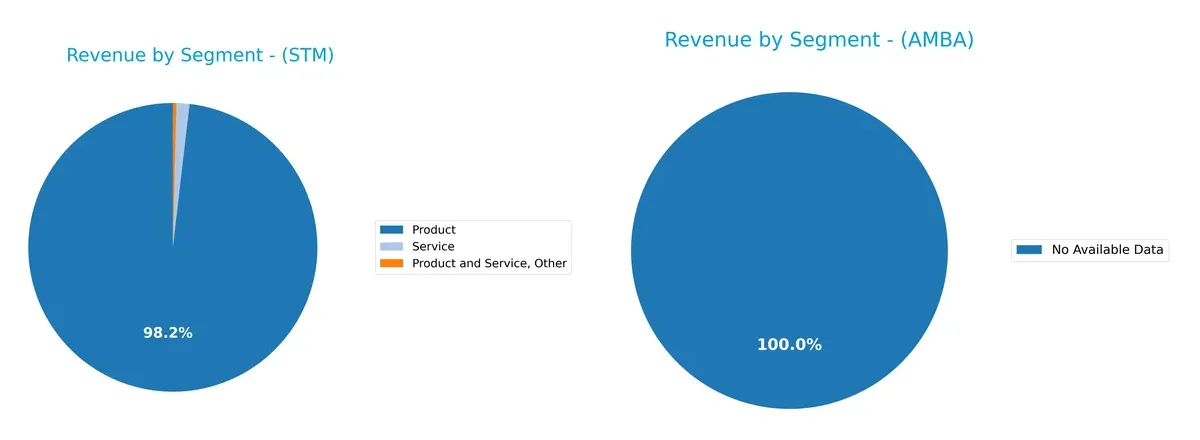
STMicroelectronics dominates with a highly concentrated revenue stream anchored in its $13.2B Product segment for 2024, dwarfing modest Service and Other revenues. Ambarella lacks available data, precluding direct comparison. STM’s reliance on products signals strong infrastructure dominance but exposes concentration risk. Its limited service revenue contrasts with typical diversified tech firms, suggesting a strategic focus on hardware leadership rather than ecosystem lock-in.
Strengths and Weaknesses Comparison
This table compares the Strengths and Weaknesses of STMicroelectronics and Ambarella based on diversification, profitability, financials, innovation, global presence, and market share:
STM Strengths
- Diversified product portfolio with $13.2B in product revenue
- Strong global presence across Asia Pacific, EMEA, and Americas
- Favorable debt metrics and interest coverage
- Reasonable liquidity with quick ratio 2.43
AMBA Strengths
- Favorable current and quick ratios indicate liquidity strength
- Extremely low debt level with debt-to-assets at 0.76%
- High fixed asset turnover at 19.96 signals efficient asset use
- Presence across Asia Pacific, Europe, and North America
STM Weaknesses
- Low profitability: ROE 0.93%, ROIC 0.67%, net margin 1.41%
- Unfavorable current ratio of 3.36 may indicate inefficient asset management
- Asset turnover at 0.48 below ideal
- No dividend yield
AMBA Weaknesses
- Negative profitability with ROE -20.86%, ROIC -21.96%, net margin -41.12%
- Unfavorable WACC at 12.99% and interest coverage at 0
- Poor market valuation metrics: PB 5.64 and negative PE
- No dividend yield and weaker global revenue scale
STM demonstrates breadth in product offerings and global reach, coupled with solid financial structure but struggles with profitability and asset efficiency. AMBA shows liquidity and asset efficiency strengths but faces significant profitability and valuation challenges. These contrasts suggest divergent strategic priorities around growth and financial health.
The Moat Duel: Analyzing Competitive Defensibility
Only a durable structural moat protects long-term profits from relentless competition and market pressure. Here’s how these two semiconductor firms defend their turf:
STMicroelectronics N.V.: Diversified Product Moat
STM’s moat stems from broad product diversification across automotive, industrial, and consumer segments. Its financials show stable gross margins but deteriorating returns on capital. In 2026, expansion into analog and MEMS sensors could deepen its moat, though margin pressure looms.
Ambarella, Inc.: Specialized AI Video Processing Moat
Ambarella relies on specialized AI and computer vision chips, creating a niche moat unlike STM’s broad base. Despite strong revenue growth, negative EBIT and net margins signal operational challenges. New autonomous vehicle and security camera markets offer growth but require margin recovery.
Moat Breadth vs. Niche Specialization: Who Holds the Fort?
STM’s wide-ranging product ecosystem contrasts with Ambarella’s focused AI video moat. Both suffer declining ROICs, signaling value erosion. Yet, STM’s scale and diversified markets suggest a wider moat better suited to defend market share in volatile cycles.
Which stock offers better returns?
The past year shows contrasting stock movements: STMicroelectronics N.V. faced a steep 40.6% decline with accelerating losses, while Ambarella, Inc. gained 14.1% but recently experienced a sharp downturn.
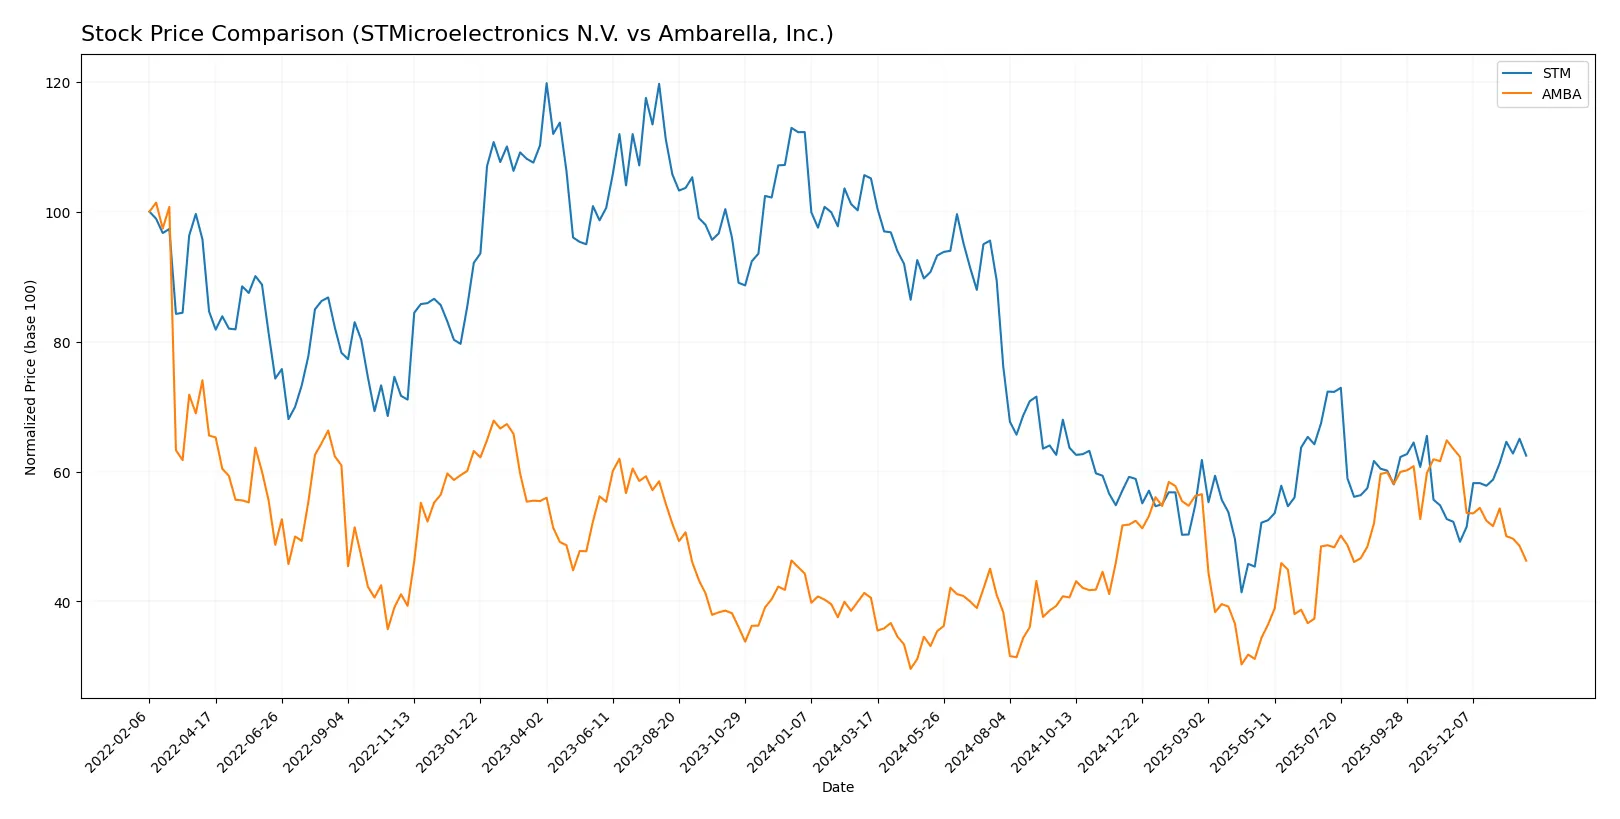
Trend Comparison
STMicroelectronics’ stock dropped 40.6% over 12 months, marking a bearish trend with accelerating decline and a high volatility of 6.77%. Prices ranged between 18.49 and 46.95.
Ambarella’s stock rose 14.1% over the same period, reflecting a bullish trend with deceleration. Volatility was higher at 12.79%, with prices fluctuating between 40.99 and 89.67.
Ambarella delivered the highest market performance with a positive 14.1% return versus STM’s 40.6% loss over the past year.
Target Prices
Analysts present a bullish consensus with notable upside potential for both STMicroelectronics N.V. and Ambarella, Inc.
| Company | Target Low | Target High | Consensus |
|---|---|---|---|
| STMicroelectronics N.V. | 28 | 45 | 37.67 |
| Ambarella, Inc. | 80 | 115 | 97.5 |
The consensus targets exceed current prices significantly, implying 35%+ upside for STM and over 50% potential for AMBA, signaling strong analyst conviction in semiconductor growth.

Don’t Let Luck Decide Your Entry Point
Optimize your entry points with our advanced ProRealTime indicators. You’ll get efficient buy signals with precise price targets for maximum performance. Start outperforming now!
How do institutions grade them?
The following tables summarize recent institutional grades for STMicroelectronics N.V. and Ambarella, Inc.:
STMicroelectronics N.V. Grades
This table shows the latest grades and rating actions from reputable firms for STMicroelectronics:
| Grading Company | Action | New Grade | Date |
|---|---|---|---|
| TD Cowen | Maintain | Buy | 2025-10-24 |
| Susquehanna | Maintain | Positive | 2025-10-22 |
| Susquehanna | Maintain | Positive | 2025-07-25 |
| Susquehanna | Maintain | Positive | 2025-07-22 |
| Baird | Upgrade | Outperform | 2025-07-22 |
| Jefferies | Upgrade | Buy | 2025-02-19 |
| Bernstein | Downgrade | Market Perform | 2025-02-05 |
| Susquehanna | Maintain | Positive | 2025-01-31 |
| Barclays | Downgrade | Underweight | 2025-01-22 |
| JP Morgan | Downgrade | Neutral | 2024-12-09 |
Ambarella, Inc. Grades
Below is the summary of recent ratings and actions from established grading firms for Ambarella:
| Grading Company | Action | New Grade | Date |
|---|---|---|---|
| Stifel | Maintain | Buy | 2025-11-26 |
| Needham | Maintain | Buy | 2025-11-26 |
| B of A Securities | Maintain | Neutral | 2025-11-26 |
| Rosenblatt | Maintain | Buy | 2025-11-26 |
| Rosenblatt | Maintain | Buy | 2025-11-24 |
| Oppenheimer | Maintain | Perform | 2025-08-29 |
| B of A Securities | Maintain | Neutral | 2025-08-29 |
| Needham | Maintain | Buy | 2025-08-29 |
| Rosenblatt | Maintain | Buy | 2025-08-29 |
| Morgan Stanley | Maintain | Overweight | 2025-08-29 |
Which company has the best grades?
Ambarella consistently receives Buy ratings from multiple firms, reflecting steady investor confidence. STMicroelectronics shows a mix of upgrades and downgrades, indicating more varied institutional sentiment. Investors may see Ambarella’s more uniform positive grades as a stability signal.
Risks specific to each company
The following categories identify the critical pressure points and systemic threats facing both firms in the 2026 market environment:
1. Market & Competition
STMicroelectronics N.V.
- Large market cap (24.8B) supports scale and R&D. Faces intense competition in diversified semiconductor segments.
Ambarella, Inc.
- Smaller market cap (2.76B) limits scale. Highly specialized in video processing chips amid aggressive innovation race.
2. Capital Structure & Debt
STMicroelectronics N.V.
- Conservative leverage (D/E 0.12), strong interest coverage. Capital structure reduces financial risk.
Ambarella, Inc.
- Very low debt (D/E 0.01), but weak interest coverage signals operational stress and possible liquidity concerns.
3. Stock Volatility
STMicroelectronics N.V.
- Beta 1.29 indicates moderate volatility, typical for large-cap semiconductors.
Ambarella, Inc.
- High beta 1.95 signals elevated risk and sensitivity to market swings, increasing investor caution.
4. Regulatory & Legal
STMicroelectronics N.V.
- Operates globally with exposure to EU and US regulations; automotive focus adds compliance complexity.
Ambarella, Inc.
- US-based with heavy reliance on automotive markets, faces evolving AI and privacy regulations impacting product design.
5. Supply Chain & Operations
STMicroelectronics N.V.
- Large, diversified operations mitigate supply risks. Global footprint helps manage disruptions but adds complexity.
Ambarella, Inc.
- Smaller scale heightens supply chain vulnerability, especially for specialized components in a volatile semiconductor market.
6. ESG & Climate Transition
STMicroelectronics N.V.
- Established ESG initiatives expected from large European firm. Transition risks managed but require ongoing capital.
Ambarella, Inc.
- ESG programs less mature; dependence on emerging tech sectors may increase transitional risks amid tightening regulations.
7. Geopolitical Exposure
STMicroelectronics N.V.
- Global presence including Asia-Pacific exposes it to US-China tensions and EU trade policies.
Ambarella, Inc.
- Primarily US-focused but with international customers; sensitive to US export controls and global chip supply chain dynamics.
Which company shows a better risk-adjusted profile?
STMicroelectronics faces moderate market and operational risks but maintains strong financial stability and a safer capital structure. Ambarella’s higher volatility, negative profitability, and weaker operational scores heighten its risk profile despite low debt. STMicroelectronics offers a better risk-adjusted profile in 2026. Ambarella’s most impactful risk is its negative returns and operational weakness. STMicroelectronics’ main concern lies in competitive pressure and regulatory complexity. The stark contrast in profitability metrics and capital structure underpins my caution with Ambarella’s stock volatility and financial health.
Final Verdict: Which stock to choose?
STMicroelectronics (STM) boasts a robust cash position and a strong balance sheet that underpins its resilience. Its superpower lies in stable operational cash flow and prudent capital management. However, deteriorating profitability and declining ROIC warrant vigilance. STM suits investors focused on steady value preservation with moderate growth ambitions.
Ambarella (AMBA) leverages an impressive strategic moat in high-margin, specialized video processing technology, driving superior gross margins and revenue growth. Compared to STM, AMBA presents higher volatility and risk, reflecting its ongoing profitability challenges. This stock appeals to growth-at-a-reasonable-price (GARP) investors willing to weather uneven earnings for future upside.
If you prioritize financial stability and a safer capital base, STM offers better stability despite recent profit pressures. However, if you seek aggressive growth with a promising technological moat, AMBA commands attention for its revenue momentum but with notable execution risks. Each stock fits distinct investor profiles navigating the semiconductor landscape.
Disclaimer: Investment carries a risk of loss of initial capital. The past performance is not a reliable indicator of future results. Be sure to understand risks before making an investment decision.
Go Further
I encourage you to read the complete analyses of STMicroelectronics N.V. and Ambarella, Inc. to enhance your investment decisions: