Home > Comparison > Technology > SWKS vs AMBA
The strategic rivalry between Skyworks Solutions, Inc. and Ambarella, Inc. shapes the semiconductor industry’s evolution. Skyworks operates as a broad-based semiconductor manufacturer with diverse applications across aerospace, automotive, and consumer electronics. Ambarella focuses on specialized system-on-a-chip solutions for video processing and AI-driven imaging. This analysis evaluates their contrasting operational models to identify which offers superior risk-adjusted returns for a diversified portfolio in the competitive tech landscape.

Table of contents
Companies Overview
Skyworks Solutions and Ambarella both play pivotal roles in the semiconductor landscape, shaping technology across diverse end markets.
Skyworks Solutions, Inc.: Semiconductor Powerhouse
Skyworks Solutions dominates as a designer and manufacturer of proprietary semiconductor products. It generates revenue by selling components like amplifiers, antenna tuners, and front-end modules for wireless and connected devices. In 2026, its strategic focus remains on expanding product applications across aerospace, automotive, and consumer electronics to capture broad industry demand.
Ambarella, Inc.: Video-Driven Semiconductor Innovator
Ambarella leads in semiconductor solutions for HD and ultra-HD video processing. Its core revenue stems from system-on-a-chip designs integrating video, AI, and audio processing for automotive, security, and consumer cameras. The company’s 2026 strategy emphasizes advancing AI-enabled computer vision technologies to enhance autonomous vehicle systems and smart security applications.
Strategic Collision: Similarities & Divergences
Skyworks pursues a broad component-based semiconductor model, while Ambarella specializes in integrated video processing chips. Both compete in automotive and connected device markets, but their core technologies diverge significantly. Skyworks offers scale and product breadth; Ambarella delivers niche AI-driven innovation. Their investment profiles reflect this contrast: one is a diversified semiconductor stalwart, the other a focused AI video pioneer.
Income Statement Comparison
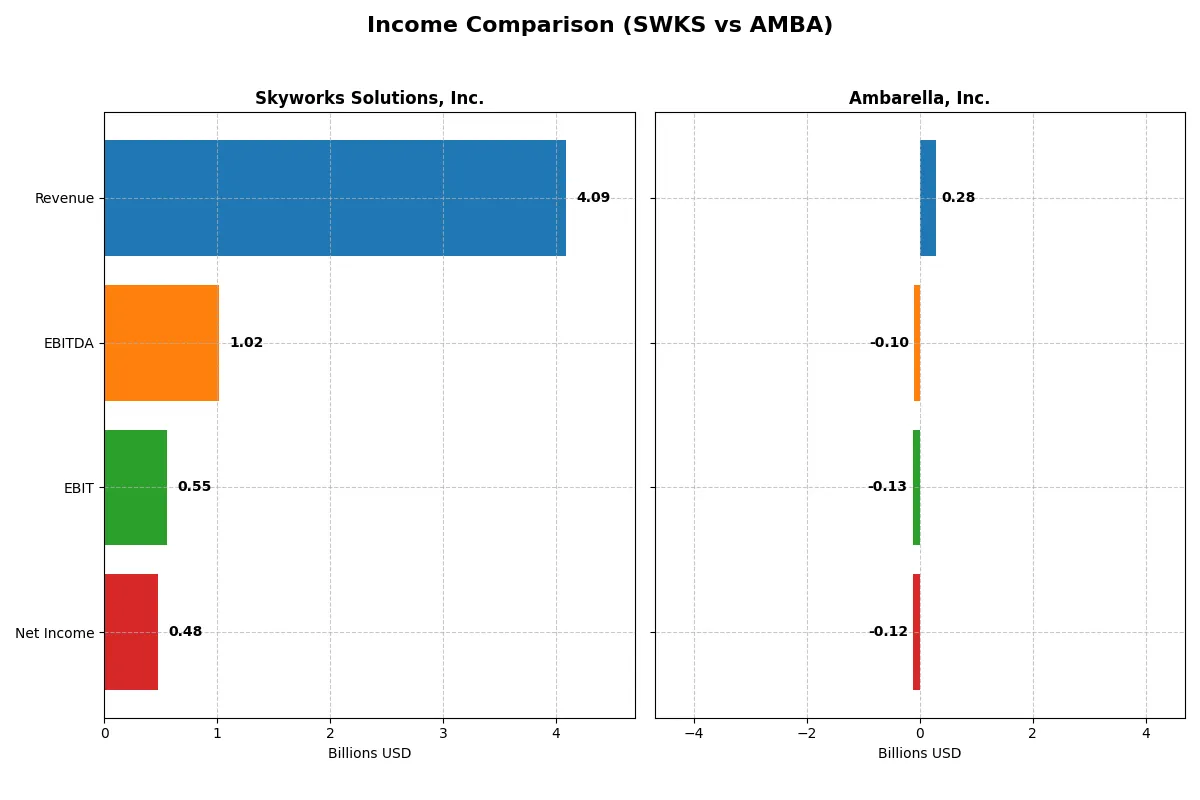
This data dissects the core profitability and scalability of both corporate engines to reveal who dominates the bottom line:
| Metric | Skyworks Solutions, Inc. (SWKS) | Ambarella, Inc. (AMBA) |
|---|---|---|
| Revenue | 4.09B | 285M |
| Cost of Revenue | 2.40B | 113M |
| Operating Expenses | 1.18B | 299M |
| Gross Profit | 1.68B | 172M |
| EBITDA | 1.02B | -101M |
| EBIT | 554M | -127M |
| Interest Expense | 27M | 0 |
| Net Income | 477M | -117M |
| EPS | 3.09 | -2.84 |
| Fiscal Year | 2025 | 2025 |
Income Statement Analysis: The Bottom-Line Duel
This income statement comparison reveals each company’s operational efficiency and profitability momentum over recent years.
Skyworks Solutions, Inc. Analysis
Skyworks’ revenue shrank from 5.1B in 2021 to 4.1B in 2025, with net income plunging from 1.5B to 477M. Gross margin holds steady near 41%, but net margin slid to 11.7%. The latest year shows weakened profitability and declining EPS, highlighting a challenging profit environment despite solid margin control.
Ambarella, Inc. Analysis
Ambarella’s revenue grew to 285M in 2025, up from 223M in 2021, driven by a 25.8% one-year surge. However, net income remains deeply negative at -117M, with a negative net margin around -41%. Despite improving top-line momentum and gross margin above 60%, losses persist, reflecting ongoing operational inefficiencies.
Margin Discipline vs. Growth Struggles
Skyworks maintains strong margin discipline but faces significant revenue and profit contraction, reflecting cyclical pressures in semiconductors. Ambarella shows promising revenue growth and expanding gross margins but struggles to convert this into profitability. For investors, Skyworks offers a stable margin profile amid decline, while Ambarella’s high-growth yet unprofitable model entails higher risk.
Financial Ratios Comparison
These vital ratios act as a diagnostic tool to expose the underlying fiscal health, valuation premiums, and capital efficiency of the companies compared below:
| Ratios | Skyworks Solutions, Inc. (SWKS) | Ambarella, Inc. (AMBA) |
|---|---|---|
| ROE | 8.29% (2025) | -20.86% (2025) |
| ROIC | 6.35% (2025) | -21.96% (2025) |
| P/E | 24.95 (2025) | -27.05 (2025) |
| P/B | 2.07 (2025) | 5.64 (2025) |
| Current Ratio | 2.33 (2025) | 2.65 (2025) |
| Quick Ratio | 1.76 (2025) | 2.36 (2025) |
| D/E | 0.21 (2025) | 0.01 (2025) |
| Debt-to-Assets | 15.20% (2025) | 0.76% (2025) |
| Interest Coverage | 18.45 (2025) | 0 (2025) |
| Asset Turnover | 0.52 (2025) | 0.41 (2025) |
| Fixed Asset Turnover | 2.95 (2025) | 19.96 (2025) |
| Payout ratio | 90.67% (2025) | 0% (2025) |
| Dividend yield | 3.63% (2025) | 0% (2025) |
| Fiscal Year | 2025 | 2025 |
Efficiency & Valuation Duel: The Vital Signs
Financial ratios serve as a company’s DNA, exposing hidden risks and operational strengths crucial for investment insight.
Skyworks Solutions, Inc.
Skyworks posts a favorable net margin of 11.67% but an unfavorable ROE of 8.29%, signaling moderate profitability. Its P/E of 24.95 and P/B of 2.07 reflect a fairly valued stock. A 3.63% dividend yield demonstrates consistent shareholder returns and disciplined capital allocation.
Ambarella, Inc.
Ambarella faces severe headwinds with a -41.12% net margin and -20.86% ROE, indicating deep losses. Despite a negative P/E at -27.05, its high P/B of 5.64 suggests valuation is stretched. The absence of dividends points to reinvestment heavily weighted in R&D, aiming for a turnaround.
Balanced Profitability vs. Turnaround Risk
Skyworks offers a more balanced risk-reward profile with stable profitability and steady dividends. Ambarella’s metrics signal high risk, relying on growth investments amid losses. Conservative investors may prefer Skyworks, while risk-tolerant investors might consider Ambarella’s recovery potential.
Which one offers the Superior Shareholder Reward?
I observe Skyworks Solutions, Inc. (SWKS) delivers steady dividends with a 3.63% yield and a payout ratio near 91%, supported by strong free cash flow coverage (2.07x). Its buyback program complements shareholder returns, indicating disciplined capital allocation. Ambarella, Inc. (AMBA) pays no dividends and shows negative profits, relying on reinvestment in R&D and growth. Its buyback activity is minimal, reflecting its early-stage growth profile. Historically in semiconductors, stable dividends plus buybacks, as seen in SWKS, offer more reliable long-term rewards than high-risk reinvestment alone. I conclude SWKS provides a superior total return profile for 2026 investors.
Comparative Score Analysis: The Strategic Profile
The radar chart reveals the fundamental DNA and strategic trade-offs of Skyworks Solutions, Inc. and Ambarella, Inc., highlighting their financial strengths and weaknesses:
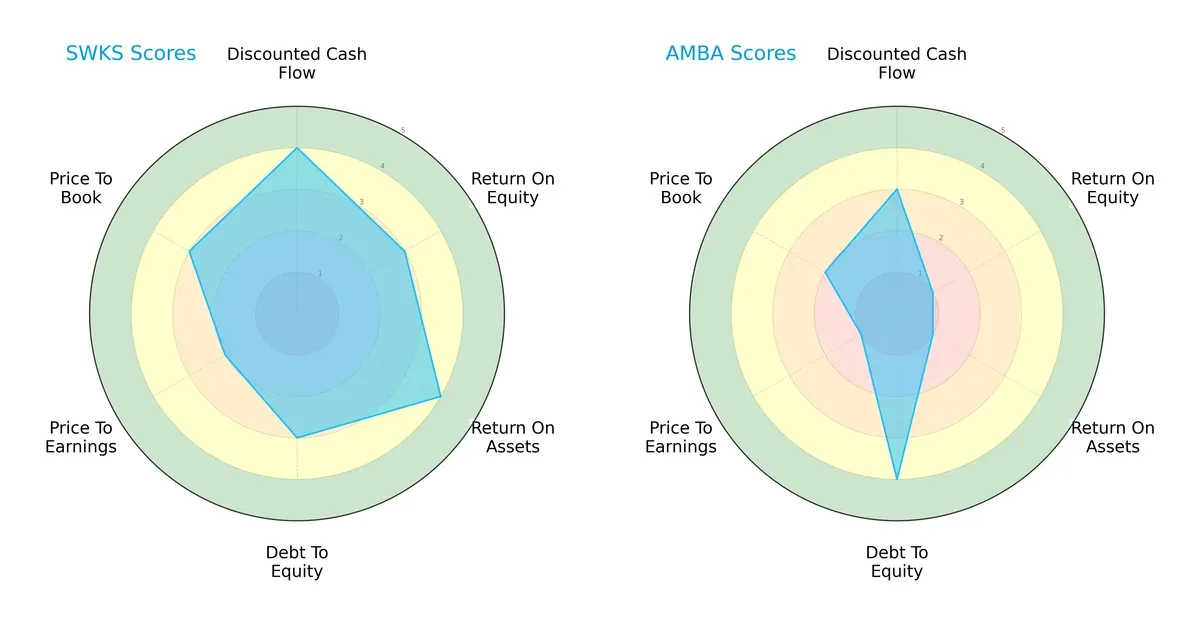
Skyworks boasts a more balanced profile with strong DCF (4), ROA (4), and moderate ROE (3) scores, reflecting efficient asset use and profitability. Ambarella leans heavily on low debt (4) but suffers very unfavorable ROE (1) and ROA (1), indicating operational challenges. Skyworks’ valuation scores (PE 2, PB 3) suggest moderate market pricing, while Ambarella’s low valuation scores hint at undervaluation but also potential risks. I see Skyworks as the more stable, well-rounded firm, whereas Ambarella relies mainly on financial conservatism to offset weaker profitability.
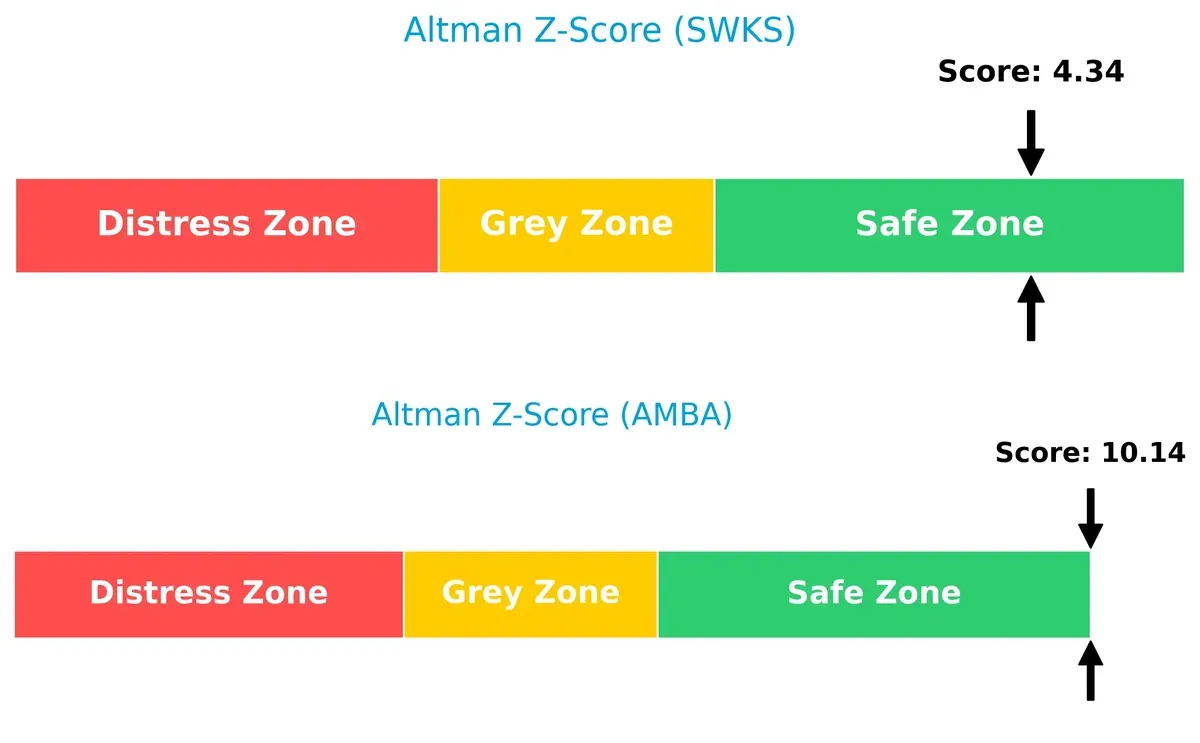
Bankruptcy Risk: Solvency Showdown
Skyworks’ Altman Z-Score of 4.34 versus Ambarella’s 10.14 signals both firms are in the safe zone. However, Ambarella’s exceptionally high Z-Score suggests a significantly stronger buffer against bankruptcy in this cycle:
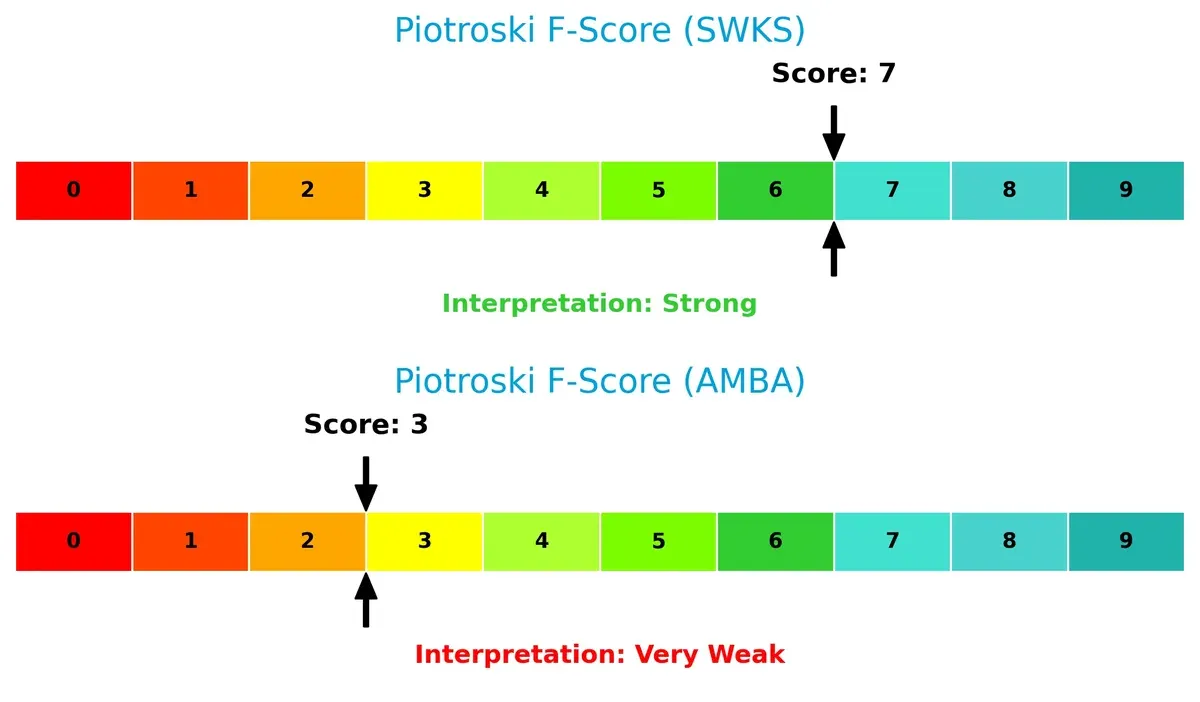
Financial Health: Quality of Operations
Skyworks’ Piotroski F-Score of 7 denotes strong financial health and operational quality. Ambarella’s score of 3 flags red alerts, indicating weaker internal metrics and potential distress compared to its peer:
How are the two companies positioned?
This section dissects the operational DNA of Skyworks Solutions and Ambarella by comparing their revenue distribution and internal dynamics. The goal is to confront their economic moats and identify which model offers the most resilient competitive advantage today.
Strengths and Weaknesses Comparison
This table compares the strengths and weaknesses of Skyworks Solutions, Inc. and Ambarella, Inc.:
Skyworks Solutions Strengths
- Favorable net margin at 11.67%
- Strong liquidity with current ratio 2.33 and quick ratio 1.76
- Low debt-to-assets at 15.2%
- Consistent dividend yield of 3.63%
- Significant US revenue base above 3B
- Balanced global presence in US, China, EMEA, Korea, Taiwan
Ambarella Strengths
- Favorable current ratio 2.65 and quick ratio 2.36
- Minimal debt with debt-to-assets at 0.76%
- High fixed asset turnover at 19.96
- Presence in Taiwan with over 179M revenue
- Positive P/E ratio status despite negative earnings
Skyworks Solutions Weaknesses
- Unfavorable return on equity at 8.29% below cost of capital
- Neutral ROIC versus WACC with ROIC 6.35% below WACC 9.25%
- Moderate asset turnover at 0.52
- Limited innovation metrics provided
- No product segmentation disclosed
Ambarella Weaknesses
- Negative net margin at -41.12%
- Negative ROE at -20.86% and ROIC at -21.96%
- Unfavorable WACC at 12.97%
- Zero interest coverage ratio signals risk
- No dividend yield
- Concentrated revenue mainly in Taiwan and limited US presence
Skyworks displays solid financial health and diversified global revenue but faces challenges in capital efficiency. Ambarella struggles with profitability and coverage ratios, relying heavily on Taiwan revenues. These contrasts highlight differing financial resilience and market positioning.
The Moat Duel: Analyzing Competitive Defensibility
A structural moat protects long-term profits from competitive erosion. Without it, companies risk margin decay and market share loss:
Skyworks Solutions, Inc.: Intangible Assets & Market Reach
Skyworks leverages proprietary semiconductor designs and broad market penetration. Despite favorable margins, its declining ROIC signals a weakening moat heading into 2026.
Ambarella, Inc.: Specialized Technology & Growth Potential
Ambarella’s moat stems from AI-powered video processing chips. It shows strong revenue growth but suffers from negative margins and shrinking ROIC, threatening its competitive edge.
Moat Sustainability: Intangible Assets vs. Specialized Innovation
Both firms destroy value with declining ROIC, but Skyworks’ wider market footprint and stable margins suggest a deeper moat. Skyworks is better positioned to defend market share in 2026.
Which stock offers better returns?
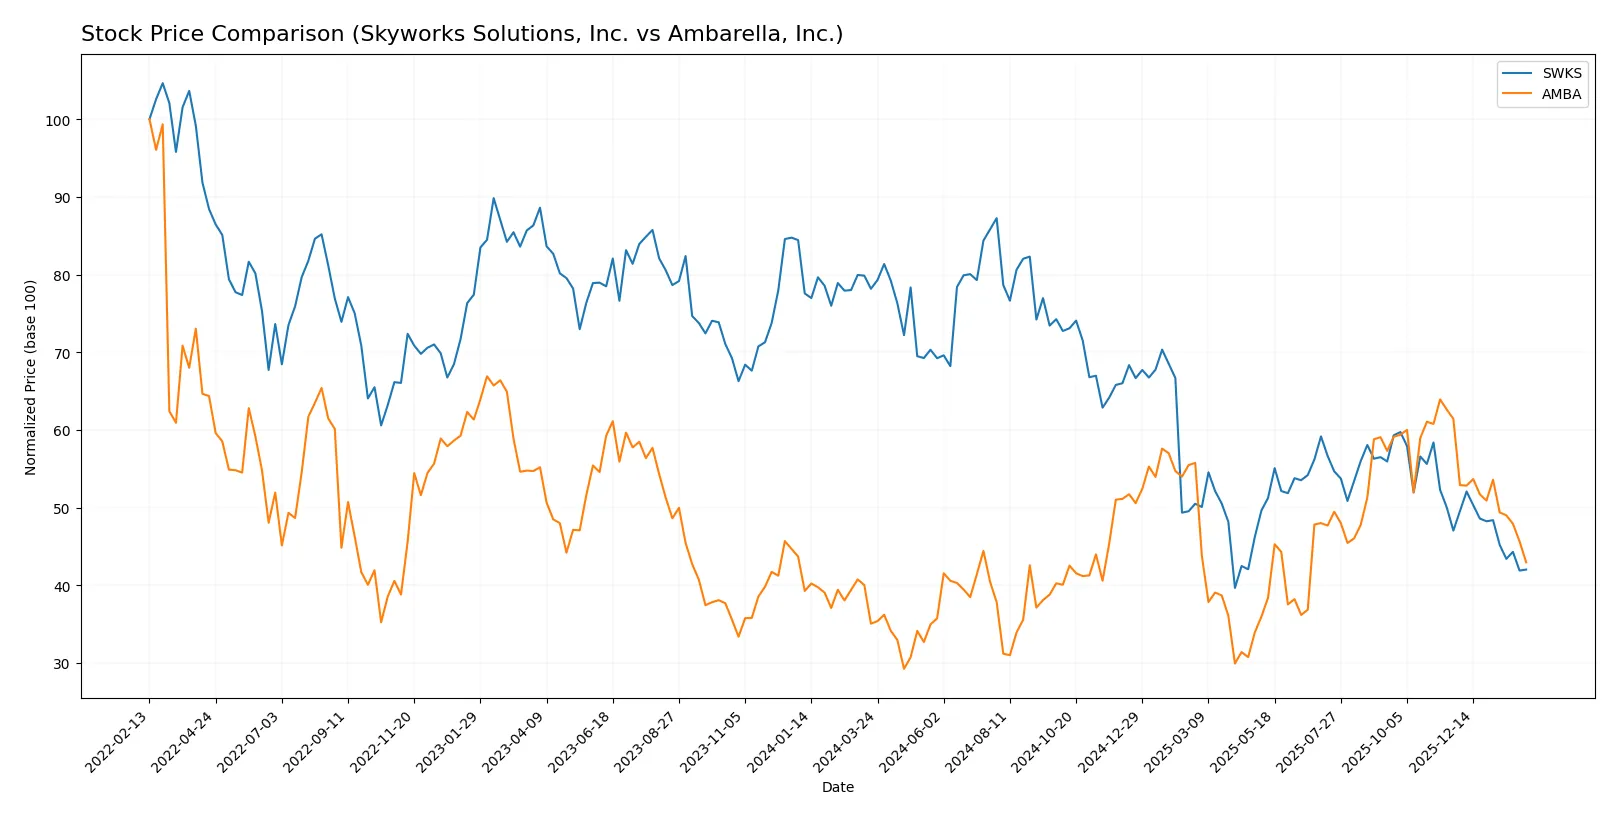
Skyworks Solutions, Inc. and Ambarella, Inc. exhibit contrasting price movements and trading dynamics over the past year, reflecting divergent investor sentiment and market performance.
Trend Comparison
Skyworks Solutions, Inc. shows a bearish trend with a -46.26% price decline over the last 12 months. The decline decelerates despite high volatility (16.54 std deviation), with a peak at 116.18 and a trough at 52.78.
Ambarella, Inc. posts a bullish trend with a 22.54% gain over the same period. The uptrend slows down while volatility remains elevated (12.78 std deviation). The stock reached a high of 89.67 and a low of 40.99.
Comparing both stocks, Ambarella outperforms Skyworks in market returns over the past year, delivering positive growth against Skyworks’ significant losses.
Target Prices
Analysts present a broad but constructive target price consensus for both Skyworks Solutions and Ambarella.
| Company | Target Low | Target High | Consensus |
|---|---|---|---|
| Skyworks Solutions, Inc. | 60 | 140 | 78.8 |
| Ambarella, Inc. | 80 | 115 | 97.5 |
Skyworks’ consensus target stands 41% above its current 56 price, indicating potential undervaluation. Ambarella’s consensus target nearly doubles its current 60 price, signaling strong analyst confidence despite recent volatility.
How do institutions grade them?
Skyworks Solutions, Inc. Grades
The table below summarizes recent institutional grades for Skyworks Solutions, Inc.:
| Grading Company | Action | New Grade | Date |
|---|---|---|---|
| Morgan Stanley | Maintain | Equal Weight | 2026-02-02 |
| Mizuho | Maintain | Neutral | 2026-01-26 |
| B. Riley Securities | Maintain | Neutral | 2026-01-26 |
| Susquehanna | Maintain | Neutral | 2026-01-22 |
| UBS | Maintain | Neutral | 2026-01-20 |
Ambarella, Inc. Grades
The table below summarizes recent institutional grades for Ambarella, Inc.:
| Grading Company | Action | New Grade | Date |
|---|---|---|---|
| B of A Securities | Maintain | Neutral | 2025-11-26 |
| Rosenblatt | Maintain | Buy | 2025-11-26 |
| Stifel | Maintain | Buy | 2025-11-26 |
| Needham | Maintain | Buy | 2025-11-26 |
| Northland Capital | Maintain | Outperform | 2025-08-29 |
| Morgan Stanley | Maintain | Overweight | 2025-08-29 |
| Oppenheimer | Maintain | Perform | 2025-08-29 |
Which company has the best grades?
Ambarella, Inc. consistently receives Buy and Outperform ratings, indicating stronger institutional confidence. Skyworks Solutions holds mostly Neutral or Equal Weight grades. Investors may view Ambarella as having more upside potential.

Don’t Let Luck Decide Your Entry Point
Optimize your entry points with our advanced ProRealTime indicators. You’ll get efficient buy signals with precise price targets for maximum performance. Start outperforming now!
Risks specific to each company
The following categories identify critical pressure points and systemic threats facing Skyworks Solutions, Inc. and Ambarella, Inc. in the 2026 market environment:
1. Market & Competition
Skyworks Solutions, Inc.
- Operates in diversified semiconductor markets with established product portfolio, facing intense competition but with solid customer base.
Ambarella, Inc.
- Focuses on niche video semiconductor segment with AI capabilities, but faces fierce competition and market volatility in emerging tech.
2. Capital Structure & Debt
Skyworks Solutions, Inc.
- Maintains low debt-to-equity ratio (0.21) with strong interest coverage (20.44), reflecting conservative leverage and financial stability.
Ambarella, Inc.
- Extremely low leverage (debt-to-equity 0.01) but zero interest coverage due to losses, signaling risk in debt servicing if conditions worsen.
3. Stock Volatility
Skyworks Solutions, Inc.
- Beta of 1.32 indicates moderate volatility, aligned with semiconductor sector norms, providing relatively stable risk exposure.
Ambarella, Inc.
- Higher beta of 1.94 suggests elevated stock price swings, increasing risk for investors sensitive to market fluctuations.
4. Regulatory & Legal
Skyworks Solutions, Inc.
- Global operations expose it to complex international regulations but long-standing compliance frameworks mitigate major legal risks.
Ambarella, Inc.
- Focused on automotive and video AI markets, it faces evolving regulatory scrutiny on data privacy and autonomous vehicle standards.
5. Supply Chain & Operations
Skyworks Solutions, Inc.
- Large-scale manufacturing with diversified supply chain reduces disruption risk but remains vulnerable to semiconductor cycle downturns.
Ambarella, Inc.
- Smaller scale and reliance on specialized components heighten operational risk, especially amid global supply chain uncertainties.
6. ESG & Climate Transition
Skyworks Solutions, Inc.
- Established ESG programs and moderate carbon footprint align with investor expectations, supporting long-term sustainability.
Ambarella, Inc.
- ESG initiatives less mature and limited disclosure may increase reputational risks as climate transition pressures intensify.
7. Geopolitical Exposure
Skyworks Solutions, Inc.
- Broad global footprint including China and Asia-Pacific subjects it to trade tensions and export restrictions impacting revenues.
Ambarella, Inc.
- Concentrated US-based operations reduce direct geopolitical risk but limit access to fast-growing international markets.
Which company shows a better risk-adjusted profile?
Skyworks Solutions faces manageable competition and operational risks with strong financial health and stable leverage. Ambarella struggles with profitability, high stock volatility, and weaker financial metrics. Skyworks’ diversified exposure and solid capital structure underpin a superior risk-adjusted profile in 2026. Ambarella’s most pressing risk is its negative profitability and poor interest coverage, while Skyworks must monitor geopolitical tensions. The recent 41% negative net margin at Ambarella sharply signals financial distress, underscoring its risk disadvantage.
Final Verdict: Which stock to choose?
Skyworks Solutions, Inc. (SWKS) shines as a cash-generating engine with solid balance sheet health and consistent dividend yield. Its main point of vigilance is the declining profitability trend, signaling caution in capital allocation. SWKS suits investors seeking steady income and moderate growth in a balanced portfolio.
Ambarella, Inc. (AMBA) offers a strategic moat rooted in cutting-edge R&D and high gross margins, reflecting innovation potential. Despite its current financial challenges and negative returns, it carries a defensive liquidity profile relative to SWKS. AMBA fits growth-at-a-reasonable-price (GARP) investors willing to tolerate volatility for future payoff.
If you prioritize capital preservation and stable cash flows, Skyworks outshines due to its stronger financial resilience and dividend track record. However, if you seek aggressive growth driven by innovation and can absorb near-term losses, Ambarella offers superior upside potential despite its riskier profile. Each presents a distinct analytical scenario aligned with different risk tolerances.
Disclaimer: Investment carries a risk of loss of initial capital. The past performance is not a reliable indicator of future results. Be sure to understand risks before making an investment decision.
Go Further
I encourage you to read the complete analyses of Skyworks Solutions, Inc. and Ambarella, Inc. to enhance your investment decisions: