Home > Comparison > Technology > SLAB vs AMBA
The strategic rivalry between Silicon Laboratories Inc. and Ambarella, Inc. shapes the semiconductor sector’s innovation landscape. Silicon Labs operates as a fabless semiconductor leader, focusing on analog-intensive mixed-signal solutions for IoT applications. Ambarella specializes in high-definition video processing chips, integrating AI and computer vision for automotive and security markets. This analysis compares their distinct growth trajectories to identify which offers superior risk-adjusted returns for a diversified technology portfolio.

Table of contents
Companies Overview
Silicon Laboratories Inc. and Ambarella, Inc. stand as influential players in the semiconductor sector, shaping technology’s future.
Silicon Laboratories Inc.: Leader in Analog-Intensive Mixed-Signal Solutions
Silicon Laboratories Inc. operates as a fabless semiconductor company specializing in analog-intensive mixed-signal products. Its revenue primarily stems from wireless microcontrollers and sensor products used in IoT applications like industrial automation and smart metering. In 2026, the company focuses strategically on expanding its footprint in connected home and commercial building automation markets.
Ambarella, Inc.: Innovator in Video Semiconductor Solutions
Ambarella, Inc. develops system-on-a-chip semiconductor solutions that integrate HD video and image processing with AI vision algorithms. Its core revenue arises from automotive cameras, security systems, and consumer electronics. The company’s 2026 strategy centers on advancing AI-driven video processing technologies to support autonomous vehicles and smart surveillance.
Strategic Collision: Similarities & Divergences
Both companies compete in semiconductors but diverge sharply in focus: Silicon Labs emphasizes analog IoT connectivity, while Ambarella leads in AI-powered video processing. Their primary battleground is embedded systems for industrial and automotive applications. Silicon Labs offers broad mixed-signal solutions, whereas Ambarella delivers specialized AI video chips, creating distinct risk and growth profiles for investors.
Income Statement Comparison
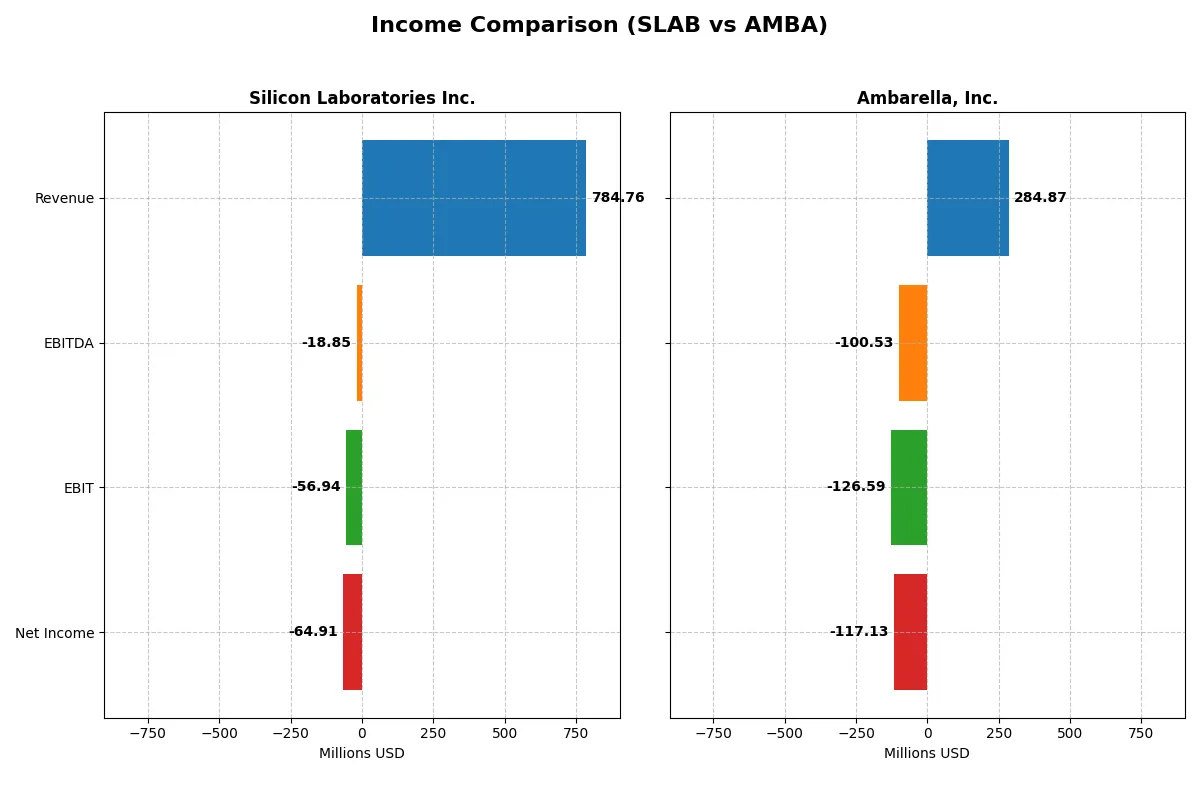
This data dissects the core profitability and scalability of both corporate engines to reveal who dominates the bottom line:
| Metric | Silicon Laboratories Inc. (SLAB) | Ambarella, Inc. (AMBA) |
|---|---|---|
| Revenue | 785M | 285M |
| Cost of Revenue | 328M | 113M |
| Operating Expenses | 528M | 299M |
| Gross Profit | 457M | 172M |
| EBITDA | -19M | -101M |
| EBIT | -57M | -127M |
| Interest Expense | 1M | 0 |
| Net Income | -65M | -117M |
| EPS | -1.98 | -2.84 |
| Fiscal Year | 2025 | 2025 |
Income Statement Analysis: The Bottom-Line Duel
This income statement comparison reveals which company runs a more efficient and sustainable profit engine amid recent market shifts.
Silicon Laboratories Inc. Analysis
Silicon Laboratories posts a mixed trajectory with revenues climbing from 720M in 2021 to 785M in 2025, but net income plunges from a 2.1B gain in 2021 to a 65M loss in 2025. Gross margins remain healthy near 58%, yet negative net margins around -8% highlight operational strain. Recent gains in revenue and gross profit signal improving momentum despite ongoing losses.
Ambarella, Inc. Analysis
Ambarella’s revenue increased steadily from 223M in 2021 to 285M in 2025, while net income remains negative, shrinking losses from -60M to -117M. The company maintains a strong gross margin above 60%, but suffers from steep net margins near -41%. Positive one-year growth rates across revenue and earnings suggest cautious operational progress.
Margin Resilience vs. Loss Reduction
Both companies sustain robust gross margins, yet Silicon Labs shows sharper improvement in profitability metrics year-over-year. Ambarella’s losses are more persistent and deeper relative to its scale. Silicon Labs’ profile offers stronger revenue growth and margin recovery, appealing to investors prioritizing operational turnaround over pure scale.
Financial Ratios Comparison
These vital ratios act as a diagnostic tool to expose the underlying fiscal health, valuation premiums, and capital efficiency of the companies compared below:
| Ratios | Silicon Laboratories Inc. (SLAB) | Ambarella, Inc. (AMBA) |
|---|---|---|
| ROE | -5.93% | -20.86% |
| ROIC | -6.27% | -21.96% |
| P/E | -65.9 | -27.1 |
| P/B | 3.91 | 5.64 |
| Current Ratio | 4.69 | 2.65 |
| Quick Ratio | 4.02 | 2.36 |
| D/E | 0 | 0.009 |
| Debt-to-Assets | 0 | 0.008 |
| Interest Coverage | -72.3 | 0 |
| Asset Turnover | 0.62 | 0.41 |
| Fixed Asset Turnover | 6.10 | 19.96 |
| Payout ratio | 0 | 0 |
| Dividend yield | 0 | 0 |
| Fiscal Year | 2025 | 2025 |
Efficiency & Valuation Duel: The Vital Signs
Financial ratios serve as a company’s DNA, unveiling hidden risks and operational strengths crucial for investment decisions.
Silicon Laboratories Inc.
Silicon Laboratories shows weak profitability with negative ROE and net margin, signaling operational challenges. Its valuation appears attractive with a favorable negative P/E, but a stretched P/B ratio of 3.91 raises questions. The company pays no dividends, instead investing heavily in R&D (45% of revenue), aiming for long-term growth despite current losses.
Ambarella, Inc.
Ambarella suffers from steep losses, reflected in a deeply negative ROE and net margin, indicating profitability struggles. Its P/E is also negative but less favorable than Silicon Labs. The company maintains a healthier current ratio and low debt, focusing on aggressive R&D (79% of revenue) over shareholder payouts, signaling a growth-oriented reinvestment strategy amid operational risks.
Growth Investment vs. Financial Stability Challenge
Both companies exhibit unfavorable profitability and high operational risks, with Ambarella investing more heavily in R&D and maintaining better liquidity. Silicon Labs offers a cheaper valuation but with stretched asset metrics. Investors seeking growth may lean toward Ambarella, while those prioritizing valuation might prefer Silicon Labs despite its financial headwinds.
Which one offers the Superior Shareholder Reward?
I observe that both Silicon Laboratories Inc. (SLAB) and Ambarella, Inc. (AMBA) do not pay dividends, signaling a reinvestment strategy rather than direct income distribution. SLAB’s free cash flow per share of 2.0 and robust buyback capacity contrast with AMBA’s smaller free cash flow per share of 0.57 but consistent buybacks. Historically, SLAB shows stronger liquidity and capital expenditure coverage, supporting sustainable buybacks. AMBA operates with higher price multiples, implying more growth expectations but also valuation risk. I conclude SLAB offers a more attractive total return profile in 2026 due to better cash flow generation and a sustainable buyback model, aligning with prudent capital allocation in this tech cycle.
Comparative Score Analysis: The Strategic Profile
The radar chart reveals the fundamental DNA and trade-offs of Silicon Laboratories Inc. and Ambarella, Inc., highlighting their contrasting financial strengths and vulnerabilities:
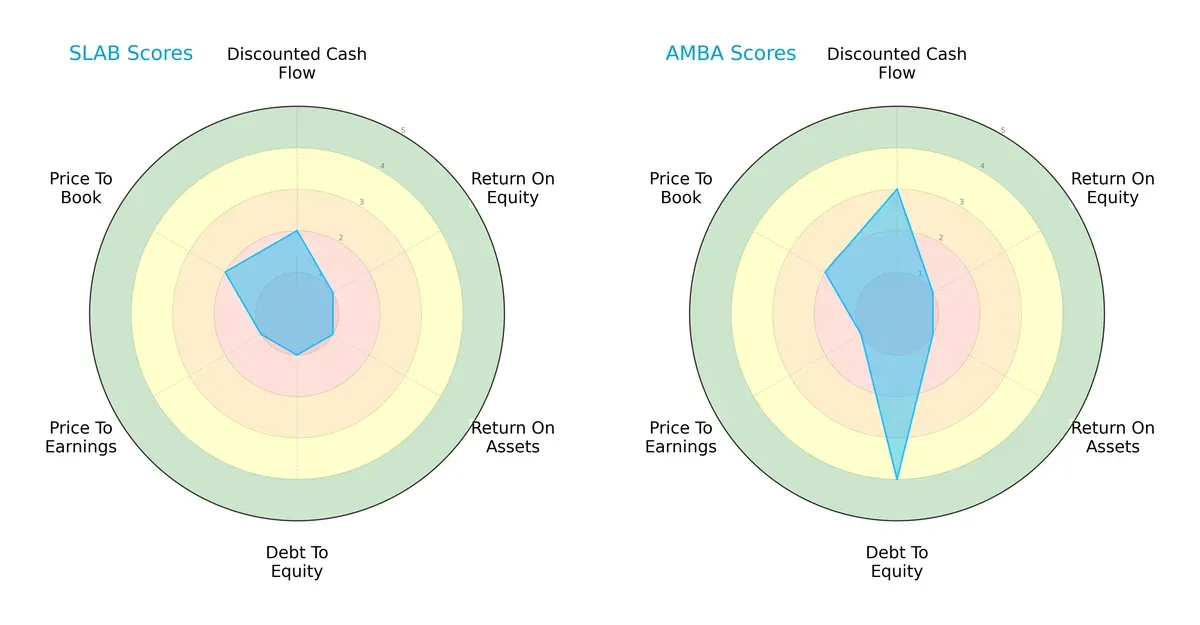
Silicon Laboratories shows a uniformly weak profile with very unfavorable scores in ROE, ROA, debt-to-equity, and P/E metrics, signaling operational and valuation challenges. Ambarella leverages a stronger balance sheet with a favorable debt-to-equity score and a better discounted cash flow outlook. However, both firms share poor profitability metrics, making Ambarella’s profile more balanced but still reliant on financial stability rather than earnings efficiency.
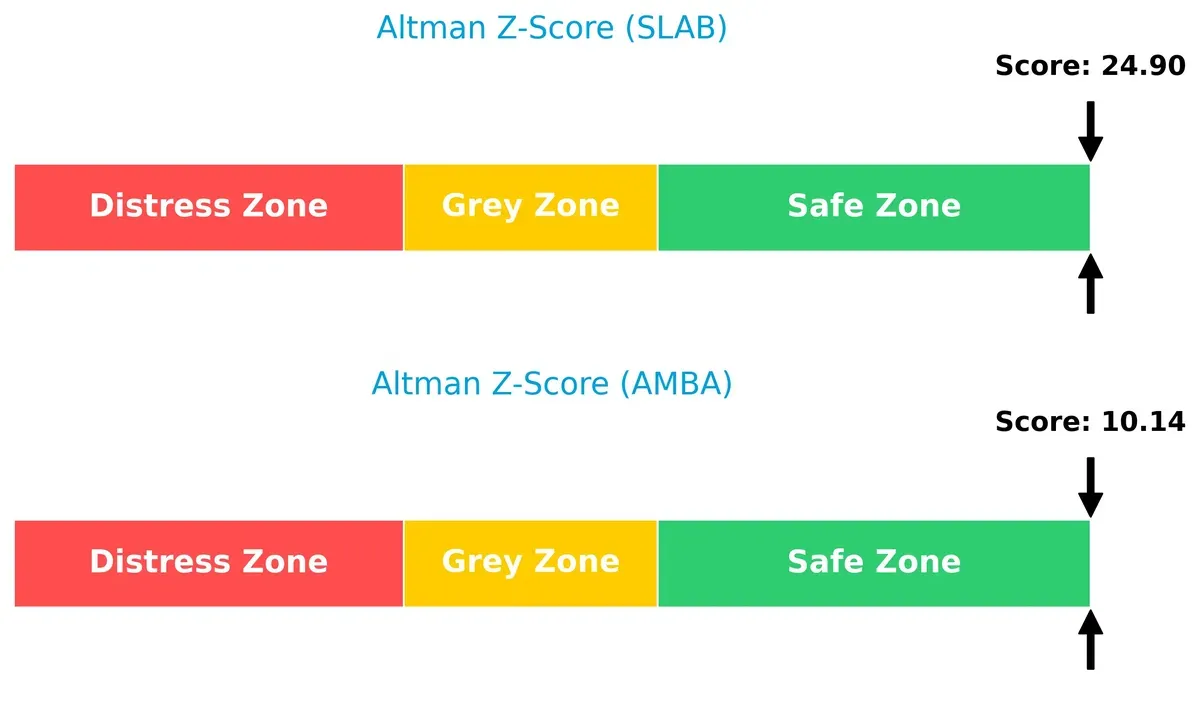
Bankruptcy Risk: Solvency Showdown
Both Silicon Laboratories and Ambarella sit comfortably in the safe zone according to their Altman Z-Scores, indicating low bankruptcy risk and strong long-term survival prospects in this market cycle:
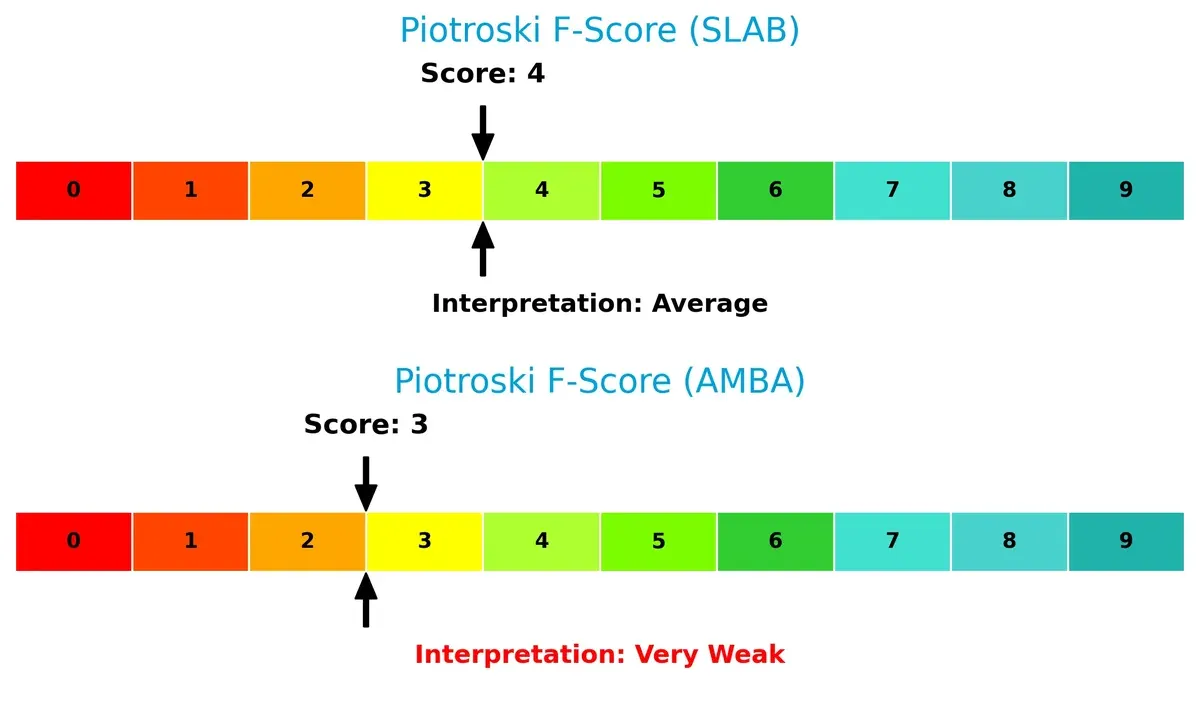
Financial Health: Quality of Operations
Silicon Laboratories posts an average Piotroski F-Score of 4, suggesting moderate financial health, while Ambarella’s score of 3 flags potential red flags in internal operations and efficiency metrics:
How are the two companies positioned?
This section dissects the operational DNA of SLAB and AMBA by comparing their revenue distribution and internal dynamics. The goal is to confront their economic moats to identify the more resilient, sustainable competitive advantage today.
Revenue Segmentation: The Strategic Mix
This visual comparison dissects how Silicon Laboratories Inc. and Ambarella, Inc. diversify their income streams and where their primary sector bets lie:
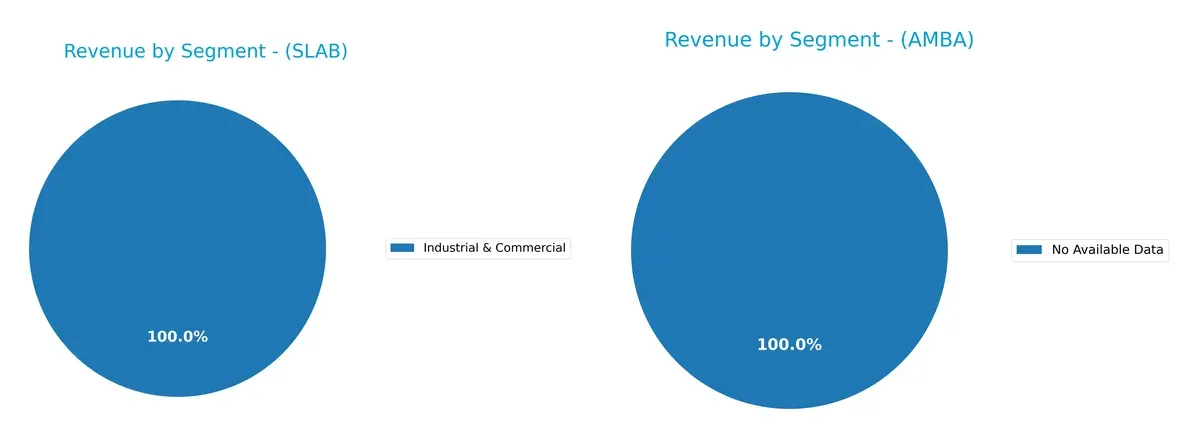
Silicon Laboratories anchors its revenue in Industrial & Commercial, with $339M in 2024, showing a recent shift from a more diversified past including IoT and Infrastructure. Ambarella lacks segment data, preventing comparison. Silicon Labs’ move toward concentration raises risks but may signal strategic focus. Historically, diversified income streams reduce volatility, so this pivot demands close monitoring for dependency risk.
Strengths and Weaknesses Comparison
This table compares the Strengths and Weaknesses of Silicon Laboratories Inc. (SLAB) and Ambarella, Inc. (AMBA):
SLAB Strengths
- High quick ratio at 4.02 indicates strong short-term liquidity
- Zero debt-to-equity ratio reduces financial risk
- Favorable fixed asset turnover of 6.1 reflects efficient asset use
- Diverse geographic revenue with significant exposure to China and Rest of World
AMBA Strengths
- Favorable current ratio of 2.65 supports liquidity
- Low debt-to-assets ratio at 0.76 keeps leverage manageable
- Outstanding fixed asset turnover of 19.96 signals excellent asset efficiency
- Geographic revenue diversification focused on Taiwan and Asia Pacific
SLAB Weaknesses
- Negative net margin (-8.27%) and ROE (-5.93%) indicate unprofitable operations
- WACC at 11.18% exceeds ROIC (-6.27%), implying value destruction
- High price-to-book ratio (3.91) may signal overvaluation
- Negative interest coverage (-58.4) raises solvency concerns
AMBA Weaknesses
- More severe negative net margin (-41.12%) and ROE (-20.86%) reflect deeper losses
- ROIC (-21.96%) well below WACC (12.97%) indicates poor capital allocation
- Higher price-to-book ratio (5.64) increases valuation risk
- Negative interest coverage (0) signals inability to cover interest expenses
Both companies face profitability and capital efficiency challenges, with returns below their cost of capital. SLAB’s superior liquidity and lower leverage present a more conservative financial position. AMBA shows stronger asset utilization but suffers from heavier losses and solvency risks. These factors shape their strategic priorities around improving profitability and managing financial risk.
The Moat Duel: Analyzing Competitive Defensibility
A structural moat is the only reliable shield protecting long-term profits from relentless competitive erosion in technology sectors:
Silicon Laboratories Inc.: Intangible Assets Powering IoT Innovation
I see Silicon Labs’ moat in its extensive portfolio of analog-intensive mixed-signal solutions for IoT applications. This intangible asset supports stable gross margins above 58%. However, its negative EBIT margin signals margin pressure. Expansion in industrial automation could deepen this moat if operational efficiency improves in 2026.
Ambarella, Inc.: Specialized Cost Advantage in Video Processing
Ambarella’s moat stems from its cost-efficient system-on-a-chip designs for HD video and AI vision. Despite a higher gross margin of 60.5%, its EBIT margin suffers from steep losses. The company’s niche in automotive and security cameras offers expansion potential but requires margin turnarounds to fortify its moat.
Intangible Assets vs. Specialized Cost Advantage: Who Defends Better?
Both firms struggle to generate ROIC above WACC, signaling value destruction. Silicon Labs’ wider IoT portfolio offers a broader moat, while Ambarella’s focused cost edge is narrower. I conclude Silicon Labs is better positioned to defend market share if it reverses margin declines and leverages IoT growth.
Which stock offers better returns?
The past year shows starkly different price dynamics. Silicon Laboratories Inc. gained strong momentum with accelerating gains, while Ambarella, Inc. saw slower overall growth and recent decline.
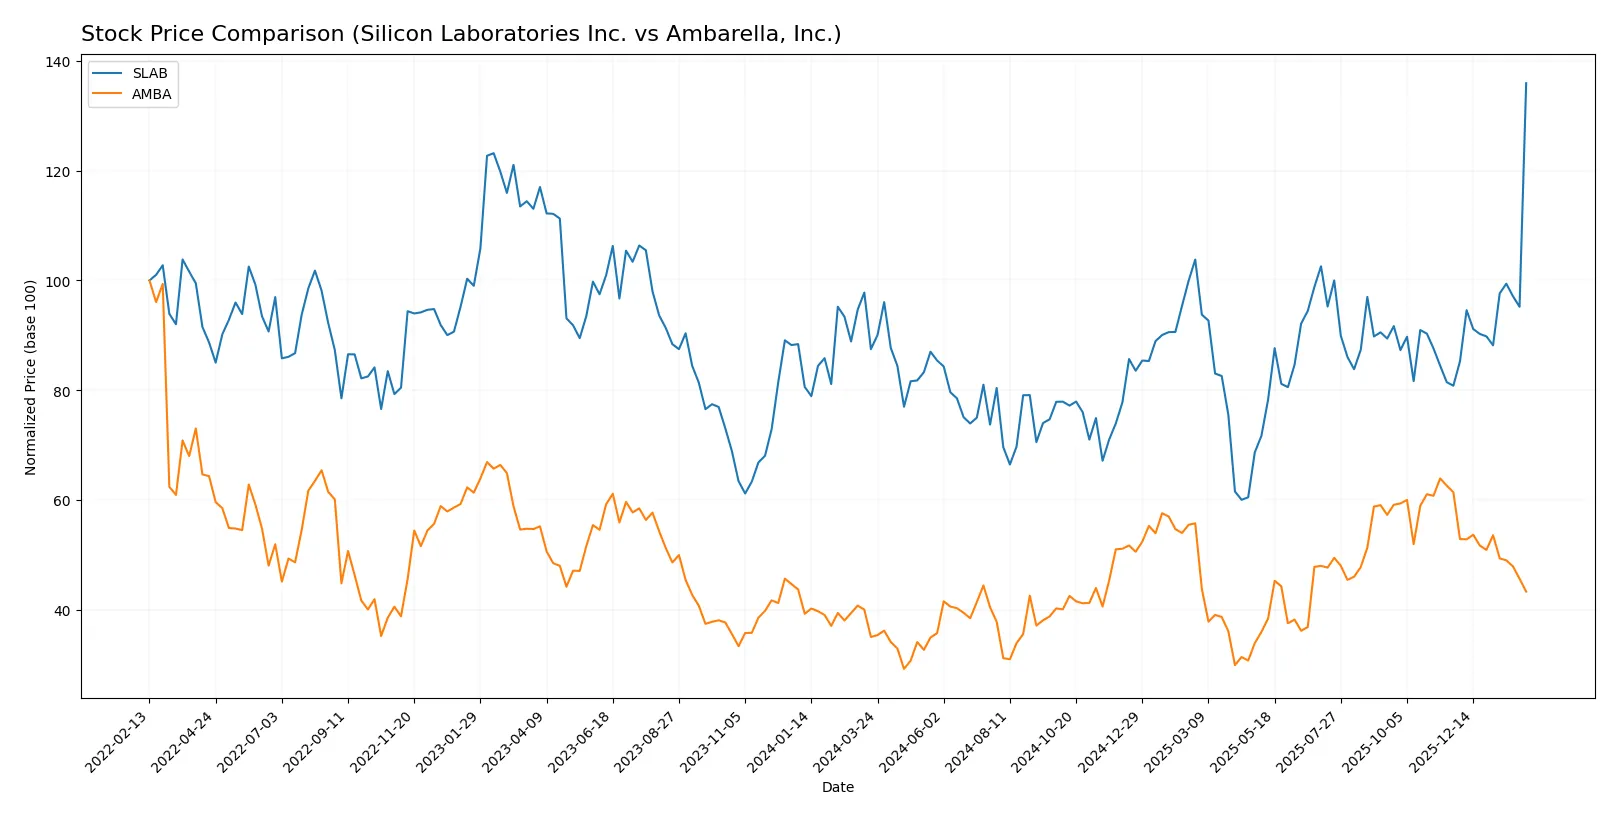
Trend Comparison
Silicon Laboratories Inc. recorded a 55.39% price increase over the last 12 months, marking a bullish trend with accelerating momentum and a high volatility of 16.05%. The stock peaked at 203.41 and bottomed at 89.82.
Ambarella, Inc. posted a 23.6% gain over the same period, showing a bullish but decelerating trend. The stock’s volatility was lower at 12.77%, with a high of 89.67 and a low of 40.99. Recent months reveal a sharp 29.48% decline.
Silicon Laboratories Inc.’s trend outperformed Ambarella, Inc. by a wide margin, delivering stronger gains with recent acceleration versus Ambarella’s recent downturn and slowing growth.
Target Prices
Analysts present a cautiously optimistic consensus on semiconductor stocks Silicon Laboratories Inc. and Ambarella, Inc.
| Company | Target Low | Target High | Consensus |
|---|---|---|---|
| Silicon Laboratories Inc. | 160 | 231 | 207.33 |
| Ambarella, Inc. | 80 | 115 | 97.5 |
Silicon Laboratories trades near its consensus target, signaling limited upside but solid valuation. Ambarella shows a significant gap between current price and target, indicating potential growth.

Don’t Let Luck Decide Your Entry Point
Optimize your entry points with our advanced ProRealTime indicators. You’ll get efficient buy signals with precise price targets for maximum performance. Start outperforming now!
How do institutions grade them?
Silicon Laboratories Inc. Grades
The following table summarizes recent institutional grade changes for Silicon Laboratories Inc.:
| Grading Company | Action | New Grade | Date |
|---|---|---|---|
| Benchmark | Downgrade | Hold | 2026-02-04 |
| Keybanc | Downgrade | Sector Weight | 2026-02-04 |
| Needham | Downgrade | Hold | 2026-02-04 |
| Susquehanna | Maintain | Neutral | 2025-08-06 |
| Morgan Stanley | Maintain | Equal Weight | 2025-08-06 |
| Barclays | Maintain | Equal Weight | 2025-08-05 |
| Susquehanna | Maintain | Neutral | 2025-07-22 |
| Stifel | Maintain | Buy | 2025-07-18 |
| Keybanc | Maintain | Overweight | 2025-07-08 |
| Benchmark | Maintain | Buy | 2025-05-27 |
Ambarella, Inc. Grades
The table below presents the latest institutional grades for Ambarella, Inc.:
| Grading Company | Action | New Grade | Date |
|---|---|---|---|
| B of A Securities | Maintain | Neutral | 2025-11-26 |
| Rosenblatt | Maintain | Buy | 2025-11-26 |
| Stifel | Maintain | Buy | 2025-11-26 |
| Needham | Maintain | Buy | 2025-11-26 |
| Rosenblatt | Maintain | Buy | 2025-11-24 |
| B of A Securities | Maintain | Neutral | 2025-08-29 |
| Northland Capital Markets | Maintain | Outperform | 2025-08-29 |
| Morgan Stanley | Maintain | Overweight | 2025-08-29 |
| Oppenheimer | Maintain | Perform | 2025-08-29 |
| Rosenblatt | Maintain | Buy | 2025-08-29 |
Which company has the best grades?
Ambarella, Inc. consistently receives Buy and Outperform ratings without recent downgrades. Silicon Laboratories shows several recent downgrades to Hold and Sector Weight. Investors may view Ambarella’s stable positive grades as a sign of stronger confidence from analysts.
Risks specific to each company
The following categories identify the critical pressure points and systemic threats facing both firms in the 2026 market environment:
1. Market & Competition
Silicon Laboratories Inc.
- Faces intense competition in analog and mixed-signal semiconductors amid IoT market shifts.
Ambarella, Inc.
- Competes fiercely in video processing chips with rapid AI and automotive tech evolution.
2. Capital Structure & Debt
Silicon Laboratories Inc.
- Zero debt, strong liquidity with current ratio 4.69; however, interest coverage is deeply negative.
Ambarella, Inc.
- Minimal debt (D/E 0.01) and better interest coverage, but weaker current ratio at 2.65.
3. Stock Volatility
Silicon Laboratories Inc.
- Beta 1.56 indicates above-market volatility; wide price range suggests sensitivity to sector cycles.
Ambarella, Inc.
- Higher beta of 1.94 signals more volatility and greater investor risk in market swings.
4. Regulatory & Legal
Silicon Laboratories Inc.
- Exposure to US-China trade tensions affecting supply chain and export controls.
Ambarella, Inc.
- Faces regulatory scrutiny on AI and automotive safety standards impacting product certifications.
5. Supply Chain & Operations
Silicon Laboratories Inc.
- Relies on global fabless model; supply disruptions in semiconductor foundries pose risks.
Ambarella, Inc.
- Dependent on specialized foundries and component suppliers; automotive sector exposure risks delays.
6. ESG & Climate Transition
Silicon Laboratories Inc.
- Moderate ESG risks; IoT applications could benefit from energy-efficient innovations.
Ambarella, Inc.
- ESG risks higher due to automotive emissions regulations and AI ethics concerns.
7. Geopolitical Exposure
Silicon Laboratories Inc.
- Significant US-China geopolitical risks due to manufacturing and sales footprint.
Ambarella, Inc.
- Also exposed to geopolitical tensions but more diversified in automotive and consumer markets.
Which company shows a better risk-adjusted profile?
Silicon Laboratories’ principal risk lies in its negative profitability metrics combined with volatile interest coverage despite zero debt. Ambarella struggles with deeper profitability erosion and higher stock volatility but benefits from a slightly stronger capital structure and better operational diversification. While both show unfavorable financial ratios, Silicon Labs’ zero debt and higher liquidity provide a marginally better cushion. Recent market data reveal Ambarella’s beta near 1.94, underscoring elevated investor risk, whereas Silicon Labs’ broader liquidity offsets some operating weaknesses. Overall, Silicon Laboratories displays a somewhat better risk-adjusted profile in the current semiconductor cycle.
Final Verdict: Which stock to choose?
Silicon Laboratories Inc. (SLAB) excels as a cash generator with operational efficiency that fuels steady revenue growth. Its biggest point of vigilance is the persistent negative returns on invested capital, signaling value destruction. SLAB might appeal to investors seeking aggressive growth with an appetite for cyclical risk.
Ambarella, Inc. (AMBA) boasts a strategic moat through its strong R&D focus and recurring revenue potential in niche markets. Its balance sheet presents a safer profile than SLAB’s, with healthier liquidity and moderate leverage. AMBA could fit portfolios favoring growth at a reasonable price, balancing innovation and financial prudence.
If you prioritize aggressive growth fueled by operational momentum, SLAB is the compelling choice due to its accelerating price trend and cash flow strength. However, if you seek better financial stability with a defensible moat, AMBA offers superior risk management and strategic positioning despite recent headwinds. Both carry risks of value erosion, and investors should align choices with their risk tolerance and investment horizon.
Disclaimer: Investment carries a risk of loss of initial capital. The past performance is not a reliable indicator of future results. Be sure to understand risks before making an investment decision.
Go Further
I encourage you to read the complete analyses of Silicon Laboratories Inc. and Ambarella, Inc. to enhance your investment decisions: