In the fast-evolving semiconductor sector, Qnity Electronics, Inc. and Ambarella, Inc. stand out as innovative players driving technological advancements. Qnity focuses on electronic materials crucial for chip manufacturing, while Ambarella specializes in video processing semiconductors with AI integration. Both companies target overlapping markets with distinct innovation strategies. This article will help you decide which company could be the most compelling addition to your investment portfolio.

Table of contents
Companies Overview
I will begin the comparison between Qnity Electronics and Ambarella by providing an overview of these two companies and their main differences.
Qnity Electronics Overview
Qnity Electronics, Inc. specializes in electronic solutions and materials essential for semiconductor chip manufacturing and advanced electronic materials. Formerly known as Novus SpinCo 1, Inc. until April 2025, the company is based in Wilmington, Delaware, and operates within the technology sector on the New York Stock Exchange, positioning itself as a significant player in semiconductor materials supply.
Ambarella Overview
Ambarella, Inc. develops semiconductor solutions focused on video processing, including HD and ultra HD compression, image processing, and AI-driven computer vision. Headquartered in Santa Clara, California, Ambarella serves diverse markets such as automotive cameras, security, robotics, and consumer electronics, leveraging system-on-a-chip technology. The company trades on NASDAQ and employs around 941 full-time staff.
Key similarities and differences
Both companies operate within the semiconductor industry, focusing on advanced technology solutions. Qnity Electronics emphasizes materials and components for chip manufacturing, while Ambarella specializes in integrated semiconductor solutions for video and AI applications. Ambarella’s product range covers multiple end markets, whereas Qnity concentrates on supplying essential materials, highlighting a distinct contrast in their business models and market focus.
Income Statement Comparison
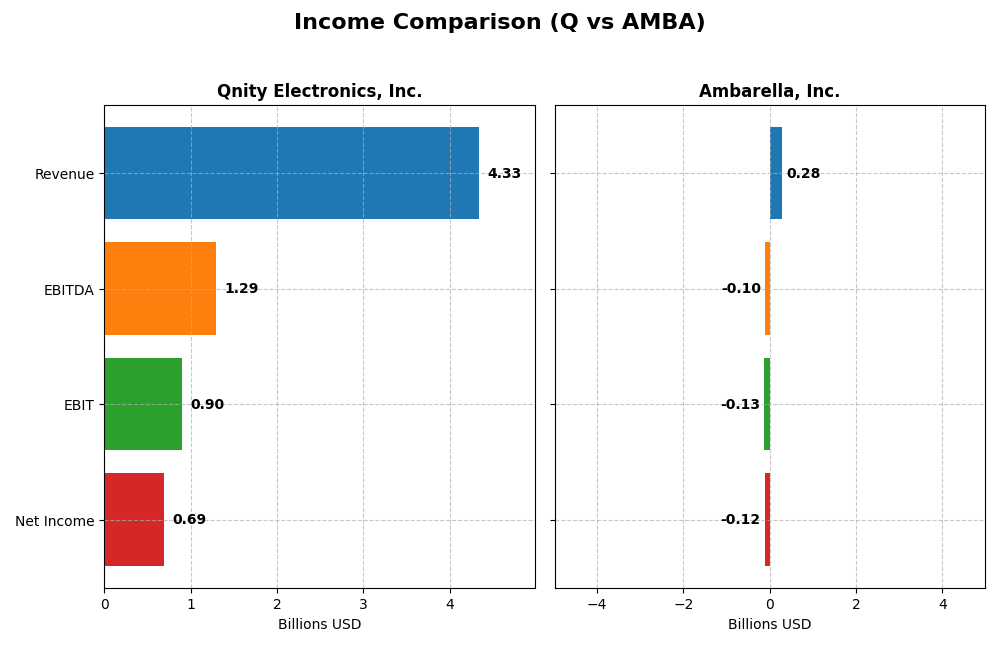
This table compares the key financial metrics from the most recent fiscal year for Qnity Electronics, Inc. and Ambarella, Inc., highlighting their income statement figures.
| Metric | Qnity Electronics, Inc. | Ambarella, Inc. |
|---|---|---|
| Market Cap | 19.5B | 2.7B |
| Revenue | 4.34B | 285M |
| EBITDA | 1.29B | -101M |
| EBIT | 898M | -127M |
| Net Income | 693M | -117M |
| EPS | 3.31 | -2.84 |
| Fiscal Year | 2024 | 2025 |
Income Statement Interpretations
Qnity Electronics, Inc.
Qnity Electronics experienced a mixed trend from 2022 to 2024, with revenue decreasing overall by 8.83% but increasing 7.43% in the last year. Net income followed a similar pattern, declining over the full period by 10.47% but rising notably by 36.69% in 2024. Margins mostly remained favorable, with a 46.11% gross margin and 15.99% net margin in 2024, showing improved profitability and operational efficiency in the latest year.
Ambarella, Inc.
Ambarella showed overall revenue growth of 27.75% from 2021 to 2025, including a strong 25.78% rise in the most recent year. However, net income declined sharply by 95.91% over the full period, despite a 33.18% EPS improvement in 2025. While the company maintained a favorable gross margin of 60.5%, its EBIT and net margins were negative in 2025, reflecting ongoing profitability challenges despite recent operational improvements.
Which one has the stronger fundamentals?
Qnity Electronics demonstrates stronger fundamentals with consistent profitability and margin stability, alongside favorable growth in net income and earnings per share in the latest year. Ambarella’s solid revenue growth and gross margin contrast with persistent net losses and negative margins, indicating weaker bottom-line performance despite positive recent trends. Overall, Qnity’s income statement exhibits more balanced and sustained financial health.
Financial Ratios Comparison
The table below presents a side-by-side comparison of key financial ratios for Qnity Electronics, Inc. (Q) and Ambarella, Inc. (AMBA) based on their most recent fiscal year data.
| Ratios | Qnity Electronics, Inc. (Q) FY 2024 | Ambarella, Inc. (AMBA) FY 2025 |
|---|---|---|
| ROE | 6.51% | -20.86% |
| ROIC | 5.92% | -21.96% |
| P/E | 28.8 | -27.1 |
| P/B | 1.88 | 5.64 |
| Current Ratio | 1.77 | 2.65 |
| Quick Ratio | 1.06 | 2.36 |
| D/E (Debt-to-Equity) | 0.018 | 0.0094 |
| Debt-to-Assets | 1.56% | 0.76% |
| Interest Coverage | 3.03 | 0 (no coverage) |
| Asset Turnover | 0.35 | 0.41 |
| Fixed Asset Turnover | 2.59 | 19.96 |
| Payout ratio | 0% | 0% |
| Dividend yield | 0% | 0% |
Interpretation of the Ratios
Qnity Electronics, Inc.
Qnity Electronics shows a mix of strengths and weaknesses in its 2024 financial ratios. Net margin and liquidity ratios are favorable, indicating operational efficiency and good short-term financial health. However, return on equity and asset turnover ratios are less favorable, suggesting moderate profitability and asset use efficiency. The company pays a small dividend, with a last dividend of $0.06, but no clear payout ratio data is available to assess sustainability fully.
Ambarella, Inc.
Ambarella’s 2025 ratios reveal significant challenges, including negative net margin, return on equity, and return on invested capital, which highlight profitability issues. The company maintains strong liquidity and low leverage, but interest coverage is zero, signaling risk in meeting debt obligations. Ambarella does not pay dividends, likely due to its negative earnings and focus on R&D, which is high relative to revenue, reflecting a reinvestment strategy.
Which one has the best ratios?
Qnity Electronics presents a slightly favorable overall ratio profile, balancing profitability and liquidity with some concerns on returns. Ambarella, by contrast, has an unfavorable ratio set marked by significant losses and profitability struggles despite sound liquidity. Based on these evaluations, Qnity Electronics holds a more stable financial outlook compared to Ambarella.
Strategic Positioning
This section compares the strategic positioning of Qnity Electronics, Inc. and Ambarella, Inc., including market position, key segments, and exposure to technological disruption:
Qnity Electronics, Inc.
- Large market cap of 19.5B with stable profitability, facing general semiconductor competitive pressures
- Focuses on electronic solutions and materials for semiconductor chip manufacturing and advanced materials
- No explicit information on technological disruption exposure
Ambarella, Inc.
- Smaller market cap of 2.7B, exposed to high market volatility with beta near 2, indicating strong competitive dynamics
- Develops semiconductor solutions for HD video processing in automotive, security, robotics, and consumer cameras
- Faces potential technological disruption due to AI, video processing, and autonomous vehicle system innovation
Qnity Electronics, Inc. vs Ambarella, Inc. Positioning
Qnity is concentrated in semiconductor materials with a large market cap and stable profitability, while Ambarella offers diversified video-centric semiconductor solutions but faces stronger market volatility and declining profitability.
Which has the best competitive advantage?
Qnity holds a neutral moat with stable profitability, whereas Ambarella shows a very unfavorable moat with declining returns, indicating Qnity currently maintains a comparatively stronger competitive advantage.
Stock Comparison
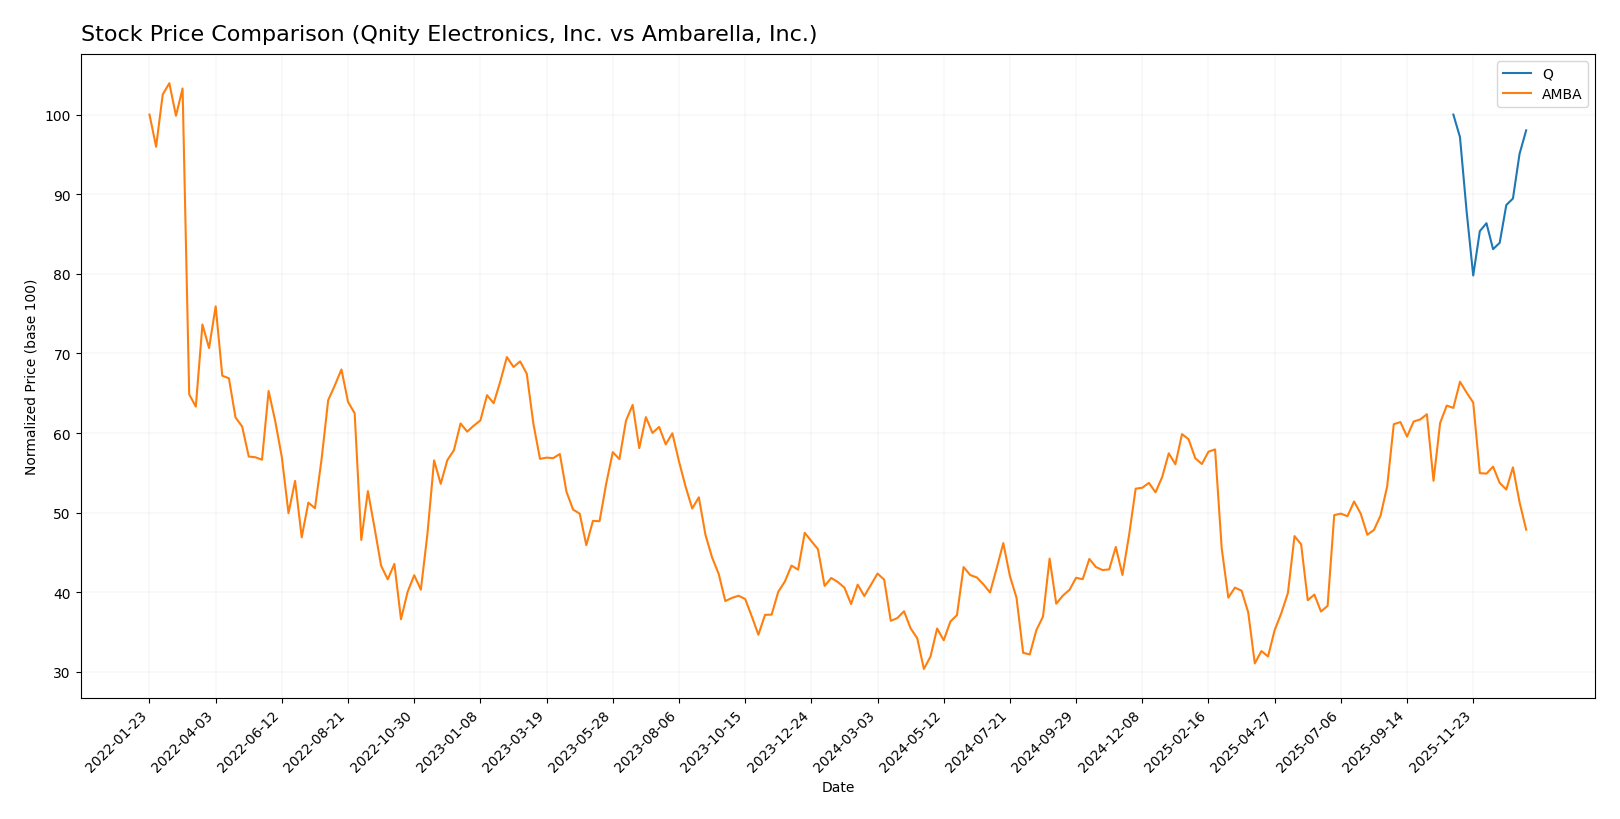
The past year has shown contrasting price dynamics between Qnity Electronics, Inc. and Ambarella, Inc., with Qnity experiencing a slight bearish trend while Ambarella posted a notable bullish trend despite recent volatility.
Trend Analysis
Qnity Electronics, Inc. exhibited a bearish trend over the last 12 months with a price decline of 1.98%, remaining stable in acceleration and fluctuating between a high of 95.0 and low of 75.8.
Ambarella, Inc. showed a bullish trend with a 16.9% price increase over the same period, although recent months have seen a deceleration and a sharp 24.21% drop, indicating increased volatility.
Comparing both stocks, Ambarella delivered the highest market performance over the past year, outperforming Qnity significantly despite recent downward pressure.
Target Prices
Here is the consensus target price outlook from verified analysts for Qnity Electronics, Inc. and Ambarella, Inc.:
| Company | Target High | Target Low | Consensus |
|---|---|---|---|
| Qnity Electronics, Inc. | 117 | 92 | 105.89 |
| Ambarella, Inc. | 115 | 80 | 97.5 |
Analysts expect both stocks to appreciate from current prices, with Qnity Electronics’ consensus target about 14% above its $93.12 price, and Ambarella’s target roughly 51% above its $64.6 price. This suggests moderate to strong upside potential in both cases.
Analyst Opinions Comparison
This section compares analysts’ ratings and grades for Qnity Electronics, Inc. (Q) and Ambarella, Inc. (AMBA):
Rating Comparison
Q Rating
- Rating: B+, indicating a very favorable overall assessment.
- Discounted Cash Flow Score: 4, showing favorable future cash flow projections.
- ROE Score: 3, a moderate measure of profit generation from equity.
- ROA Score: 4, favorable use of assets to generate earnings.
- Debt To Equity Score: 3, moderate financial risk with balanced debt levels.
- Overall Score: 3, moderate overall financial standing.
AMBA Rating
- Rating: C+, reflecting a very favorable but lower overall assessment.
- Discounted Cash Flow Score: 3, indicating a moderate valuation outlook.
- ROE Score: 1, a very unfavorable score on shareholder equity efficiency.
- ROA Score: 1, very unfavorable asset utilization for earnings.
- Debt To Equity Score: 4, favorable balance sheet with low financial risk.
- Overall Score: 2, moderate but lower overall financial standing than Q.
Which one is the best rated?
Based strictly on the provided data, Qnity Electronics (Q) is better rated overall, with higher scores in discounted cash flow, ROE, ROA, and a better overall score than Ambarella (AMBA). Ambarella scores better only in debt-to-equity.
Scores Comparison
The scores comparison between Qnity Electronics, Inc. and Ambarella, Inc. is as follows:
Q Scores
- No Altman Z-Score data available.
- No Piotroski Score data available.
AMBA Scores
- Altman Z-Score of 10.69, indicating a safe zone.
- Piotroski Score of 3, categorized as very weak.
Which company has the best scores?
Based on the available data, Ambarella has a clearly strong Altman Z-Score, placing it in the safe zone, but a very weak Piotroski Score. No scores are available for Qnity Electronics to compare.
Grades Comparison
Here is a comparison of the latest grades assigned by recognized grading companies for both companies:
Qnity Electronics, Inc. Grades
The table below shows recent grades from reputable grading firms for Qnity Electronics, Inc.:
| Grading Company | Action | New Grade | Date |
|---|---|---|---|
| RBC Capital | Maintain | Outperform | 2025-11-25 |
| Mizuho | Maintain | Outperform | 2025-11-20 |
Qnity Electronics has consistently received “Outperform” ratings, indicating a positive outlook from analysts.
Ambarella, Inc. Grades
Below is a summary of Ambarella, Inc.’s recent grades from established grading firms:
| Grading Company | Action | New Grade | Date |
|---|---|---|---|
| B of A Securities | Maintain | Neutral | 2025-11-26 |
| Needham | Maintain | Buy | 2025-11-26 |
| Stifel | Maintain | Buy | 2025-11-26 |
| Rosenblatt | Maintain | Buy | 2025-11-26 |
| Rosenblatt | Maintain | Buy | 2025-11-24 |
| Stifel | Maintain | Buy | 2025-08-29 |
| Needham | Maintain | Buy | 2025-08-29 |
| Northland Capital Markets | Maintain | Outperform | 2025-08-29 |
| Morgan Stanley | Maintain | Overweight | 2025-08-29 |
| Oppenheimer | Maintain | Perform | 2025-08-29 |
Ambarella’s ratings range from Neutral to Buy and Outperform, showing a generally favorable but more mixed analyst sentiment.
Which company has the best grades?
Both Qnity Electronics and Ambarella hold a consensus “Buy” rating, but Qnity’s grades are uniformly “Outperform,” suggesting stronger confidence from fewer analysts. Ambarella has broader analyst coverage with more diverse opinions, which may imply varied risk and reward expectations for investors.
Strengths and Weaknesses
The table below compares the key strengths and weaknesses of Qnity Electronics, Inc. (Q) and Ambarella, Inc. (AMBA) based on their recent financial performance and strategic positioning.
| Criterion | Qnity Electronics, Inc. (Q) | Ambarella, Inc. (AMBA) |
|---|---|---|
| Diversification | Moderate product range; stable market segments | Limited diversification; focused on niche markets |
| Profitability | Positive net margin (15.99%), slightly favorable | Negative net margin (-41.12%), unfavorable |
| Innovation | Neutral ROIC trend, stable but no growth | Declining ROIC trend, value destroying |
| Global presence | Moderate, stable operations globally | Smaller scale, limited global reach |
| Market Share | Stable but not dominant | Shrinking share due to profitability issues |
Key takeaways: Qnity Electronics shows stable profitability and financial health, making it a slightly favorable investment despite moderate innovation growth. Ambarella struggles with significant losses and declining profitability, posing higher risks for investors.
Risk Analysis
Below is a comparative table highlighting key risks for Qnity Electronics, Inc. (Q) and Ambarella, Inc. (AMBA) based on the most recent data from 2025-2026.
| Metric | Qnity Electronics, Inc. (Q) | Ambarella, Inc. (AMBA) |
|---|---|---|
| Market Risk | Moderate (Beta 0) | High (Beta 1.95) |
| Debt Level | Very low (D/E 0.02) | Very low (D/E 0.01) |
| Regulatory Risk | Moderate | Moderate |
| Operational Risk | Moderate (asset turnover 0.35) | Moderate (asset turnover 0.41) |
| Environmental Risk | Low | Low |
| Geopolitical Risk | Moderate (US-based) | Moderate (US-based) |
Qnity Electronics shows lower market risk due to zero beta, minimal debt, and favorable liquidity ratios, although it has moderate operational efficiency concerns. Ambarella carries higher market risk with nearly double beta, suffers from significant profitability issues, and has a very weak Piotroski score despite a strong Altman Z-Score, indicating operational and financial challenges. The most impactful risks for Ambarella relate to weak earnings and operational performance that could affect long-term stability.
Which Stock to Choose?
Qnity Electronics, Inc. shows a slightly favorable global ratio profile with a 15.99% net margin and a low debt level (net debt to EBITDA 0.02). Its income statement is favorable overall, supported by positive growth in gross profit and EBIT margin, though profitability ratios like ROE remain moderate. The company’s MOAT evaluation is neutral, indicating stable but not exceptional competitive advantage. Its rating is very favorable with a B+ grade, reflecting sound financial health and moderate valuation metrics.
Ambarella, Inc. displays an unfavorable global ratio evaluation due to negative profitability ratios including a -41.12% net margin and declining ROIC well below WACC, signaling value destruction. Despite favorable liquidity and low debt ratios, the company struggles with profitability and efficiency. Its income statement is considered favorable on growth terms, but the rating remains lower at C+ with several very unfavorable scores in returns. The MOAT evaluation is very unfavorable, evidencing deteriorating profitability and competitive position.
For investors prioritizing stability and moderate profitability, Qnity Electronics may appear more favorable given its solid income fundamentals and balanced financial ratios. Conversely, investors focused on potential growth and willing to accept higher risk might find Ambarella’s recent revenue growth and bullish market trend suggestive, despite its current profitability challenges and very unfavorable moat rating. Thus, the choice could depend on the investor’s risk tolerance and investment strategy.
Disclaimer: Investment carries a risk of loss of initial capital. The past performance is not a reliable indicator of future results. Be sure to understand risks before making an investment decision.
Go Further
I encourage you to read the complete analyses of Qnity Electronics, Inc. and Ambarella, Inc. to enhance your investment decisions: