Ambarella, Inc. and Pony AI Inc. are two dynamic players driving innovation in technology and mobility sectors. Ambarella excels in semiconductor solutions for advanced video processing, while Pony AI pioneers autonomous vehicle services and intelligent driving software. Both companies intersect at the forefront of AI and automation, making their market strategies and growth prospects highly relevant. This article will help you determine which company presents the most compelling investment opportunity today.

Table of contents
Companies Overview
I will begin the comparison between Ambarella and Pony AI by providing an overview of these two companies and their main differences.
Ambarella Overview
Ambarella, Inc. develops semiconductor solutions specializing in video processing, focusing on high-definition and ultra HD compression, image processing, and AI-powered computer vision. The company’s system-on-a-chip integrates multiple functions to deliver superior video quality and low power consumption. Ambarella serves markets including automotive cameras, security, robotics, and consumer electronics, positioning itself as a technology innovator headquartered in Santa Clara, California.
Pony AI Overview
Pony AI Inc. operates in autonomous mobility, providing robotruck and robotaxi services primarily in China and the United States. The company offers AV software deployment, vehicle integration, and intelligent driving solutions, including proprietary vehicle domain controllers and V2X safety products. Founded in 2016 and based in Guangzhou, Pony AI focuses on engineering and software services to advance autonomous vehicle adoption and logistics efficiency.
Key similarities and differences
Both companies operate in technology-driven sectors involving AI and automation, but Ambarella centers on semiconductor chips for video processing across various industries, while Pony AI concentrates on autonomous vehicle software and services. Ambarella’s product portfolio targets hardware integration, whereas Pony AI emphasizes mobility solutions and software deployment. Their geographic bases and core markets also differ, with Ambarella rooted in the US tech sector and Pony AI focusing on China and US mobility services.
Income Statement Comparison
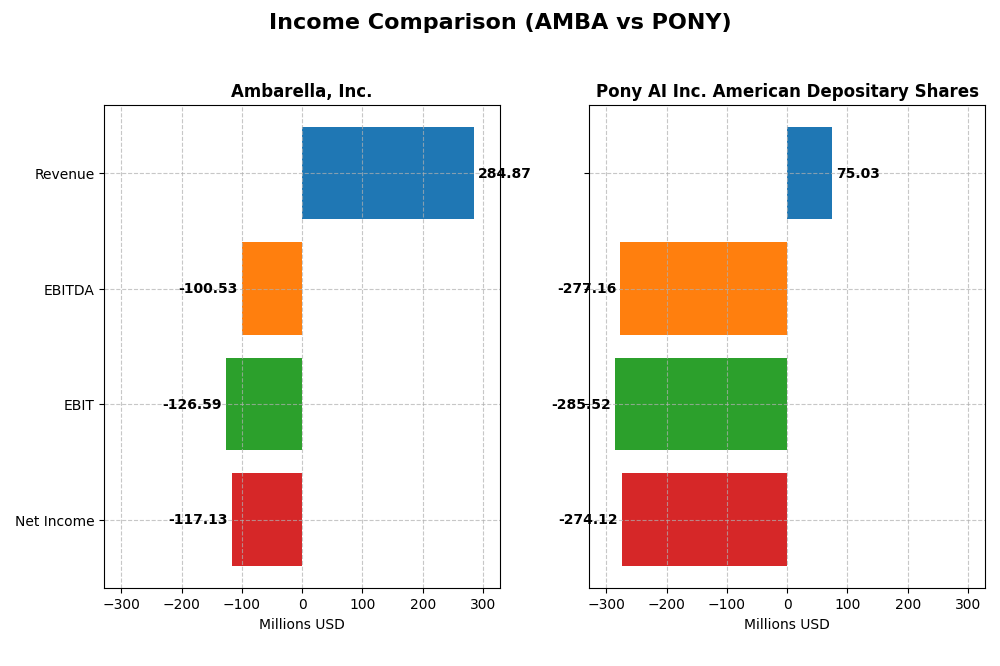
The table below presents a side-by-side comparison of key income statement metrics for Ambarella, Inc. and Pony AI Inc. based on their most recent fiscal year results.
| Metric | Ambarella, Inc. (AMBA) | Pony AI Inc. (PONY) |
|---|---|---|
| Market Cap | 3.18B | 6.19B |
| Revenue | 285M | 75M |
| EBITDA | -101M | -277M |
| EBIT | -127M | -286M |
| Net Income | -117M | -274M |
| EPS | -2.84 | -2.40 |
| Fiscal Year | 2025 | 2024 |
Income Statement Interpretations
Ambarella, Inc.
Ambarella showed a 27.75% revenue growth over 2021-2025, with a favorable gross margin of 60.5%. Despite these positives, the company faced persistent net losses, though net margin improved by 45.04% in the last year. The 2025 fiscal year saw revenue increase by 25.78%, with a significant reduction in net loss and better operating efficiency.
Pony AI Inc. American Depositary Shares
Pony AI experienced rapid revenue expansion of 824.29% over 2021-2024, but profitability remained elusive with a net margin of -365.37%. Gross profit declined by 32.46% in 2024, and EBIT margin was deeply negative. The last fiscal year’s revenue growth slowed to 4.35%, with deteriorating earnings and worsening net margin.
Which one has the stronger fundamentals?
Ambarella’s income statement presents more favorable fundamentals, with solid revenue growth, strong gross margins, and improving profitability metrics despite net losses. Pony AI shows impressive top-line growth but suffers from severe profitability issues and margin deterioration, resulting in an overall unfavorable income statement evaluation.
Financial Ratios Comparison
The table below presents a side-by-side comparison of key financial ratios for Ambarella, Inc. (AMBA) and Pony AI Inc. (PONY) based on their most recent fiscal year data.
| Ratios | Ambarella, Inc. (AMBA) 2025 | Pony AI Inc. (PONY) 2024 |
|---|---|---|
| ROE | -20.86% | -28.82% |
| ROIC | -21.96% | -29.05% |
| P/E | -27.05 | -5.98 |
| P/B | 5.64 | 1.72 |
| Current Ratio | 2.65 | 11.77 |
| Quick Ratio | 2.36 | 11.77 |
| D/E | 0.0094 | 0.0145 |
| Debt-to-Assets | 0.0076 | 0.0131 |
| Interest Coverage | 0 | 0 |
| Asset Turnover | 0.41 | 0.07 |
| Fixed Asset Turnover | 19.96 | 2.05 |
| Payout ratio | 0 | 0 |
| Dividend yield | 0 | 0 |
Interpretation of the Ratios
Ambarella, Inc.
Ambarella exhibits a mixed ratio profile with 43% favorable and 57% unfavorable metrics. Key weaknesses include a negative net margin of -41.12% and poor returns on equity and invested capital, signaling profitability challenges. The company holds strong liquidity with a current ratio of 2.65 and low leverage. Ambarella pays no dividends, likely reinvesting earnings to support its semiconductor innovation and growth.
Pony AI Inc. American Depositary Shares
Pony AI also shows a challenging ratio set with 29% favorable, 57% unfavorable, and 14% neutral ratios. It faces severe profitability issues, including a net margin of -365.37% and negative returns on equity and capital. Liquidity is very high but the current ratio is marked unfavorable due to possible operational inefficiencies. Pony AI does not distribute dividends, likely prioritizing reinvestment in autonomous mobility and R&D.
Which one has the best ratios?
Both Ambarella and Pony AI have unfavorable global ratio opinions, reflecting profitability and return weaknesses. Ambarella’s higher proportion of favorable ratios, better asset turnover, and stronger liquidity measures give it a relatively more balanced profile. Pony AI’s extreme negative margins and operational challenges weigh heavier despite some favorable liquidity and leverage ratios.
Strategic Positioning
This section compares the strategic positioning of Ambarella, Inc. and Pony AI Inc., focusing on market position, key segments, and exposure to technological disruption:
Ambarella, Inc.
- Positioned in semiconductors with competitive pressure in video processing and AI chip markets.
- Key segments include automotive cameras, security, robotics, and consumer video applications.
- Exposed to disruption through AI and deep neural network processing in semiconductor products.
Pony AI Inc. American Depositary Shares
- Operates in rental & leasing services, facing competition in autonomous mobility solutions.
- Main drivers are robotruck, robotaxi services, and intelligent vehicle solutions in China and US.
- Faces disruption from advances in autonomous vehicle software, integration, and V2X technologies.
Ambarella, Inc. vs Pony AI Inc. Positioning
Ambarella has a diversified technology portfolio across automotive, security, and consumer segments, while Pony AI concentrates on autonomous mobility services and intelligent vehicle solutions. Ambarella benefits from varied applications; Pony AI focuses on innovative mobility solutions in growing markets.
Which has the best competitive advantage?
Both companies are currently shedding value with ROIC below WACC. Ambarella shows declining profitability, while Pony AI exhibits improving ROIC trends, indicating a slightly more favorable outlook despite ongoing value destruction.
Stock Comparison
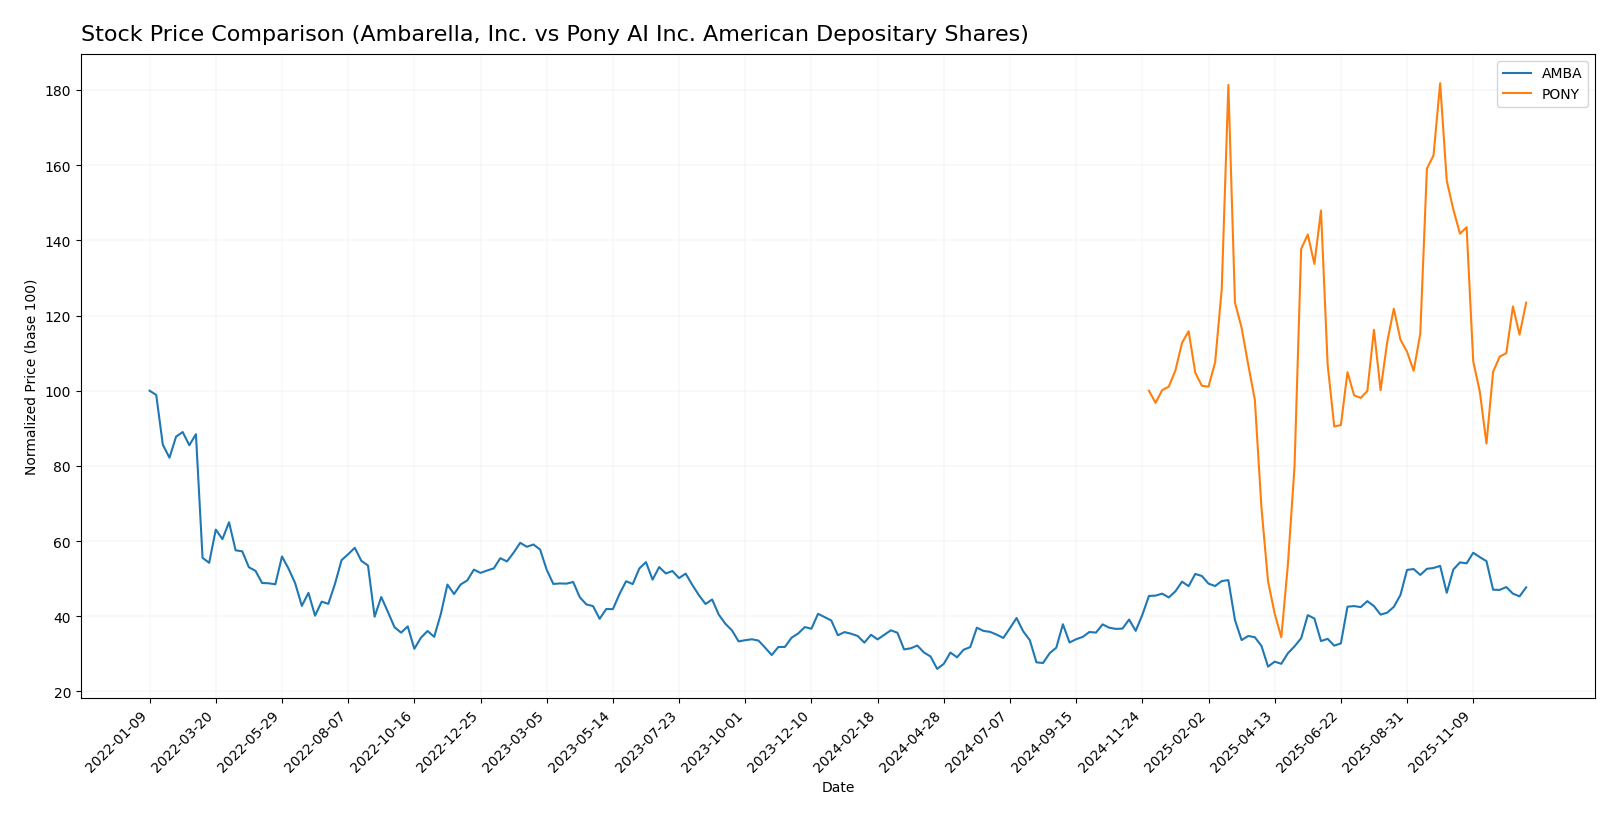
The stock price movements of Ambarella, Inc. (AMBA) and Pony AI Inc. (PONY) over the past 12 months reveal significant bullish trends with deceleration, accompanied by recent short-term declines in both equities.
Trend Analysis
Ambarella, Inc. exhibited a 35.96% price increase over the past year, indicating a bullish trend with deceleration. The stock reached a high of 89.67 and a low of 40.99, showing a recent short-term decline of -9.1%.
Pony AI Inc. delivered a 23.43% price gain over the same period, also reflecting a bullish trend with deceleration. Its price fluctuated between 4.48 and 23.67, with a recent downward trend of -16.69%.
Comparing the two, Ambarella outperformed Pony AI in market performance over the past year, despite both showing recent short-term bearish corrections.
Target Prices
The current analyst consensus indicates promising upside potential for these stocks based on verified targets.
| Company | Target High | Target Low | Consensus |
|---|---|---|---|
| Ambarella, Inc. | 115 | 80 | 97.5 |
| Pony AI Inc. American Depositary Shares | 32.8 | 15 | 25.6 |
Ambarella’s consensus target price of 97.5 suggests a notable upside from its current 75.16 USD, while Pony AI’s 25.6 target consensus also indicates significant growth potential above its current 16.07 USD price.
Analyst Opinions Comparison
This section compares analysts’ ratings and key financial scores for Ambarella, Inc. (AMBA) and Pony AI Inc. American Depositary Shares (PONY):
Rating Comparison
AMBA Rating
- Rating: C+, categorized as Very Favorable overall.
- Discounted Cash Flow Score: 3, indicating a moderate valuation assessment.
- ROE Score: 1, reflecting very unfavorable profitability from shareholder equity.
- ROA Score: 1, showing very unfavorable asset utilization efficiency.
- Debt To Equity Score: 4, indicating favorable financial leverage.
- Overall Score: 2, assessed as moderate financial standing.
PONY Rating
- Rating: C-, categorized as Very Favorable overall.
- Discounted Cash Flow Score: 1, indicating a very unfavorable valuation assessment.
- ROE Score: 1, reflecting very unfavorable profitability from shareholder equity.
- ROA Score: 1, showing very unfavorable asset utilization efficiency.
- Debt To Equity Score: 4, indicating favorable financial leverage.
- Overall Score: 1, assessed as very unfavorable financial standing.
Which one is the best rated?
Based strictly on the data, AMBA holds a higher overall rating (C+ vs. C-) and scores moderately better in discounted cash flow and overall financial standing. Both have equally unfavorable profitability scores, but AMBA’s financial health is comparatively stronger.
Scores Comparison
Here is a comparison of the Altman Z-Score and Piotroski Score for the two companies:
AMBA Scores
- Altman Z-Score: 10.88, indicates a safe zone company.
- Piotroski Score: 3, categorized as very weak financial strength.
PONY Scores
- Altman Z-Score: 36.39, indicates a safe zone company.
- Piotroski Score: 2, categorized as very weak financial strength.
Which company has the best scores?
Both AMBA and PONY have Altman Z-Scores placing them in the safe zone, indicating low bankruptcy risk. However, AMBA’s Piotroski Score is slightly higher at 3 compared to PONY’s 2, though both indicate very weak financial strength.
Grades Comparison
The following presents a comparison of the latest available grades from recognized grading firms for the two companies:
Ambarella, Inc. Grades
This table summarizes recent grade actions from several established grading companies for Ambarella, Inc.
| Grading Company | Action | New Grade | Date |
|---|---|---|---|
| Rosenblatt | Maintain | Buy | 2025-11-26 |
| Stifel | Maintain | Buy | 2025-11-26 |
| B of A Securities | Maintain | Neutral | 2025-11-26 |
| Needham | Maintain | Buy | 2025-11-26 |
| Rosenblatt | Maintain | Buy | 2025-11-24 |
| Oppenheimer | Maintain | Perform | 2025-08-29 |
| Morgan Stanley | Maintain | Overweight | 2025-08-29 |
| Northland Capital Markets | Maintain | Outperform | 2025-08-29 |
| B of A Securities | Maintain | Neutral | 2025-08-29 |
| Stifel | Maintain | Buy | 2025-08-29 |
Overall, Ambarella, Inc. exhibits a consistently positive rating trend, predominantly maintaining Buy or equivalent positive grades from prominent financial firms.
Pony AI Inc. American Depositary Shares Grades
This table shows the recent grade action by a reputable grading company for Pony AI Inc.
| Grading Company | Action | New Grade | Date |
|---|---|---|---|
| Citigroup | Maintain | Buy | 2025-11-07 |
Pony AI Inc. currently holds a single Buy rating from Citigroup, indicating a positive but limited grade coverage.
Which company has the best grades?
Ambarella, Inc. has received a broader consensus of Buy and equivalent positive ratings from multiple reputable firms, while Pony AI Inc. has a single Buy rating. This wider positive consensus for Ambarella may suggest relatively stronger analyst confidence, potentially influencing investor sentiment accordingly.
Strengths and Weaknesses
The table below summarizes the key strengths and weaknesses of Ambarella, Inc. (AMBA) and Pony AI Inc. (PONY) based on their recent financial performance, innovation, market position, and global footprint.
| Criterion | Ambarella, Inc. (AMBA) | Pony AI Inc. (PONY) |
|---|---|---|
| Diversification | Limited product range, focused on image processing semiconductors | Moderate diversification with engineering, product sales, and virtual driver services |
| Profitability | Negative net margin (-41.12%), declining ROIC, value destroying | Negative net margin (-365.37%), but improving ROIC trend, value destroying |
| Innovation | Strong in fixed asset turnover (19.96), but struggling in profitability | Growing innovation reflected in expanding virtual driver services |
| Global presence | Established global semiconductor player | Emerging player with growing global AI autonomous driving footprint |
| Market Share | Facing competitive pressures, declining returns | Small but growing market share in autonomous driving and AI services |
Key takeaways: Both companies currently face profitability challenges and are value destroyers. Ambarella shows declining returns and limited diversification, while Pony AI demonstrates improving profitability trends and diversified revenue streams. Investors should weigh the growth potential of Pony AI’s innovation against Ambarella’s established market presence but deteriorating profitability.
Risk Analysis
Below is a comparative table highlighting key risks for Ambarella, Inc. (AMBA) and Pony AI Inc. (PONY) based on the most recent 2025/2024 data.
| Metric | Ambarella, Inc. (AMBA) | Pony AI Inc. (PONY) |
|---|---|---|
| Market Risk | High beta at 1.975 indicates above-average volatility | Very high beta at 6.39 signals extreme market sensitivity |
| Debt level | Very low debt-to-equity (0.01); low leverage | Very low debt-to-equity (0.01); low leverage |
| Regulatory Risk | Moderate, US semiconductor sector with export controls risk | Elevated, operates in China & US autonomous vehicles, sensitive to regulatory changes |
| Operational Risk | Moderate; semiconductor manufacturing complexity | High; early-stage autonomous tech with operational scalability challenges |
| Environmental Risk | Low; technology sector with limited direct environmental impact | Moderate; logistics and vehicle operations potentially impacted by emissions regulations |
| Geopolitical Risk | Moderate; US-China trade tensions affect supply chains | High; geopolitical tensions impact cross-border operations and tech deployment |
In synthesis, Pony AI faces the highest market and geopolitical risks due to its exposure to volatile markets and complex regulatory environments in China and the US. Ambarella’s main risk is market volatility coupled with unfavorable profitability ratios. Both companies show strong balance sheets with minimal debt, reducing financial distress risk despite operational challenges.
Which Stock to Choose?
Ambarella, Inc. (AMBA) shows a favorable income evolution with 25.78% revenue growth in 2025 and a 64.29% favorable income statement evaluation. However, profitability remains negative, with a -41.12% net margin and declining ROIC versus WACC, indicating value destruction. Financial ratios are mixed, with 42.86% favorable but an overall unfavorable rating, though debt levels are low and liquidity strong. The company’s credit rating is C+ (Very Favorable).
Pony AI Inc. (PONY) exhibits weaker income trends, with a 4.35% revenue growth in 2024 but a predominance of unfavorable income metrics, including a -365.37% net margin and a generally unfavorable income statement evaluation of 64.29%. The financial ratios are largely unfavorable (57.14%), despite low debt and strong liquidity, and a C- rating (Very Favorable). Its ROIC is improving but remains below its WACC, signaling ongoing value loss.
Investors seeking growth might view Ambarella’s stronger income growth and moderate rating as more appealing, while those focused on emerging companies with improving profitability could find Pony’s improving ROIC trend noteworthy despite weaker current metrics. Both stocks present financial challenges, and risk-averse investors might see both as carrying considerable uncertainty.
Disclaimer: Investment carries a risk of loss of initial capital. The past performance is not a reliable indicator of future results. Be sure to understand risks before making an investment decision.
Go Further
I encourage you to read the complete analyses of Ambarella, Inc. and Pony AI Inc. American Depositary Shares to enhance your investment decisions: