In the fast-evolving technology sector, Ambarella, Inc. (AMBA) and Ouster, Inc. (OUST) stand out for their innovative approaches to advanced imaging and sensing solutions. Ambarella specializes in semiconductor video processing for automotive and security applications, while Ouster focuses on high-resolution digital lidar sensors for autonomous systems and robotics. This comparison will help investors identify which company offers the most compelling opportunity amid overlapping markets and cutting-edge innovation. Let’s explore which is the smarter investment choice.
Table of contents
Companies Overview
I will begin the comparison between Ambarella, Inc. and Ouster, Inc. by providing an overview of these two companies and their main differences.
Ambarella Overview
Ambarella, Inc. develops semiconductor solutions focused on HD and ultra HD video compression, image processing, and AI computer vision algorithms. Its integrated system-on-a-chip designs serve multiple markets, including automotive cameras, industrial robotics, security, and consumer devices. Headquartered in Santa Clara, California, Ambarella operates with about 941 employees and is positioned as a key player in semiconductor technology for video applications.
Ouster Overview
Ouster, Inc. designs and manufactures high-resolution digital lidar sensors and software that provide 3D vision for machinery, vehicles, robots, and infrastructure. Based in San Francisco, California, with 292 employees, Ouster focuses on innovative lidar solutions with products like scanning and solid-state flash sensors. It operates in the hardware and equipment sector, emphasizing advanced sensing technology for various applications.
Key similarities and differences
Both Ambarella and Ouster operate in the technology sector with a focus on visual and sensing solutions, but their product offerings differ significantly. Ambarella specializes in semiconductor chips for video and AI processing across diverse markets, while Ouster develops lidar hardware and software for 3D vision systems. Ambarella has a larger workforce and market cap (3.18B vs. 1.40B), reflecting its broader product portfolio and longer market presence compared to Ouster’s more niche lidar focus.
Income Statement Comparison
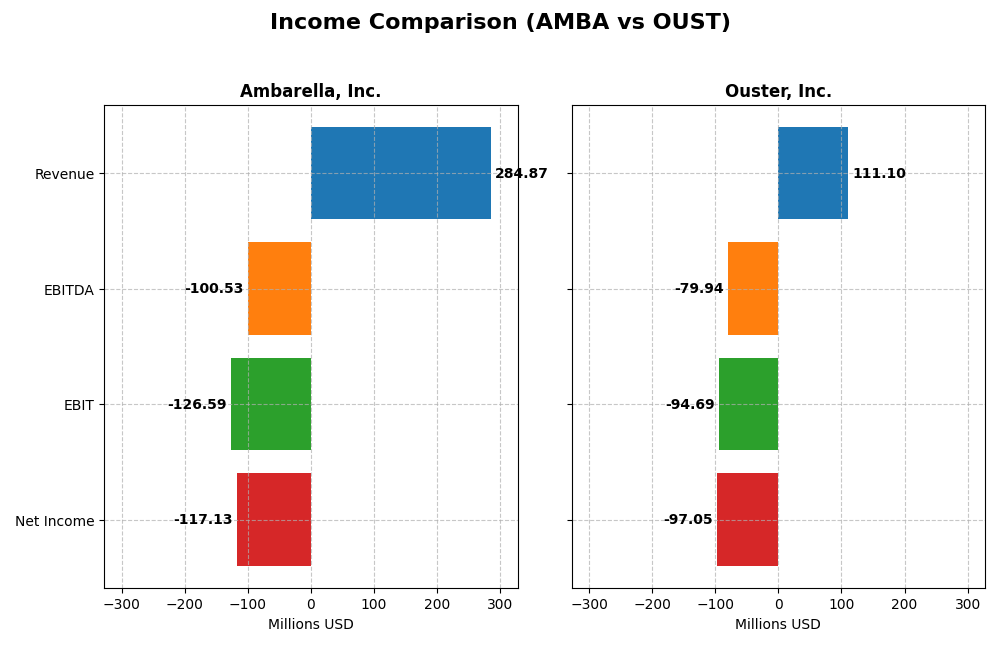
The table below presents a side-by-side comparison of key income statement metrics for Ambarella, Inc. and Ouster, Inc. for their most recent fiscal years.
| Metric | Ambarella, Inc. (AMBA) | Ouster, Inc. (OUST) |
|---|---|---|
| Market Cap | 3.18B | 1.40B |
| Revenue | 285M | 111M |
| EBITDA | -101M | -80M |
| EBIT | -127M | -95M |
| Net Income | -117M | -97M |
| EPS | -2.84 | -2.08 |
| Fiscal Year | 2025 | 2024 |
Income Statement Interpretations
Ambarella, Inc.
Ambarella’s revenue showed moderate growth over 2021-2025, increasing by 27.75%, while net income declined sharply by 95.91%, reflecting persistent net losses. Gross margins remained strong at 60.5%, but EBIT and net margins stayed negative. In 2025, revenue grew 25.78% year-on-year, with improved net margin and EPS growth, indicating a partial recovery despite ongoing losses.
Ouster, Inc.
Ouster experienced significant revenue growth of 487.71% from 2020 to 2024, with net income also improving by 9.12%. Gross margin was a modest 36.42%, while EBIT and net margins remained deeply negative. The latest fiscal year showed strong year-on-year gains in revenue (33.41%) and profitability metrics, including substantial improvements in net margin and EPS, signaling rapid operational scaling.
Which one has the stronger fundamentals?
Ouster demonstrates stronger overall income statement fundamentals with higher revenue and profitability growth rates, and a more favorable margin improvement trend despite negative profitability. Ambarella maintains higher gross margins but faces deeper net losses and weaker net income growth. Both companies remain unprofitable, yet Ouster’s faster growth and margin progress offer relatively stronger operational momentum.
Financial Ratios Comparison
The following table presents a side-by-side comparison of key financial ratios for Ambarella, Inc. (AMBA) and Ouster, Inc. (OUST) based on their most recent fiscal year data.
| Ratios | Ambarella, Inc. (2025) | Ouster, Inc. (2024) |
|---|---|---|
| ROE | -20.9% | -53.6% |
| ROIC | -22.0% | -50.8% |
| P/E | -27.1 | -5.87 |
| P/B | 5.64 | 3.15 |
| Current Ratio | 2.65 | 2.80 |
| Quick Ratio | 2.36 | 2.59 |
| D/E | 0.0094 | 0.112 |
| Debt-to-Assets | 0.76% | 7.33% |
| Interest Coverage | 0 | -57.1 |
| Asset Turnover | 0.41 | 0.40 |
| Fixed Asset Turnover | 19.96 | 4.54 |
| Payout Ratio | 0 | 0 |
| Dividend Yield | 0 | 0 |
Interpretation of the Ratios
Ambarella, Inc.
Ambarella displays several weak financial ratios, including negative net margin (-41.12%), return on equity (-20.86%), and return on invested capital (-21.96%), signaling profitability and efficiency challenges. However, liquidity ratios like current ratio (2.65) and quick ratio (2.36) are strong, and debt levels remain low. The company does not pay dividends, likely due to ongoing reinvestment in R&D and growth priorities.
Ouster, Inc.
Ouster’s financial ratios also reflect weaknesses, with an even more negative net margin (-87.35%) and return on equity (-53.64%), alongside a high weighted average cost of capital (17.7%). Liquidity remains solid, as seen in current ratio (2.8) and quick ratio (2.59), while leverage is moderate. Ouster does not distribute dividends, consistent with its reinvestment strategy in development and expansion phases.
Which one has the best ratios?
Both Ambarella and Ouster share a similar proportion of favorable (42.86%) and unfavorable (57.14%) ratios, leading to an overall unfavorable assessment for each. While both maintain good liquidity and low to moderate debt, difficulties in profitability and returns dominate their financial profiles, indicating challenges that investors should carefully consider.
Strategic Positioning
This section compares the strategic positioning of Ambarella, Inc. and Ouster, Inc. focusing on Market position, Key segments, and Exposure to technological disruption:
Ambarella, Inc.
- Operates in semiconductors with a $3.18B market cap, facing competition in video and AI processing.
- Targets automotive cameras, security, robotics, and consumer video markets with integrated AI chips.
- Exposure to disruption through AI and video processing technology integration in diverse applications.
Ouster, Inc.
- Designs digital lidar sensors in hardware sector with $1.4B market cap, competing in 3D vision tech.
- Focuses on high-resolution lidar sensors and software for vehicles, robots, and infrastructure assets.
- Faces disruption risk from advancing lidar and sensor technologies in evolving autonomous systems.
Ambarella vs Ouster Positioning
Ambarella shows a diversified approach across automotive, security, and consumer video markets with AI integration, while Ouster concentrates on lidar sensors for robotics and vehicles. Ambarella’s broad reach contrasts with Ouster’s specialized focus and smaller workforce.
Which has the best competitive advantage?
Both companies are shedding value, with Ambarella experiencing declining profitability and Ouster improving profitability despite negative ROIC. Ouster’s growing ROIC trend suggests a potentially strengthening competitive position relative to Ambarella.
Stock Comparison
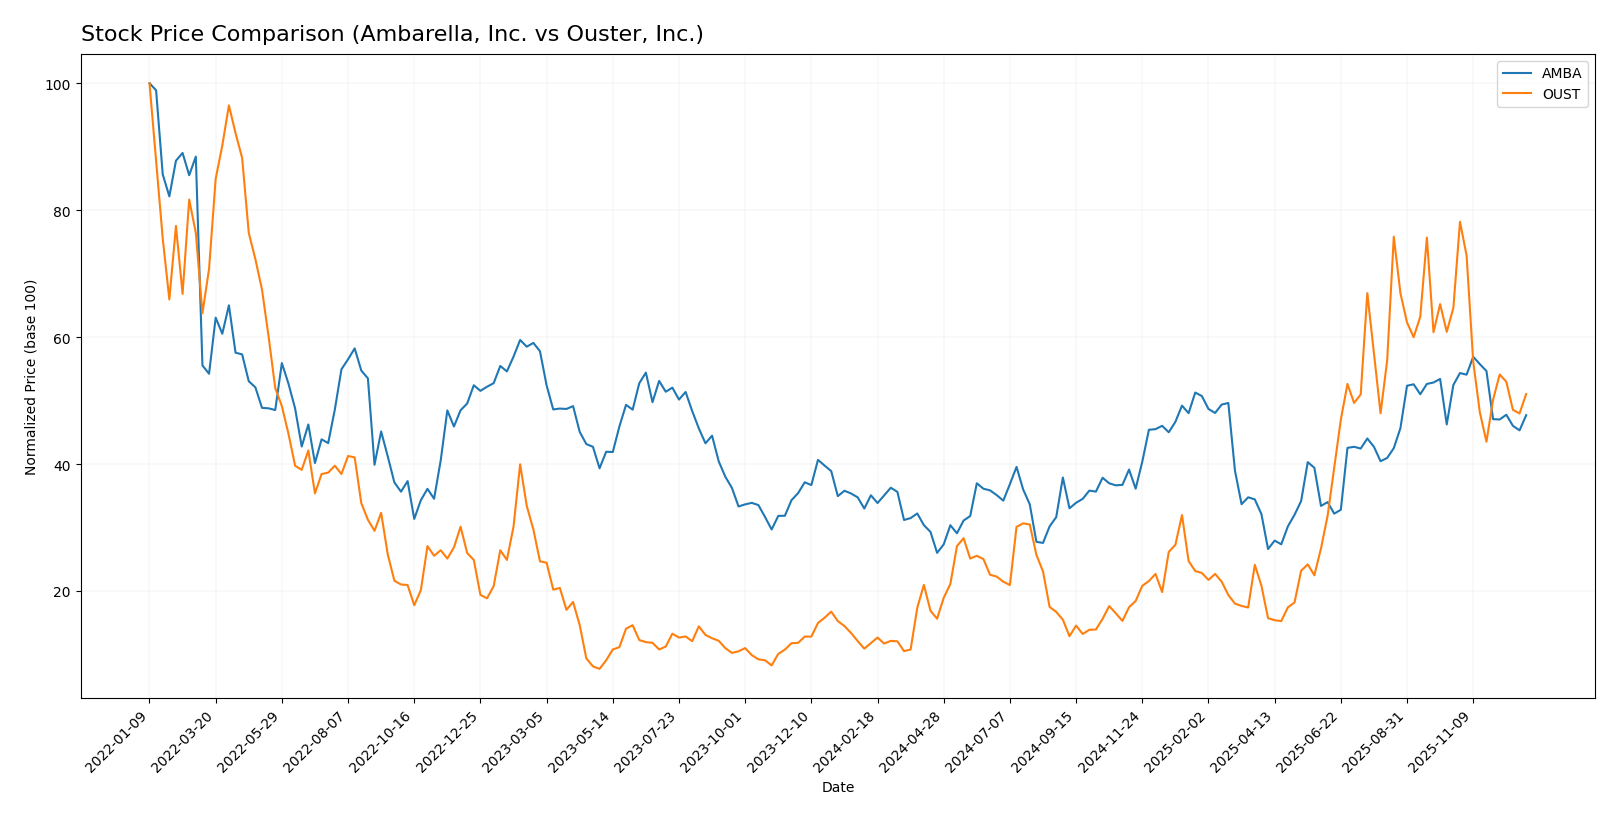
The stock prices of Ambarella, Inc. (AMBA) and Ouster, Inc. (OUST) have shown significant bullish trends over the past 12 months, with notable deceleration in growth and recent downward adjustments in both shares.
Trend Analysis
Ambarella, Inc. (AMBA) exhibited a 35.96% price increase over the past year, reflecting a bullish trend with decelerating growth. The stock ranged between 40.99 and 89.67, with recent months showing a -9.1% decline.
Ouster, Inc. (OUST) recorded a 332.78% price increase over the same period, also bullish but with deceleration. Its price fluctuated from 4.82 to 35.8, followed by a recent -20.99% decrease in value.
Comparing the two, OUST delivered the highest market performance with substantially greater gains than AMBA, despite both stocks facing negative trends in the latest quarter.
Target Prices
Analysts present a solid target price consensus for Ambarella, Inc. and Ouster, Inc.
| Company | Target High | Target Low | Consensus |
|---|---|---|---|
| Ambarella, Inc. | 115 | 80 | 97.5 |
| Ouster, Inc. | 39 | 33 | 36.67 |
The target consensus for Ambarella, Inc. at 97.5 USD is notably above its current price of 75.16 USD, indicating potential upside. Ouster, Inc.’s consensus target of 36.67 USD also suggests appreciable growth compared to its current price of 23.37 USD.
Analyst Opinions Comparison
This section compares analysts’ ratings and grades for Ambarella, Inc. and Ouster, Inc.:
Rating Comparison
AMBA Rating
- Rating: C+ indicating a very favorable overall evaluation.
- Discounted Cash Flow Score: 3, a moderate indication of valuation.
- ROE Score: 1, showing very unfavorable efficiency in generating profit.
- ROA Score: 1, indicating very unfavorable asset utilization.
- Debt To Equity Score: 4, favorable financial risk profile with low leverage.
- Overall Score: 2, a moderate summary of financial standing.
OUST Rating
- Rating: C- reflecting a very favorable overall evaluation.
- Discounted Cash Flow Score: 1, a very unfavorable valuation indicator.
- ROE Score: 1, also very unfavorable in profit generation efficiency.
- ROA Score: 1, also very unfavorable for asset utilization effectiveness.
- Debt To Equity Score: 3, showing a moderate financial risk and leverage.
- Overall Score: 1, a very unfavorable summary of financial standing.
Which one is the best rated?
Based strictly on the provided data, Ambarella, Inc. is better rated with a higher overall score, better discounted cash flow, and a more favorable debt-to-equity score compared to Ouster, Inc., despite both having poor profitability metrics.
Scores Comparison
Here is a comparison of the financial health scores for Ambarella, Inc. and Ouster, Inc.:
AMBA Scores
- Altman Z-Score: 10.88, indicating a safe zone with very low bankruptcy risk.
- Piotroski Score: 3, classified as very weak financial strength.
OUST Scores
- Altman Z-Score: 3.66, indicating a safe zone with low bankruptcy risk.
- Piotroski Score: 4, classified as average financial strength.
Which company has the best scores?
Ambarella shows a significantly higher Altman Z-Score, strongly indicating financial safety, but has a very weak Piotroski Score. Ouster holds a lower Altman Z-Score yet remains in the safe zone and has a better Piotroski Score, reflecting comparatively stronger financial health.
Grades Comparison
The following is a comparison of recent grades assigned to Ambarella, Inc. and Ouster, Inc.:
Ambarella, Inc. Grades
This table summarizes recent grades from recognized financial institutions for Ambarella, Inc.:
| Grading Company | Action | New Grade | Date |
|---|---|---|---|
| Rosenblatt | Maintain | Buy | 2025-11-26 |
| Stifel | Maintain | Buy | 2025-11-26 |
| B of A Securities | Maintain | Neutral | 2025-11-26 |
| Needham | Maintain | Buy | 2025-11-26 |
| Rosenblatt | Maintain | Buy | 2025-11-24 |
| Oppenheimer | Maintain | Perform | 2025-08-29 |
| Morgan Stanley | Maintain | Overweight | 2025-08-29 |
| Northland Capital Markets | Maintain | Outperform | 2025-08-29 |
| B of A Securities | Maintain | Neutral | 2025-08-29 |
| Stifel | Maintain | Buy | 2025-08-29 |
Ambarella’s grades mostly indicate a positive outlook with multiple “Buy” ratings and several “Neutral” and “Outperform” assessments.
Ouster, Inc. Grades
This table shows recent grades from respected financial firms for Ouster, Inc.:
| Grading Company | Action | New Grade | Date |
|---|---|---|---|
| Cantor Fitzgerald | Upgrade | Overweight | 2025-11-07 |
| Cantor Fitzgerald | Upgrade | Overweight | 2025-11-06 |
| WestPark Capital | Maintain | Buy | 2025-11-05 |
| Rosenblatt | Maintain | Buy | 2025-11-05 |
| WestPark Capital | Upgrade | Buy | 2025-08-13 |
| Oppenheimer | Maintain | Outperform | 2025-07-16 |
| WestPark Capital | Downgrade | Hold | 2025-06-12 |
| WestPark Capital | Upgrade | Buy | 2025-05-09 |
| Rosenblatt | Maintain | Buy | 2025-03-21 |
| Cantor Fitzgerald | Maintain | Overweight | 2025-03-21 |
Ouster’s recent grades reflect a generally bullish stance, with multiple upgrades to “Overweight” and “Buy,” along with sustained positive ratings like “Outperform.”
Which company has the best grades?
Both companies have received predominantly positive grades, but Ouster, Inc. shows a slightly stronger trend with several recent upgrades to “Overweight” and consistent “Buy” ratings. Ambarella, Inc. maintains solid “Buy” grades but also includes more “Neutral” ratings. This suggests Ouster may be viewed with a somewhat higher growth or performance expectation by analysts, which could influence investor sentiment accordingly.
Strengths and Weaknesses
The table below summarizes the key strengths and weaknesses of Ambarella, Inc. (AMBA) and Ouster, Inc. (OUST) based on their latest financial and operational data.
| Criterion | Ambarella, Inc. (AMBA) | Ouster, Inc. (OUST) |
|---|---|---|
| Diversification | Limited product segmentation, focused on semiconductor solutions | Moderate diversification with product revenues growing to 111M USD in 2024 |
| Profitability | Negative net margin (-41.12%), negative ROIC (-21.96%), value destroying | Deeply negative net margin (-87.35%), negative ROIC (-50.84%), but improving profitability trend |
| Innovation | High fixed asset turnover (19.96), indicating efficient asset use | Moderate fixed asset turnover (4.54), innovation growing but less asset efficient |
| Global presence | Solid liquidity (current ratio 2.65) and low debt (debt/assets 0.76%) | Strong liquidity (current ratio 2.8) but higher debt ratio (7.33%) than AMBA |
| Market Share | Declining ROIC trend and unfavorable economic moat | Slightly unfavorable moat but improving ROIC trend suggests potential market expansion |
In summary, both companies face significant profitability challenges and are currently value destroyers, with AMBA showing a steeper decline in returns while OUST has signs of improving profitability. Investors should exercise caution and monitor ongoing operational improvements before committing capital.
Risk Analysis
Below is a comparative table summarizing key risk metrics for Ambarella, Inc. (AMBA) and Ouster, Inc. (OUST) based on the most recent data available for 2025 and 2024 respectively.
| Metric | Ambarella, Inc. (AMBA) | Ouster, Inc. (OUST) |
|---|---|---|
| Market Risk (Beta) | 1.98 (High volatility) | 2.99 (Very high volatility) |
| Debt Level (D/E) | 0.01 (Very low) | 0.11 (Low) |
| Regulatory Risk | Moderate (Tech sector compliance) | Moderate (Hardware regulations) |
| Operational Risk | Moderate (Semiconductor supply chain sensitive) | Moderate (Manufacturing scale-up challenges) |
| Environmental Risk | Low (Standard industry impact) | Low (Standard industry impact) |
| Geopolitical Risk | Moderate (US-based, global sales exposure) | Moderate (US-based, global sales exposure) |
Synthesis: Both companies exhibit high market risk due to elevated betas, with Ouster showing notably higher volatility. Debt levels are low, reducing financial leverage risk. Operational risks are moderate, linked to sector-specific supply chain and manufacturing challenges. Ambarella’s negative net margins and low profitability metrics highlight significant operational pressure, while Ouster’s deeper losses and negative interest coverage signal liquidity risks. Investors should weigh high volatility and weak profitability as the most impactful risks currently.
Which Stock to Choose?
Ambarella, Inc. (AMBA) has shown favorable income growth with a 25.78% revenue increase over the last year and a strong gross margin of 60.5%. However, its profitability ratios remain unfavorable, including a negative net margin of -41.12% and declining returns on equity and invested capital. The company maintains low debt levels and a solid current ratio of 2.65 but faces challenges with value destruction indicated by its negative ROIC versus WACC. Its overall rating is moderate, despite a very favorable C+ rating.
Ouster, Inc. (OUST) reports robust revenue growth of 33.41% in the last year and a favorable gross margin of 36.42%. Profitability is weak, with a net margin of -87.35% and negative returns on equity and capital employed. The company shows moderate debt and a healthy current ratio of 2.8. It is slightly unfavorable in value creation though its ROIC trend is improving. OUST’s overall rating is moderate with a very favorable C- rating, but profitability and financial stability remain concerns.
For investors prioritizing growth potential, Ouster’s strong revenue and margin improvements and improving ROIC trend might appear attractive despite ongoing profitability challenges. Conversely, Ambarella’s more stable income growth, lower debt, and solid liquidity could be preferable for those emphasizing financial stability and quality, though its value destruction signals caution. Both stocks display unfavorable financial ratios overall, suggesting prudence in evaluation depending on risk tolerance and investment strategy.
Disclaimer: Investment carries a risk of loss of initial capital. The past performance is not a reliable indicator of future results. Be sure to understand risks before making an investment decision.
Go Further
I encourage you to read the complete analyses of Ambarella, Inc. and Ouster, Inc. to enhance your investment decisions: