Onto Innovation Inc. and Ambarella, Inc. are two prominent players in the semiconductor industry, each driving innovation in distinct yet overlapping market segments. Onto Innovation focuses on advanced process control and metrology tools, while Ambarella specializes in semiconductor solutions for video processing and AI-driven vision technologies. This comparison aims to uncover which company presents the most compelling investment opportunity in today’s evolving tech landscape. Let’s explore their strengths to guide your portfolio decisions.

Table of contents
Companies Overview
I will begin the comparison between Onto Innovation Inc. and Ambarella, Inc. by providing an overview of these two companies and their main differences.
Onto Innovation Inc. Overview
Onto Innovation Inc. focuses on designing, developing, manufacturing, and supporting process control tools for semiconductor and advanced packaging device manufacturers. Its portfolio includes macro defect inspection, 2D/3D optical metrology, lithography systems, and process control software. Founded in 1940 and based in Wilmington, Massachusetts, Onto serves various industries including silicon wafer and LED production, emphasizing yield management solutions.
Ambarella, Inc. Overview
Ambarella, Inc. develops semiconductor solutions specialized in HD and ultra HD video compression, image processing, and AI-based computer vision. Its system-on-chip products target automotive cameras, professional and home security cameras, robotics, and consumer devices like drones and wearable cameras. Headquartered in Santa Clara, California, and founded in 2004, Ambarella focuses on delivering differentiated functionality with low power consumption.
Key similarities and differences
Both Onto and Ambarella operate in the semiconductor industry, offering technology-driven solutions with a focus on innovation. Onto’s business model centers on process control and yield management tools for chip manufacturing, while Ambarella emphasizes video and AI processing chips for imaging applications across automotive and consumer markets. Each targets distinct end markets, reflecting complementary but different industry niches within semiconductors.
Income Statement Comparison
The table below compares key income statement metrics for Onto Innovation Inc. and Ambarella, Inc. based on their most recent fiscal year data.
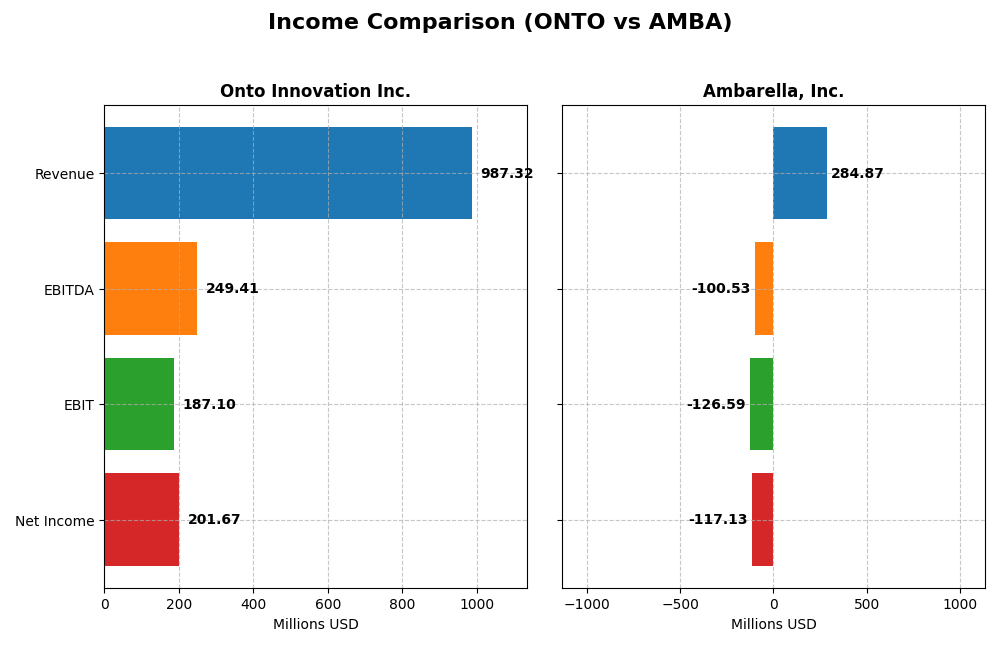
| Metric | Onto Innovation Inc. (ONTO) | Ambarella, Inc. (AMBA) |
|---|---|---|
| Market Cap | 10.7B | 2.7B |
| Revenue | 987M | 285M |
| EBITDA | 249M | -101M |
| EBIT | 187M | -127M |
| Net Income | 202M | -117M |
| EPS | 4.09 | -2.84 |
| Fiscal Year | 2024 | 2025 |
Income Statement Interpretations
Onto Innovation Inc.
Onto Innovation’s revenue grew steadily from 556M in 2020 to 987M in 2024, with net income surging from 31M to 202M. Margins remained stable and favorable, with a 52.19% gross margin and a net margin of 20.43% in 2024. The latest year showed strong growth, with net income up 37.55% and earnings per share rising 65.04%.
Ambarella, Inc.
Ambarella’s revenue increased from 223M in 2021 to 285M in 2025, but net income remained negative, deepening to -117M in 2025. The gross margin was a favorable 60.5%, yet the company reported an unfavorable EBIT margin of -44.44% and net margin of -41.12%. The most recent year showed revenue growth of 25.78% and improved net margin, though still negative.
Which one has the stronger fundamentals?
Onto Innovation demonstrates stronger fundamentals with consistent revenue and net income growth, positive and stable margins, and significant EPS improvement. Ambarella, despite revenue growth, continues to report losses and negative margins, reflecting ongoing profitability challenges. Overall, Onto Innovation’s income statement is fully favorable, contrasting with Ambarella’s mixed performance.
Financial Ratios Comparison
The table below presents a side-by-side comparison of key financial ratios for Onto Innovation Inc. and Ambarella, Inc. based on their most recent fiscal year data, facilitating an objective assessment.
| Ratios | Onto Innovation Inc. (2024) | Ambarella, Inc. (2025) |
|---|---|---|
| ROE | 10.47% | -20.86% |
| ROIC | 8.77% | -21.96% |
| P/E | 41.76 | -27.05 |
| P/B | 4.37 | 5.64 |
| Current Ratio | 8.69 | 2.65 |
| Quick Ratio | 7.00 | 2.36 |
| D/E | 0.0079 | 0.0094 |
| Debt-to-Assets | 0.72% | 0.76% |
| Interest Coverage | 0 | 0 |
| Asset Turnover | 0.47 | 0.41 |
| Fixed Asset Turnover | 7.16 | 19.96 |
| Payout ratio | 0 | 0 |
| Dividend yield | 0 | 0 |
Interpretation of the Ratios
Onto Innovation Inc.
Onto Innovation shows a balanced financial profile with a favorable net margin of 20.43% but neutral returns on equity (10.47%) and invested capital (8.77%). Concerns include an unfavorable weighted average cost of capital (10.66%), high price-to-earnings (41.76), and price-to-book (4.37) ratios. Its current ratio is notably high at 8.69, which may indicate inefficient asset use. Onto does not pay dividends, focusing likely on reinvestment and growth.
Ambarella, Inc.
Ambarella faces significant challenges with negative net margin (-41.12%) and returns on equity (-20.86%) and invested capital (-21.96%), all unfavorable. The company has a favorable price-to-earnings ratio despite a negative value, suggesting market expectations of turnaround. Liquidity ratios are sound, with current and quick ratios above 2. Debt levels are low, but interest coverage is zero, indicating financial strain. Ambarella also does not pay dividends, likely prioritizing R&D and restructuring.
Which one has the best ratios?
Onto Innovation’s ratios appear more stable with positive profitability metrics and manageable debt, despite some valuation concerns. Ambarella’s ratios reveal deeper financial distress and significant negative profitability, though liquidity is better. Overall, Onto Innovation presents a more balanced ratio profile, while Ambarella faces considerable financial headwinds.
Strategic Positioning
This section compares the strategic positioning of Onto Innovation Inc. and Ambarella, Inc. in terms of market position, key segments, and exposure to technological disruption:
Onto Innovation Inc.
- Larger market cap of 10.7B USD in semiconductors, facing typical industry competition.
- Focused on process control tools and software for semiconductor manufacturing and packaging.
- Positioned in mature semiconductor manufacturing with stable but incremental innovation.
Ambarella, Inc.
- Smaller market cap of 2.7B USD, operating in competitive semiconductor video solutions.
- Concentrated on semiconductor solutions for HD video processing and AI vision applications.
- Faces technological disruption due to rapid AI and video processing advancements.
Onto Innovation Inc. vs Ambarella, Inc. Positioning
Onto Innovation has a diversified semiconductor product portfolio targeting manufacturing processes, offering steady growth potential. Ambarella specializes in AI-driven video semiconductors, exposing it to faster innovation cycles but higher volatility. Onto’s broader base contrasts with Ambarella’s niche focus.
Which has the best competitive advantage?
Onto Innovation’s moat is slightly unfavorable but improving with growing profitability, while Ambarella faces a very unfavorable moat with declining returns, indicating Onto has a comparatively stronger competitive advantage based on recent ROIC trends.
Stock Comparison
The stock price chart highlights significant price appreciation for Onto Innovation Inc. and Ambarella, Inc. over the past year, with Onto showing marked acceleration while Ambarella’s gains decelerate amid recent volatility.
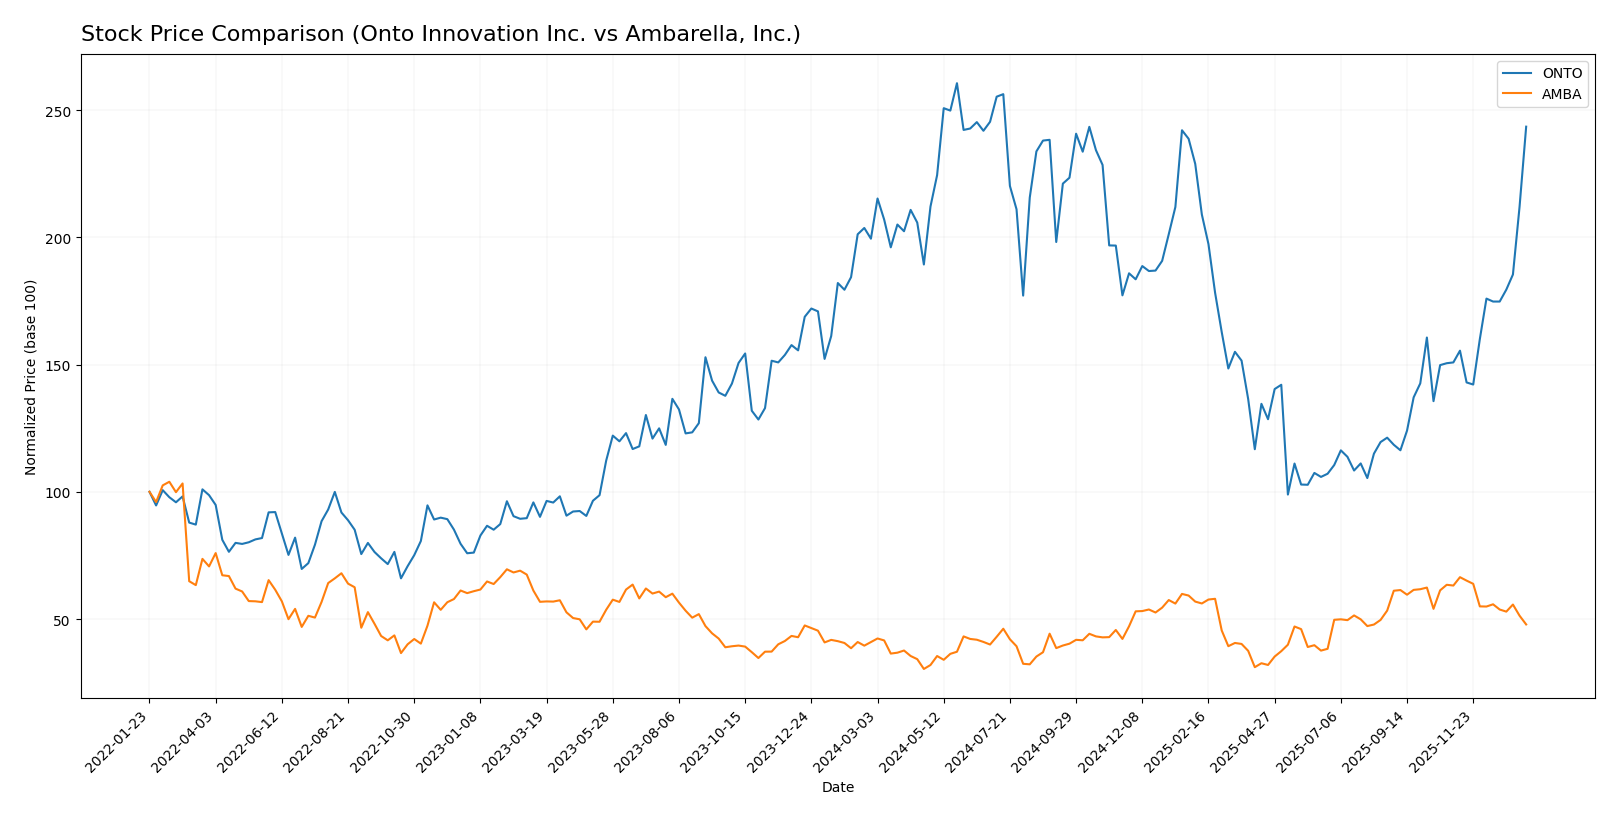
Trend Analysis
Onto Innovation Inc. experienced a bullish trend over the past 12 months with a 22.07% price increase, showing acceleration and high volatility, reaching a high of 233.14 and a low of 88.5.
Ambarella, Inc. also posted a bullish trend with a 16.9% price gain over the year, but its trend decelerated recently, accompanied by lower volatility and a high of 89.67 and a low of 40.99.
Comparing the two, Onto Innovation Inc. delivered the highest market performance with stronger gains and accelerating momentum relative to Ambarella, Inc.
Target Prices
The current analyst consensus reveals moderate upside potential for both Onto Innovation Inc. and Ambarella, Inc.
| Company | Target High | Target Low | Consensus |
|---|---|---|---|
| Onto Innovation Inc. | 200 | 160 | 178 |
| Ambarella, Inc. | 115 | 80 | 97.5 |
Analysts expect Onto Innovation’s price to settle below its current trading level of 217.85 USD, suggesting some overvaluation. Ambarella’s consensus target of 97.5 USD indicates a significant potential appreciation from its current 64.6 USD price.
Analyst Opinions Comparison
This section compares analysts’ ratings and financial scores for Onto Innovation Inc. and Ambarella, Inc.:
Rating Comparison
ONTO Rating
- Rating: B+, classified as Very Favorable overall.
- Discounted Cash Flow Score: 3, indicating moderate value.
- Return on Equity Score: 3, a moderate efficiency rating.
- Return on Assets Score: 4, a favorable asset utilization.
- Debt To Equity Score: 4, showing favorable financial risk.
- Overall Score: 3, reflecting moderate financial standing.
AMBA Rating
- Rating: C+, classified as Very Favorable overall.
- Discounted Cash Flow Score: 3, indicating moderate value.
- Return on Equity Score: 1, indicating very unfavorable efficiency.
- Return on Assets Score: 1, a very unfavorable asset utilization.
- Debt To Equity Score: 4, showing favorable financial risk.
- Overall Score: 2, reflecting moderate financial standing.
Which one is the best rated?
Based strictly on the provided data, Onto Innovation Inc. holds a higher overall rating (B+) and stronger scores in ROE and ROA compared to Ambarella, Inc., which has a lower rating (C+) and significantly weaker profitability metrics.
Scores Comparison
Here is a comparison of the financial scores for Onto Innovation Inc. and Ambarella, Inc.:
ONTO Scores
- Altman Z-Score: 34.16, indicating a safe zone with very low bankruptcy risk.
- Piotroski Score: 4, reflecting average financial strength.
AMBA Scores
- Altman Z-Score: 10.69, indicating a safe zone with low bankruptcy risk.
- Piotroski Score: 3, reflecting very weak financial strength.
Which company has the best scores?
Based on the provided data, Onto Innovation has a higher Altman Z-Score and a better Piotroski Score than Ambarella, indicating relatively stronger financial health in both measures.
Grades Comparison
Here is the grades comparison for Onto Innovation Inc. and Ambarella, Inc.:
Onto Innovation Inc. Grades
This table summarizes recent grades and actions from recognized grading companies for Onto Innovation Inc.
| Grading Company | Action | New Grade | Date |
|---|---|---|---|
| Stifel | Maintain | Hold | 2026-01-14 |
| Needham | Maintain | Buy | 2026-01-06 |
| Jefferies | Maintain | Buy | 2025-12-15 |
| B. Riley Securities | Maintain | Buy | 2025-11-18 |
| Needham | Maintain | Buy | 2025-11-18 |
| Evercore ISI Group | Maintain | Outperform | 2025-11-05 |
| Oppenheimer | Maintain | Outperform | 2025-10-14 |
| Stifel | Maintain | Hold | 2025-10-13 |
| B. Riley Securities | Maintain | Buy | 2025-10-10 |
| Jefferies | Upgrade | Buy | 2025-09-23 |
Onto Innovation’s grades mostly reflect a buy consensus with some hold ratings, showing stable confidence from major analysts.
Ambarella, Inc. Grades
This table presents recent grades and actions from established grading companies for Ambarella, Inc.
| Grading Company | Action | New Grade | Date |
|---|---|---|---|
| B of A Securities | Maintain | Neutral | 2025-11-26 |
| Needham | Maintain | Buy | 2025-11-26 |
| Stifel | Maintain | Buy | 2025-11-26 |
| Rosenblatt | Maintain | Buy | 2025-11-26 |
| Rosenblatt | Maintain | Buy | 2025-11-24 |
| Stifel | Maintain | Buy | 2025-08-29 |
| Needham | Maintain | Buy | 2025-08-29 |
| Northland Capital Markets | Maintain | Outperform | 2025-08-29 |
| Morgan Stanley | Maintain | Overweight | 2025-08-29 |
| Oppenheimer | Maintain | Perform | 2025-08-29 |
Ambarella’s grades show a broad buy consensus with some neutral and outperform ratings, indicating mixed but generally positive analyst sentiment.
Which company has the best grades?
Both Onto Innovation Inc. and Ambarella, Inc. have buy consensus ratings. Onto Innovation shows more consistent buy and outperform grades, while Ambarella has a wider spread including neutral and perform ratings. Investors might interpret Onto’s steadier buy trend as stronger analyst confidence.
Strengths and Weaknesses
Below is a comparison table highlighting the strengths and weaknesses of Onto Innovation Inc. (ONTO) and Ambarella, Inc. (AMBA) based on recent financial and strategic data.
| Criterion | Onto Innovation Inc. (ONTO) | Ambarella, Inc. (AMBA) |
|---|---|---|
| Diversification | High diversification with strong Systems and Software revenue (765.8M in 2024) plus Parts and Service segments | Less diversified, mostly focused on semiconductor and software solutions |
| Profitability | Positive net margin (20.43%), ROIC (8.77%) near WACC (10.66%), slight value destruction but improving | Negative net margin (-41.12%), declining ROIC (-21.96%), significant value destruction |
| Innovation | Growing ROIC trend (+344%), indicating improving operational efficiency and innovation | Declining ROIC trend (-81%), signaling weakening innovation and competitive position |
| Global presence | Strong global presence supported by diversified product lines and services | Moderate global reach but challenged by recent financial performance |
| Market Share | Solid market share in semiconductor equipment and software | Facing market share pressure due to financial and profitability challenges |
Key takeaways: Onto Innovation shows promising growth and diversification with improving profitability metrics despite current slight value destruction. Conversely, Ambarella faces significant profitability declines and weakening competitive advantages, signaling higher risk for investors.
Risk Analysis
Below is a comparative table highlighting key risk factors for Onto Innovation Inc. (ONTO) and Ambarella, Inc. (AMBA) based on the most recent data from 2025-2026:
| Metric | Onto Innovation Inc. (ONTO) | Ambarella, Inc. (AMBA) |
|---|---|---|
| Market Risk | Moderate (Beta 1.46) | High (Beta 1.95) |
| Debt level | Very low (D/E 0.01) | Very low (D/E 0.01) |
| Regulatory Risk | Moderate (Semiconductor sector compliance) | Moderate (Semiconductor & AI applications) |
| Operational Risk | Moderate (Complex manufacturing) | Moderate to High (AI and automotive reliance) |
| Environmental Risk | Low (Manufacturing impact controlled) | Low to Moderate (Energy use in chip production) |
| Geopolitical Risk | Moderate (US-based, global supply chain) | Moderate (US-based, global supply chain) |
In synthesis, Ambarella faces higher market risk due to its elevated beta and significant operational risks tied to AI and automotive tech sectors, compounded by weak profitability and financial health indicators. Onto Innovation, despite a moderate market risk, demonstrates stronger financial stability and lower leverage, reducing its risk profile substantially. Investors should weigh Ambarella’s high volatility and operational challenges against Onto’s more balanced risk-return profile.
Which Stock to Choose?
Onto Innovation Inc. (ONTO) shows a favorable income evolution with a 21.01% revenue growth in the last year and strong profitability indicated by a 20.43% net margin. Financial ratios reveal a balanced profile with 42.86% favorable and unfavorable ratios each, a very low debt level, and a solid rating of B+. Despite a slightly unfavorable moat due to ROIC below WACC, its profitability trend is positive.
Ambarella, Inc. (AMBA) presents mixed income results, with a favorable revenue growth of 25.78% but an unfavorable net margin of -41.12%. The company’s financial ratios lean toward unfavorable, with 57.14% negative metrics, including negative returns and interest coverage concerns. Its rating stands at C+, reflecting financial challenges, and the moat evaluation is very unfavorable, showing declining profitability and value destruction.
Investors focused on growth and improving profitability might find ONTO’s consistent income improvements and stable rating suggestive of potential, while those with tolerance for volatility might interpret AMBA’s high revenue growth but financial weakness as a riskier profile. The choice could depend on whether one prioritizes stable financial health or is willing to consider higher risk for possible turnaround opportunities.
Disclaimer: Investment carries a risk of loss of initial capital. The past performance is not a reliable indicator of future results. Be sure to understand risks before making an investment decision.
Go Further
I encourage you to read the complete analyses of Onto Innovation Inc. and Ambarella, Inc. to enhance your investment decisions: