NVIDIA Corporation and Ambarella, Inc. stand at the forefront of the semiconductor industry, each driving innovation in high-performance computing and video processing technologies. While NVIDIA leads with expansive AI, gaming, and data center solutions, Ambarella specializes in advanced video compression and intelligent vision chips for automotive and security sectors. This article will analyze both companies to help you decide which presents the most compelling investment opportunity in 2026.

Table of contents
Companies Overview
I will begin the comparison between NVIDIA and Ambarella by providing an overview of these two companies and their main differences.
NVIDIA Overview
NVIDIA Corporation is a leading technology company specializing in graphics, compute, and networking solutions globally. Its product portfolio spans GeForce GPUs for gaming, professional visualization with Quadro GPUs, data center AI platforms, and automotive AI systems. Headquartered in Santa Clara, California, NVIDIA serves diverse markets including gaming, data centers, and automotive, leveraging strategic collaborations and a strong innovation focus since its 1993 inception.
Ambarella Overview
Ambarella, Inc. develops semiconductor solutions focused on video processing, image quality, and AI computer vision algorithms. Its system-on-a-chip designs support applications such as automotive cameras, security systems, robotics, and consumer electronics. Founded in 2004 and based in Santa Clara, Ambarella targets markets emphasizing video compression and deep neural network processing, serving original design and equipment manufacturers worldwide.
Key similarities and differences
Both NVIDIA and Ambarella operate in the semiconductor industry with headquarters in Santa Clara, California, focusing on technology enabling advanced video and AI applications. NVIDIA has a broader market reach including gaming, data centers, and automotive sectors, while Ambarella concentrates on video-centric solutions for automotive, security, and consumer markets. NVIDIA’s scale and diversified product segments contrast with Ambarella’s specialized chip designs for video and computer vision.
Income Statement Comparison
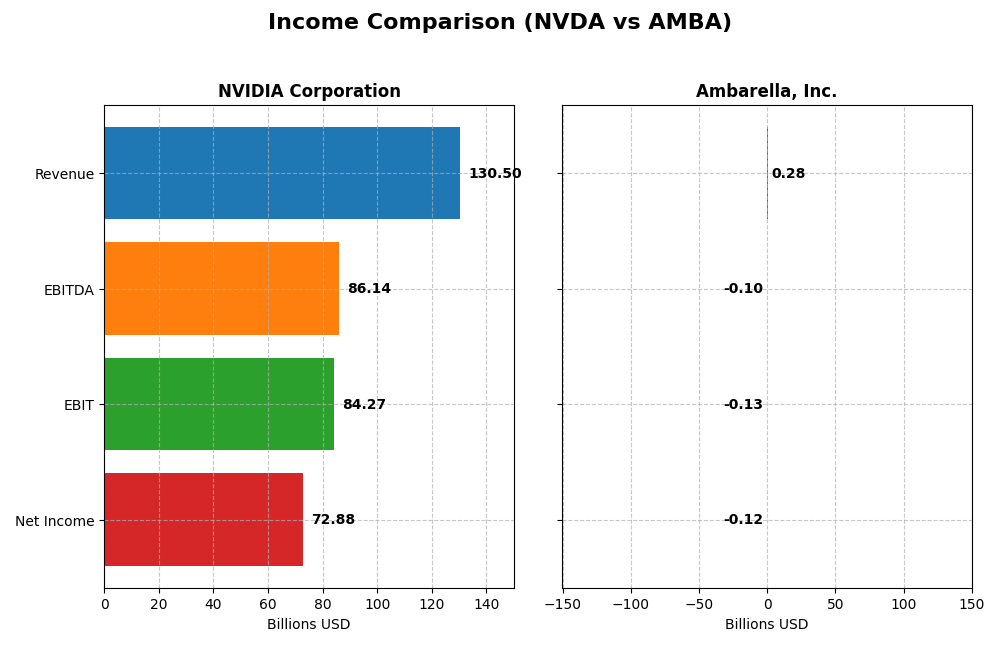
This table presents a side-by-side comparison of key income statement metrics for NVIDIA Corporation and Ambarella, Inc. for their most recent fiscal year, 2025.
| Metric | NVIDIA Corporation | Ambarella, Inc. |
|---|---|---|
| Market Cap | 4.46T | 2.75B |
| Revenue | 130.5B | 285M |
| EBITDA | 86.1B | -101M |
| EBIT | 84.3B | -127M |
| Net Income | 72.9B | -117M |
| EPS | 2.97 | -2.84 |
| Fiscal Year | 2025 | 2025 |
Income Statement Interpretations
NVIDIA Corporation
NVIDIA’s revenue and net income have shown strong growth from 2021 to 2025, with revenue rising from $16.7B to $130.5B and net income from $4.3B to $72.9B. Margins have improved markedly, with a gross margin near 75% and net margin above 55%. The latest fiscal year saw revenue more than double and net income increase by over 140%, reflecting robust operational efficiency and margin expansion.
Ambarella, Inc.
Ambarella’s revenue grew modestly from $223M in 2021 to $285M in 2025, but net income remained negative, with a loss widening from $60M to $117M. Gross margin stayed favorable near 60%, yet EBIT and net margins remain deeply negative, indicating persistent operating losses. The most recent year showed a 26% revenue increase and some net margin improvement, though profitability challenges persist.
Which one has the stronger fundamentals?
NVIDIA demonstrates significantly stronger fundamentals with substantial revenue and net income growth, high and expanding margins, and favorable interest and operating expense ratios. Ambarella, while showing some revenue growth and gross margin stability, continues to report operating losses and negative net margins, reflecting weaker profitability and financial health compared to NVIDIA.
Financial Ratios Comparison
The table below presents a side-by-side comparison of key financial ratios for NVIDIA Corporation and Ambarella, Inc. based on their most recent fiscal year data.
| Ratios | NVIDIA Corporation (2025) | Ambarella, Inc. (2025) |
|---|---|---|
| ROE | 91.87% | -20.86% |
| ROIC | 75.28% | -21.96% |
| P/E | 39.90 | -27.05 |
| P/B | 36.66 | 5.64 |
| Current Ratio | 4.44 | 2.65 |
| Quick Ratio | 3.88 | 2.36 |
| D/E (Debt-to-Equity) | 0.13 | 0.009 |
| Debt-to-Assets | 9.20% | 0.76% |
| Interest Coverage | 329.77 | 0 |
| Asset Turnover | 1.17 | 0.41 |
| Fixed Asset Turnover | 16.16 | 19.96 |
| Payout Ratio | 1.14% | 0 |
| Dividend Yield | 0.029% | 0 |
Interpretation of the Ratios
NVIDIA Corporation
NVIDIA shows predominantly strong financial ratios with a net margin of 55.85%, ROE at 91.87%, and ROIC of 75.28%, indicating high profitability and efficient capital use. However, high valuation multiples like a PE of 39.9 and PB of 36.66, alongside an elevated current ratio of 4.44, raise some caution. The company pays a modest dividend with a yield of 0.03%, reflecting a cautious payout policy supported by substantial free cash flow and balanced buybacks.
Ambarella, Inc.
Ambarella exhibits weak financial ratios, including a negative net margin of -41.12%, ROE of -20.86%, and ROIC at -21.96%, signaling losses and inefficiencies. Its debt and liquidity ratios are favorable, but interest coverage of zero and a low asset turnover of 0.41 are concerning. The company does not pay dividends, likely due to negative earnings and a strategic focus on R&D and growth investments.
Which one has the best ratios?
Comparing both, NVIDIA demonstrates a significantly stronger financial profile with mostly favorable profitability, leverage, and efficiency ratios, despite some valuation concerns. Conversely, Ambarella’s ratios reflect ongoing operational and profitability challenges, leading to an unfavorable overall assessment. Therefore, NVIDIA clearly has the more robust set of financial ratios.
Strategic Positioning
This section compares the strategic positioning of NVIDIA Corporation and Ambarella, Inc., including market position, key segments, and exposure to technological disruption:
NVIDIA Corporation
- Dominant market cap of $4.46T with strong competitive pressure in semiconductors
- Diversified segments: Data Center $115B, Gaming $11.35B, Automotive $1.69B, plus professional visualization and OEM
- Exposure through AI, HPC, cloud, autonomous vehicle platforms, gaming, and 3D virtual worlds software
Ambarella, Inc.
- Smaller market cap of $2.75B, facing competitive pressure in niche video semiconductor market
- Focused on semiconductor solutions for video in automotive cameras, security, robotics, and consumer applications
- Exposure mainly through AI computer vision, video compression, and image processing on single-chip solutions
NVIDIA Corporation vs Ambarella, Inc. Positioning
NVIDIA exhibits a highly diversified portfolio across multiple high-growth segments, including data centers and gaming, while Ambarella concentrates on video semiconductor solutions with narrower application areas. NVIDIA’s scale offers broad market reach; Ambarella’s focus targets specific video-related technologies but with less diversification.
Which has the best competitive advantage?
NVIDIA holds a very favorable moat with a growing ROIC far exceeding WACC, indicating durable competitive advantage and value creation. Ambarella shows a very unfavorable moat, with declining ROIC below WACC, reflecting value destruction and weaker competitive positioning.
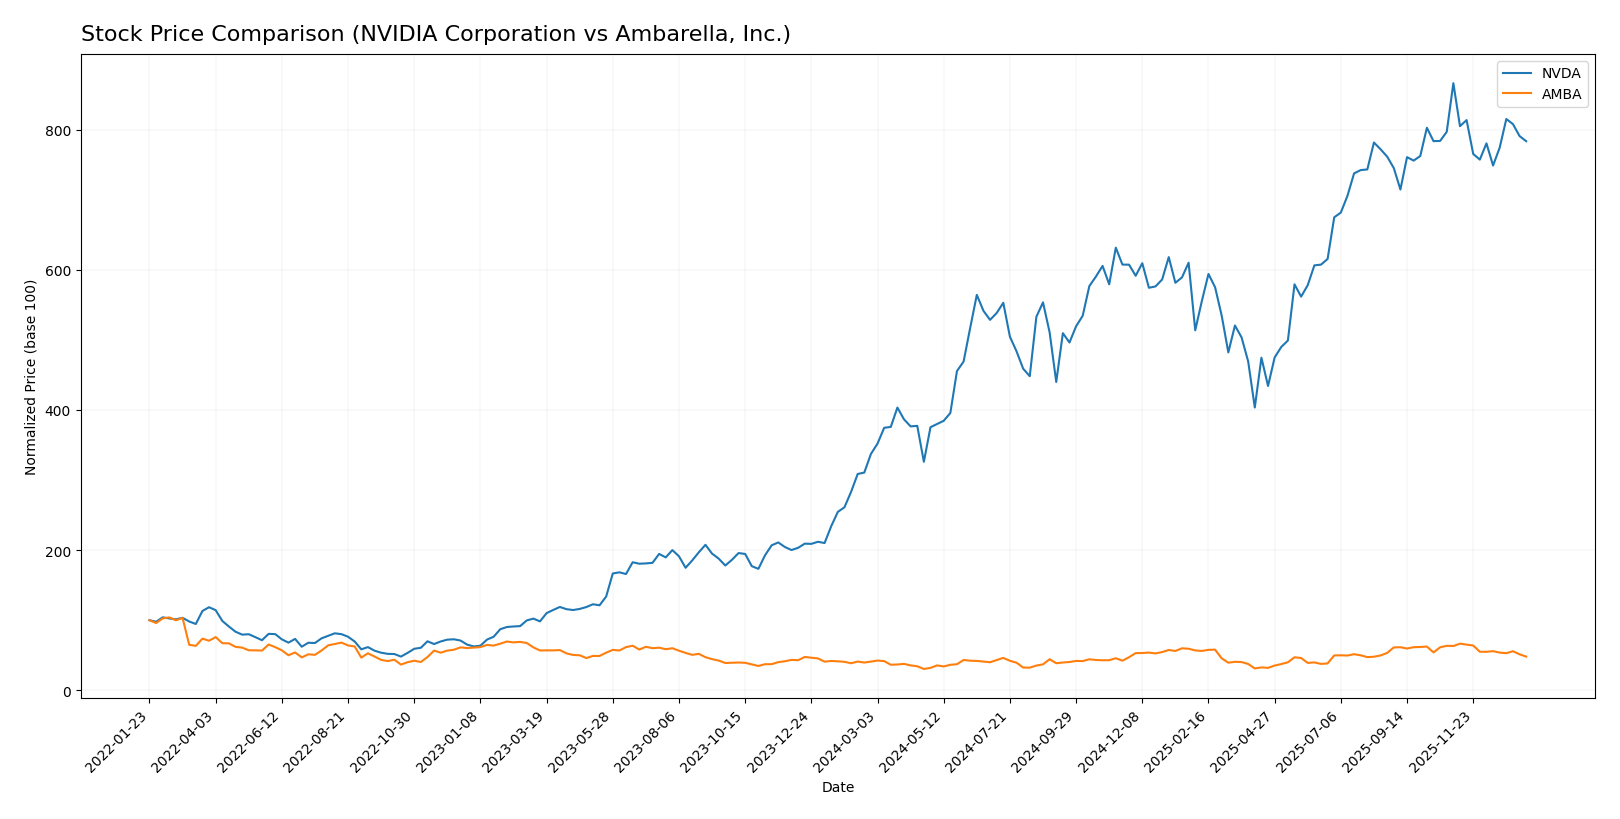
Stock Comparison
The stock price movements of NVIDIA Corporation and Ambarella, Inc. over the past 12 months reveal strong bullish trends with notable deceleration in momentum and recent downward corrections.
Trend Analysis
NVIDIA Corporation’s stock rose by 132.35% over the past year, indicating a bullish trend with decelerating acceleration and a high volatility level (std deviation 32.46). The recent period shows a 9.56% decline, reflecting a short-term bearish correction.
Ambarella, Inc. experienced a 17.26% price increase in the last 12 months, maintaining a bullish trend with deceleration and moderate volatility (std deviation 12.81). However, recent weeks indicate a sharper 23.97% drop, suggesting a pronounced short-term bearish trend.
Comparing both, NVIDIA delivered the highest market performance with a significantly greater price increase over the past year, despite recent corrections affecting both stocks.
Target Prices
Analysts present a broad but optimistic consensus on target prices for NVIDIA Corporation and Ambarella, Inc.
| Company | Target High | Target Low | Consensus |
|---|---|---|---|
| NVIDIA Corporation | 352 | 140 | 264.34 |
| Ambarella, Inc. | 115 | 80 | 97.5 |
The consensus target prices for NVIDIA and Ambarella significantly exceed their current stock prices of 183.14 and 64.8, respectively, indicating analysts expect notable upside potential for both semiconductor companies.
Analyst Opinions Comparison
This section compares analysts’ ratings and grades for NVIDIA Corporation and Ambarella, Inc.:
Rating Comparison
NVIDIA Corporation Rating
- Rating: B+, classified as Very Favorable by analysts.
- Discounted Cash Flow Score: 3, indicating a moderate valuation.
- ROE Score: 5, reflecting very favorable profitability.
- ROA Score: 5, indicating very efficient asset use.
- Debt To Equity Score: 3, a moderate financial risk profile.
- Overall Score: 3, representing a moderate overall standing.
Ambarella, Inc. Rating
- Rating: C+, also classified as Very Favorable by analysts.
- Discounted Cash Flow Score: 3, similarly moderate valuation.
- ROE Score: 1, showing very unfavorable profitability.
- ROA Score: 1, indicating very unfavorable asset efficiency.
- Debt To Equity Score: 4, considered favorable for risk level.
- Overall Score: 2, indicating a moderate but lower standing.
Which one is the best rated?
NVIDIA is better rated overall, with a higher rating (B+ vs. C+) and stronger profitability scores (ROE and ROA at 5 vs. 1). Ambarella’s debt profile is more favorable, but its overall and profitability scores lag behind.
Scores Comparison
Here is a comparison of the Altman Z-Score and the Piotroski Score for NVIDIA and Ambarella:
NVIDIA Scores
- Altman Z-Score: 68.04, indicating a safe financial zone with very low bankruptcy risk.
- Piotroski Score: 6, representing average financial strength and investment quality.
Ambarella Scores
- Altman Z-Score: 10.69, also in the safe zone, showing low bankruptcy risk.
- Piotroski Score: 3, categorized as very weak financial strength.
Which company has the best scores?
NVIDIA shows a much higher Altman Z-Score and a stronger Piotroski Score compared to Ambarella. While both are safe from bankruptcy, NVIDIA demonstrates better overall financial health based on these scores.
Grades Comparison
Here is a detailed comparison of the latest grades assigned to NVIDIA Corporation and Ambarella, Inc.:
NVIDIA Corporation Grades
The table below summarizes recent grades assigned to NVIDIA by reputable grading companies.
| Grading Company | Action | New Grade | Date |
|---|---|---|---|
| Mizuho | Maintain | Outperform | 2026-01-09 |
| Truist Securities | Maintain | Buy | 2025-12-29 |
| Stifel | Maintain | Buy | 2025-12-29 |
| B of A Securities | Maintain | Buy | 2025-12-26 |
| Baird | Maintain | Outperform | 2025-12-26 |
| Bernstein | Maintain | Outperform | 2025-12-26 |
| Truist Securities | Maintain | Buy | 2025-12-19 |
| Tigress Financial | Maintain | Strong Buy | 2025-12-18 |
| Morgan Stanley | Maintain | Overweight | 2025-12-01 |
| Deutsche Bank | Maintain | Hold | 2025-11-20 |
Grades for NVIDIA generally cluster around Buy and Outperform, with one Strong Buy and one Hold, reflecting an overall positive sentiment.
Ambarella, Inc. Grades
The table below presents recent grades assigned to Ambarella by verified grading companies.
| Grading Company | Action | New Grade | Date |
|---|---|---|---|
| B of A Securities | Maintain | Neutral | 2025-11-26 |
| Needham | Maintain | Buy | 2025-11-26 |
| Stifel | Maintain | Buy | 2025-11-26 |
| Rosenblatt | Maintain | Buy | 2025-11-26 |
| Rosenblatt | Maintain | Buy | 2025-11-24 |
| Stifel | Maintain | Buy | 2025-08-29 |
| Needham | Maintain | Buy | 2025-08-29 |
| Northland Capital Markets | Maintain | Outperform | 2025-08-29 |
| Morgan Stanley | Maintain | Overweight | 2025-08-29 |
| Oppenheimer | Maintain | Perform | 2025-08-29 |
Ambarella’s grades are mostly Buy with some Outperform and Overweight ratings, alongside a Neutral and a Perform, showing moderately positive but less uniform sentiment.
Which company has the best grades?
NVIDIA has received a higher concentration of strong Buy and Outperform grades compared to Ambarella, which shows more Buy and Neutral ratings. This difference suggests NVIDIA is viewed more favorably by analysts, potentially influencing investor confidence and portfolio decisions.
Strengths and Weaknesses
Below is a comparative summary of the key strengths and weaknesses of NVIDIA Corporation and Ambarella, Inc. based on recent financial and strategic data.
| Criterion | NVIDIA Corporation | Ambarella, Inc. |
|---|---|---|
| Diversification | Highly diversified with strong segments in Data Center ($115B) and Gaming ($11.35B) | Less diversified, smaller scale with focus on specific semiconductor markets |
| Profitability | Very high net margin (55.85%), ROIC (75.28%) and ROE (91.87%) | Negative net margin (-41.12%), ROIC (-21.96%) and ROE (-20.86%) indicates losses |
| Innovation | Strong innovation with rapidly growing ROIC and competitive moat | Declining ROIC trend shows weakening innovation impact |
| Global presence | Large global footprint with dominant market share in GPUs and Data Center tech | Smaller global presence, niche markets |
| Market Share | Market leader in GPUs and AI chips, expanding in automotive and professional visualization | Limited market share, struggling to maintain competitive edge |
NVIDIA exhibits robust diversification, strong profitability, and a durable competitive advantage, making it a favorable investment with growing returns. Ambarella shows significant weaknesses in profitability and innovation, indicating high risk and value erosion. Caution is advised with Ambarella, while NVIDIA remains a solid candidate for portfolio inclusion.
Risk Analysis
Below is a comparative overview of key risk factors for NVIDIA Corporation (NVDA) and Ambarella, Inc. (AMBA) based on the most recent data from 2025.
| Metric | NVIDIA Corporation (NVDA) | Ambarella, Inc. (AMBA) |
|---|---|---|
| Market Risk | High beta (2.31) indicates volatility; large market cap (4.46T) provides some stability. | Beta 1.95 suggests moderate volatility; smaller market cap (2.75B) increases exposure to market swings. |
| Debt Level | Low debt-to-equity (0.13) and debt-to-assets (9.2%) indicate strong balance sheet. | Very low debt-to-equity (0.01) and debt-to-assets (0.76%) but weak interest coverage (0). |
| Regulatory Risk | Moderate, given global operations and technology sector scrutiny. | Moderate, similarly exposed to semiconductor industry regulations. |
| Operational Risk | Large employee base (36K) and broad product lines may complicate operations but enhance resilience. | Smaller workforce (941) increases operational risks with less diversification. |
| Environmental Risk | Exposure in manufacturing and supply chain; industry moving toward sustainability. | Similar manufacturing risks but on a smaller scale. |
| Geopolitical Risk | Significant exposure due to global supply chain and markets, especially Taiwan and China. | Also exposed but less globally diversified, potentially more vulnerable to regional disruptions. |
The most likely and impactful risks center on market volatility and geopolitical tensions affecting supply chains, particularly for NVIDIA with its global footprint. NVIDIA’s strong financial health mitigates debt risks, while Ambarella faces operational and profitability challenges, highlighted by negative margins and weak interest coverage in 2025. Investors should watch geopolitical developments closely and consider each company’s financial resilience.
Which Stock to Choose?
NVIDIA Corporation (NVDA) shows a strong income evolution with a 682.59% revenue growth over five years and a 1582.36% net income rise, supported by favorable profitability and a very low net debt to EBITDA ratio. Its financial ratios are mostly favorable, with a 91.87% ROE and 75.28% ROIC, despite some high valuation multiples. The company’s debt profile is solid with low leverage and excellent interest coverage, resulting in a very favorable overall rating.
Ambarella, Inc. (AMBA) presents moderate revenue growth of 27.75% over five years but suffers from negative net income growth (-95.91%) and profitability challenges, reflected in a negative net margin and returns. Its financial ratios are predominantly unfavorable, including a negative ROE and ROIC, though it maintains low debt levels. The rating remains moderate with concerns over value creation and profitability, indicating financial strain.
Investors focused on growth and strong profitability might find NVIDIA’s robust income growth, solid financial ratios, and very favorable rating indicative of a durable competitive advantage. Conversely, those with a higher risk tolerance or seeking potential turnaround situations could see Ambarella’s improving revenue but unfavorable profitability and rating as a more speculative profile.
Disclaimer: Investment carries a risk of loss of initial capital. The past performance is not a reliable indicator of future results. Be sure to understand risks before making an investment decision.
Go Further
I encourage you to read the complete analyses of NVIDIA Corporation and Ambarella, Inc. to enhance your investment decisions: