Home > Comparison > Technology > AMBA vs NVEC
The strategic rivalry between Ambarella, Inc. and NVE Corporation defines innovation in the semiconductor sector. Ambarella operates as a capital-intensive chip designer focused on video processing and AI integration. In contrast, NVE Corporation pioneers spintronic nanotechnology with a leaner operational model targeting niche industrial and medical markets. This analysis evaluates which company delivers superior risk-adjusted returns amid evolving technology demands, guiding portfolio allocation in a dynamic sector landscape.
Table of contents
Companies Overview
Ambarella and NVE Corporation both shape the semiconductor sector with innovative technologies and niche applications.
Ambarella, Inc.: Leader in Video Semiconductor Solutions
Ambarella dominates the semiconductor market for video processing. It generates revenue through system-on-a-chip designs that integrate HD video compression, AI vision, and image processing. In 2026, it focuses on automotive cameras and autonomous vehicle systems, leveraging low power consumption and superior video quality as its competitive edge.
NVE Corporation: Pioneer in Spintronic Sensor Technology
NVE Corporation specializes in spintronic devices for industrial and medical applications. Its core revenue comes from sensors and couplers used in factory automation and IoT markets. The company’s 2026 strategy emphasizes custom medical sensors and licensing spintronic memory technology, targeting niche segments with high technical barriers.
Strategic Collision: Similarities & Divergences
Ambarella and NVE share a commitment to semiconductor innovation but diverge in approach. Ambarella pursues an integrated, high-volume video chip market, while NVE targets specialized spintronic sensors with a smaller workforce. Their main battleground lies in advanced sensor technologies, yet their investment profiles differ sharply: Ambarella scales broadly; NVE focuses on niche, high-margin innovation.
Income Statement Comparison
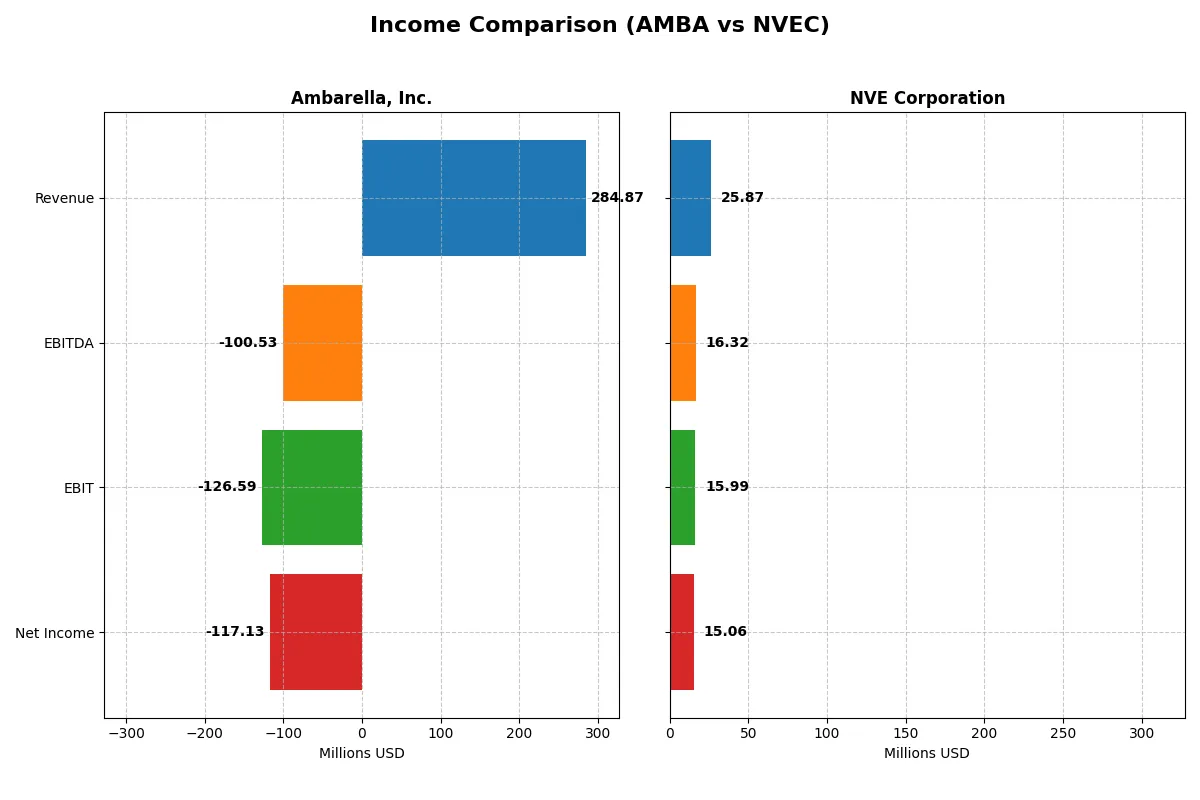
This data dissects the core profitability and scalability of both corporate engines to reveal who dominates the bottom line:
| Metric | Ambarella, Inc. (AMBA) | NVE Corporation (NVEC) |
|---|---|---|
| Revenue | 285M | 26M |
| Cost of Revenue | 113M | 4.2M |
| Operating Expenses | 299M | 5.6M |
| Gross Profit | 172M | 22M |
| EBITDA | -101M | 16M |
| EBIT | -127M | 16M |
| Interest Expense | 0 | 0 |
| Net Income | -117M | 15M |
| EPS | -2.84 | 3.12 |
| Fiscal Year | 2025 | 2025 |
Income Statement Analysis: The Bottom-Line Duel
This income statement comparison reveals which company leverages its revenue into profitable growth most effectively through operational efficiency.
Ambarella, Inc. Analysis
Ambarella’s revenue grew 25.8% in 2025 to $285M, yet it remains deeply unprofitable with a net loss of $117M. Its gross margin holds strong at 60.5%, but negative EBIT and net margins near -44% and -41% expose ongoing operational challenges. Recent margin improvement signals some momentum but losses persist.
NVE Corporation Analysis
NVE’s 2025 revenue slipped 13.2% to $26M, but it sustains robust profitability with a net income of $15M and a stellar 58.2% net margin. Gross margin exceeds 83%, while EBIT margin of 62% confirms efficient cost structure. Despite recent revenue decline, NVE’s margins demonstrate strong operational discipline.
Margin Power vs. Revenue Scale
Ambarella shows top-line growth but enduring losses undermine its financial health. NVE posts slower revenue growth but delivers consistent, high margins and profits. NVE’s superior margin efficiency and positive earnings establish it as the fundamental winner, appealing more to investors seeking operational strength and profitability.
Financial Ratios Comparison
These vital ratios act as a diagnostic tool to expose the underlying fiscal health, valuation premiums, and capital efficiency of the companies compared below:
| Ratios | Ambarella, Inc. (AMBA) | NVE Corporation (NVEC) |
|---|---|---|
| ROE | -20.9% | 24.2% |
| ROIC | -21.9% | 21.1% |
| P/E | -27.1 | 20.5 |
| P/B | 5.64 | 4.95 |
| Current Ratio | 2.65 | 28.4 |
| Quick Ratio | 2.36 | 22.0 |
| D/E (Debt to Equity) | 0.0094 | 0.0148 |
| Debt-to-Assets | 0.0076 | 0.0143 |
| Interest Coverage | 0 | 0 |
| Asset Turnover | 0.41 | 0.40 |
| Fixed Asset Turnover | 20.0 | 8.91 |
| Payout ratio | 0 | 128% |
| Dividend yield | 0% | 6.28% |
| Fiscal Year | 2025 | 2025 |
Efficiency & Valuation Duel: The Vital Signs
Ratios act as a company’s DNA, exposing hidden risks and operational excellence that numbers alone cannot reveal.
Ambarella, Inc.
Ambarella shows weak profitability with a negative ROE of -20.9% and a net margin of -41.1%, signaling operational struggles. Its valuation appears unusual with a negative P/E, but a high P/B of 5.64 indicates a stretched price relative to book value. No dividends are paid; heavy R&D spending suggests a growth-focused reinvestment strategy.
NVE Corporation
NVE delivers strong profitability with a 24.2% ROE and a robust net margin of 58.2%, reflecting operational efficiency. Its P/E of 20.5 is fair, though a 4.95 P/B marks a premium valuation. The company supports shareholders with a 6.3% dividend yield, balancing income distribution with steady cash flow generation.
Profitability vs. Valuation Balance
NVE clearly outperforms Ambarella in profitability and shareholder returns, with a more balanced valuation profile. Ambarella’s negative returns and stretched multiples carry higher risk. Investors prioritizing stable earnings and dividends may prefer NVE’s profile, while those focused on reinvestment and growth face greater uncertainty with Ambarella.
Which one offers the Superior Shareholder Reward?
I compare Ambarella, Inc. (AMBA) and NVE Corporation (NVEC) on shareholder returns through dividends and buybacks. AMBA pays no dividends and shows negative profits, relying on reinvestment amid losses. NVEC delivers a strong 4.5–6.3% dividend yield with a payout ratio over 100%, supported by robust 0.9 FCF coverage. NVEC’s consistent buybacks and generous dividends offer immediate rewards and signal durable cash flow. AMBA’s zero payout and weak margins raise risks about sustaining value. I judge NVEC’s balanced distribution strategy superior for total shareholder return in 2026.
Comparative Score Analysis: The Strategic Profile
The radar chart reveals the fundamental DNA and trade-offs of Ambarella, Inc. and NVE Corporation, highlighting their financial strengths and weaknesses:
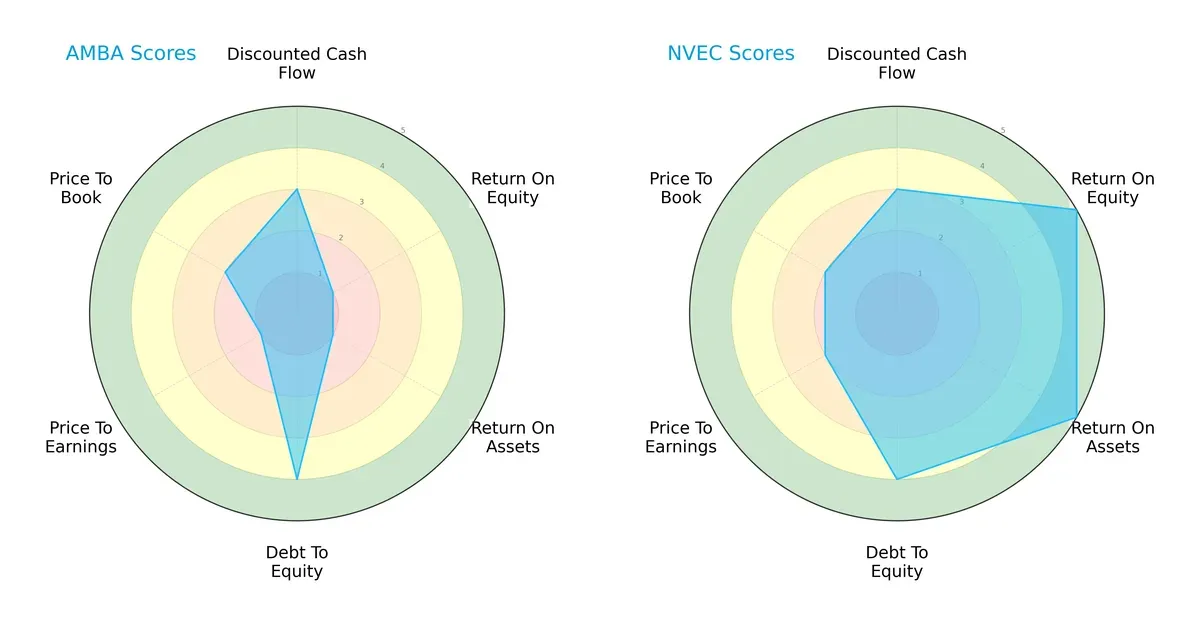
NVE Corporation exhibits a more balanced profile with very favorable ROE and ROA scores, signaling efficient profit generation and asset use. Ambarella relies heavily on a strong debt-to-equity position but shows weakness in profitability and valuation metrics. NVE’s moderate DCF and valuation scores complement its solid operational returns, making it the stronger all-around performer.
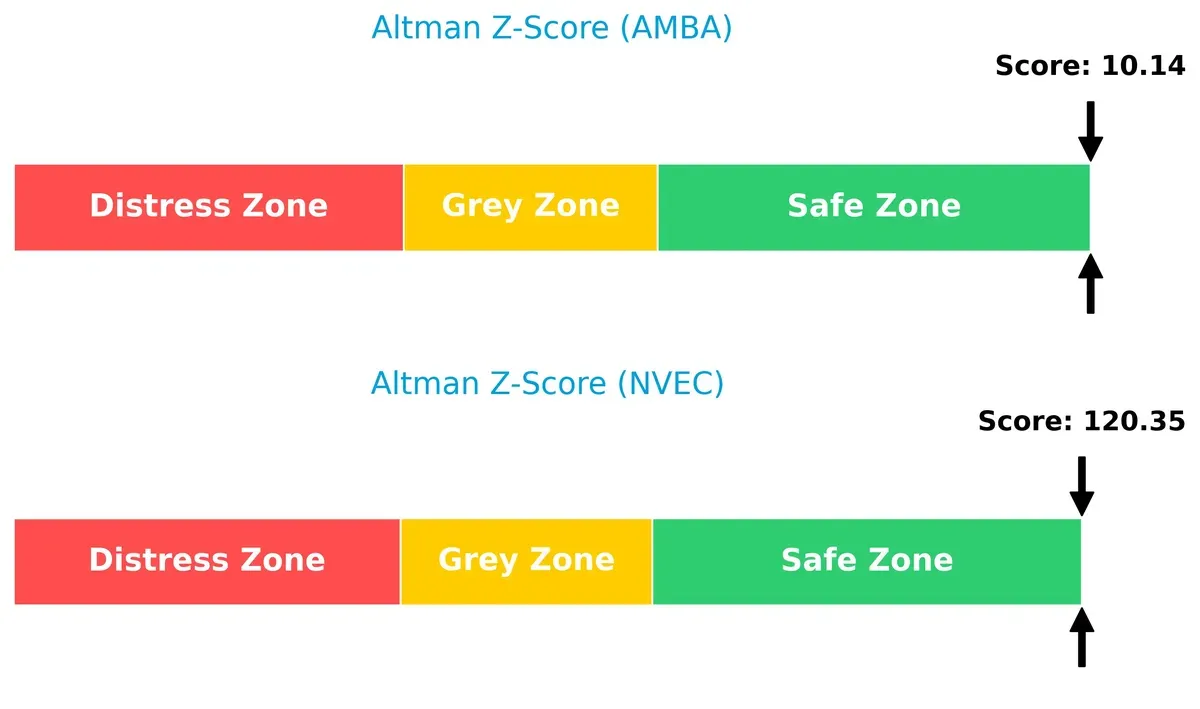
Bankruptcy Risk: Solvency Showdown
NVE Corporation’s Altman Z-Score far exceeds Ambarella’s, indicating a significantly lower bankruptcy risk and stronger long-term survival prospects in this market cycle:
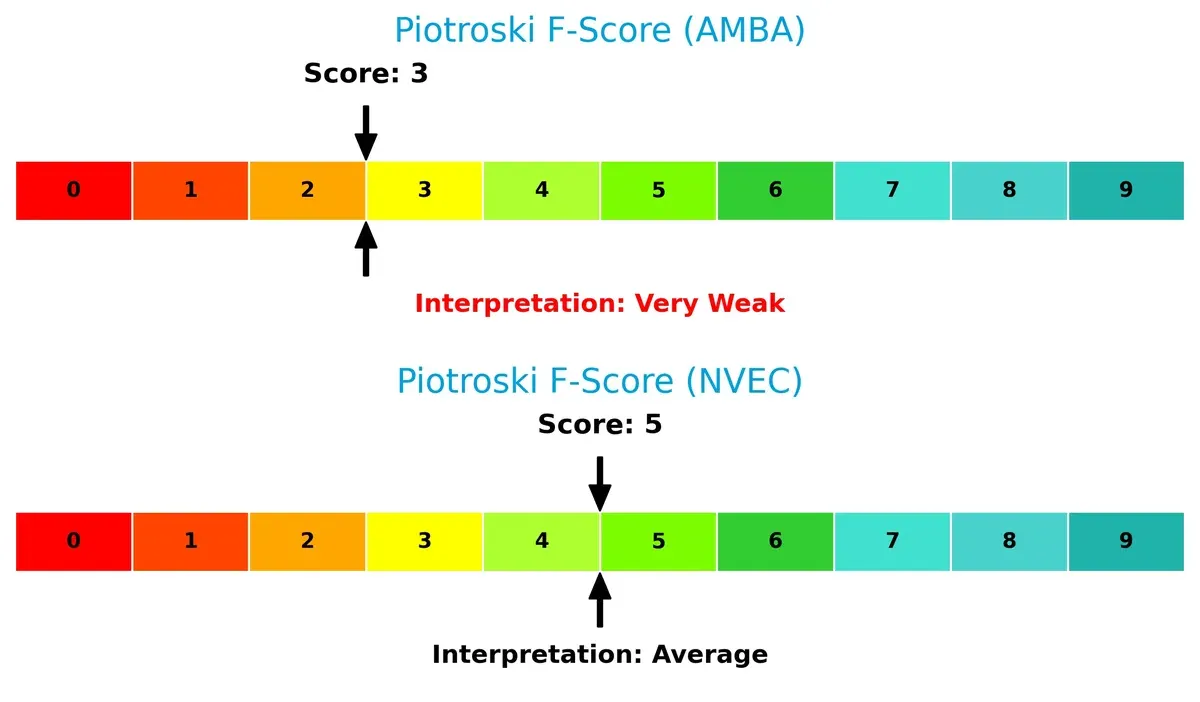
Financial Health: Quality of Operations
NVE’s Piotroski F-Score of 5, compared to Ambarella’s weak 3, signals better internal financial health and fewer red flags regarding operational efficiency and profitability:
How are the two companies positioned?
This section dissects the operational DNA of AMBA and NVEC by comparing their revenue distribution and internal dynamics. The goal is to confront their economic moats and identify the more resilient competitive advantage in today’s market.
Revenue Segmentation: The Strategic Mix
This visual comparison dissects how Ambarella and NVE Corporation diversify their income streams and where their primary sector bets lie:
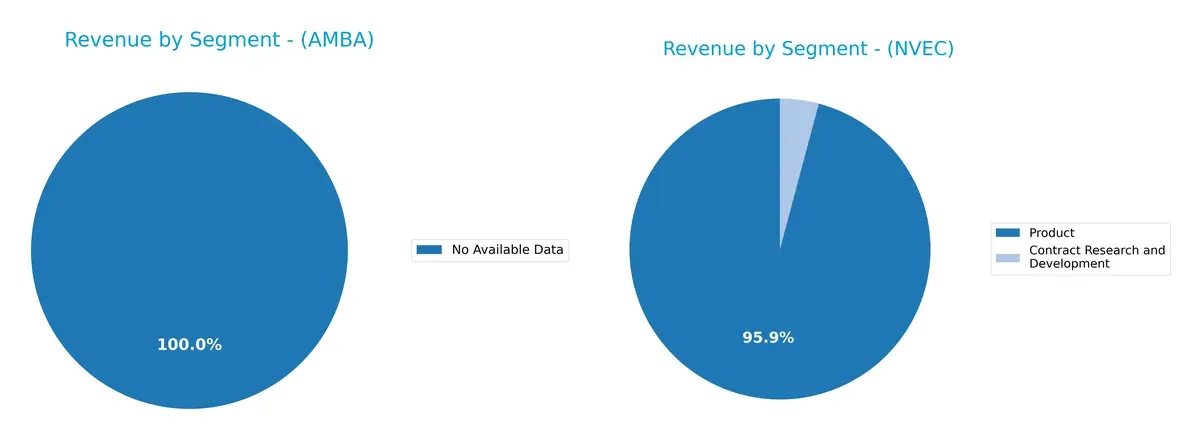
Ambarella lacks available revenue segmentation data, limiting direct comparison. NVE Corporation’s revenue pivots overwhelmingly on its Product segment, generating over 25B in 2022, while Contract Research and Development contributes just 1.1M. This concentration signals strong infrastructure dominance but exposes NVE to product-cycle risks. In contrast, Ambarella’s undisclosed segmentation raises questions about its transparency and diversification strategy. Investors should weigh NVE’s focused model against potential concentration risk carefully.
Strengths and Weaknesses Comparison
This table compares the strengths and weaknesses of Ambarella, Inc. and NVE Corporation based on diversification, profitability, financials, innovation, global presence, and market share:
Ambarella Strengths
- Strong liquidity with current ratio 2.65 and quick ratio 2.36
- Very low debt-to-equity at 0.01
- High fixed asset turnover at 19.96 indicating efficient asset use
NVE Strengths
- High profitability with net margin 58.22% and ROE 24.19%
- Strong return on invested capital at 21.14%
- Favorable interest coverage and low debt-to-assets ratio
- Diversified revenue from contract research and products
Ambarella Weaknesses
- Negative profitability metrics: net margin -41.12%, ROE -20.86%, ROIC -21.96%
- Unfavorable WACC at 12.99% exceeds returns
- Poor interest coverage ratio at 0
- Asset turnover below 0.5 indicates low sales efficiency
NVE Weaknesses
- Unusually high current ratio at 28.4 may indicate inefficient asset use
- Price-to-book at 4.95 is relatively high
- Asset turnover low at 0.4, similar to Ambarella
- Dividend yield neutral, not enhancing shareholder income
Ambarella shows strong liquidity and asset efficiency but suffers from severe profitability challenges. NVE demonstrates robust profitability and capital returns with some efficiency concerns. Both companies face asset turnover weaknesses, suggesting room to improve sales productivity.
The Moat Duel: Analyzing Competitive Defensibility
A structural moat is the only reliable shield protecting long-term profits from relentless competition’s erosion:
Ambarella, Inc.: Innovation-Driven Switching Costs
Ambarella’s moat hinges on high switching costs from integrated AI video processing chips. Despite strong gross margins (60.5%), declining ROIC signals weakening value creation. New automotive AI products in 2026 could either revive or further test this moat.
NVE Corporation: Specialized Spintronics Expertise
NVE leverages proprietary spintronics technology, a rare intangible asset, contrasting Ambarella’s broader semiconductor approach. It sustains high ROIC and net margins above 58%, reflecting a solid, growing moat. Expansion into industrial IoT sensors offers promising growth avenues for 2026.
Innovation Integration vs. Niche Tech Mastery
NVE holds the deeper moat with consistent ROIC growth and exceptional profitability. Ambarella’s eroding ROIC warns of vulnerability despite innovation. NVE appears better equipped to defend and expand its market share long term.
Which stock offers better returns?
The past year shows divergent stock price moves: Ambarella, Inc. gains 14.1% overall despite recent losses, while NVE Corporation faces an 18.9% decline with recent recovery.
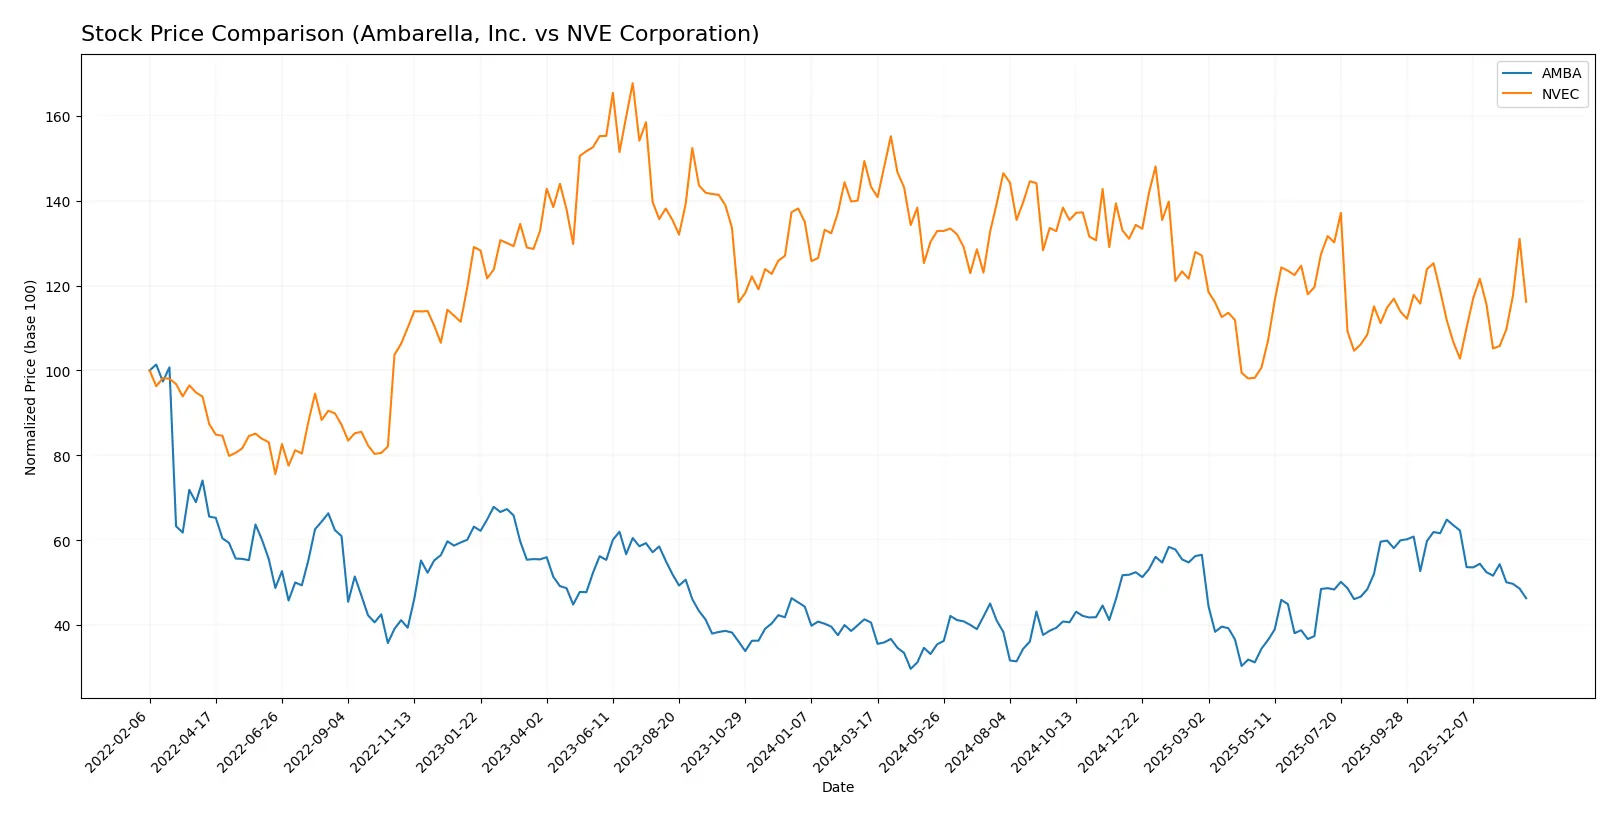
Trend Comparison
Ambarella, Inc. posts a bullish 14.1% gain over 12 months, with decelerating momentum. Price peaked at 89.67 and bottomed at 40.99, showing high volatility (12.8% std dev).
NVE Corporation records a bearish 18.9% drop over the year but accelerates its recent uptrend by 8.9%. The price ranged between 56.99 and 90.18 with moderate volatility (7.6% std dev).
Ambarella delivers the highest annual market return despite recent weakness. NVE’s recovery remains short-term and below Ambarella’s overall performance.
Target Prices
Analysts present a clear target consensus for Ambarella, Inc., reflecting moderate upside potential.
| Company | Target Low | Target High | Consensus |
|---|---|---|---|
| Ambarella, Inc. | 80 | 115 | 97.5 |
The Ambarella consensus target of 97.5 suggests about 52% upside from the current 64.04 price, indicating strong analyst optimism. No verified target price data is available for NVE Corporation.

Don’t Let Luck Decide Your Entry Point
Optimize your entry points with our advanced ProRealTime indicators. You’ll get efficient buy signals with precise price targets for maximum performance. Start outperforming now!
How do institutions grade them?
Institutional grades provide insight into analyst sentiment for both companies:
Ambarella, Inc. Grades
The table below summarizes recent institutional grades for Ambarella, Inc.:
| Grading Company | Action | New Grade | Date |
|---|---|---|---|
| Stifel | Maintain | Buy | 2025-11-26 |
| Needham | Maintain | Buy | 2025-11-26 |
| B of A Securities | Maintain | Neutral | 2025-11-26 |
| Rosenblatt | Maintain | Buy | 2025-11-26 |
| Rosenblatt | Maintain | Buy | 2025-11-24 |
| Oppenheimer | Maintain | Perform | 2025-08-29 |
| B of A Securities | Maintain | Neutral | 2025-08-29 |
| Needham | Maintain | Buy | 2025-08-29 |
| Rosenblatt | Maintain | Buy | 2025-08-29 |
| Morgan Stanley | Maintain | Overweight | 2025-08-29 |
NVE Corporation Grades
No reliable institutional grades are available for NVE Corporation.
Which company has the best grades?
Ambarella, Inc. has consistently received positive grades, mainly Buy and Overweight, signaling analyst confidence. NVE Corporation lacks grade data, which may hinder investor insight and confidence.
Risks specific to each company
The following categories identify the critical pressure points and systemic threats facing both firms in the 2026 market environment:
1. Market & Competition
Ambarella, Inc.
- Faces intense competition in semiconductor design, especially in automotive AI chips, with pressure on margins.
NVE Corporation
- Operates in a niche spintronics market with less direct competition but limited scale and slower growth potential.
2. Capital Structure & Debt
Ambarella, Inc.
- Maintains very low debt (D/E 0.01) and strong liquidity ratios, reducing financial risk despite poor profitability.
NVE Corporation
- Also has low debt and strong interest coverage, supporting financial stability amid modest scale.
3. Stock Volatility
Ambarella, Inc.
- High beta (1.95) indicates significant stock price volatility, raising risk for investors.
NVE Corporation
- Moderately volatile with beta 1.20, reflecting steadier price movements within the tech sector.
4. Regulatory & Legal
Ambarella, Inc.
- Subject to stringent tech and export regulations given automotive and AI applications, increasing compliance costs.
NVE Corporation
- Faces regulatory scrutiny mainly around medical and industrial IoT device standards, less exposure than Ambarella.
5. Supply Chain & Operations
Ambarella, Inc.
- Semiconductor supply chain constraints and chip fabrication dependencies pose operational risks.
NVE Corporation
- Smaller scale mitigates some supply risks but reliance on specialized materials remains a concern.
6. ESG & Climate Transition
Ambarella, Inc.
- Pressure to improve energy efficiency and reduce carbon footprint in manufacturing and product lifecycle.
NVE Corporation
- ESG focus on sustainable spintronic technology provides a moderate advantage but limited scale impact.
7. Geopolitical Exposure
Ambarella, Inc.
- Global sales expose it to US-China tech tensions and trade restrictions affecting supply and market access.
NVE Corporation
- Primarily US-focused with less international exposure, reducing geopolitical risk.
Which company shows a better risk-adjusted profile?
Ambarella’s highest risk lies in market competition and earnings volatility, worsened by negative profitability. NVE’s main concern is its limited scale and niche market growth constraints. NVE offers a substantially better risk-adjusted profile, supported by strong profitability, solid balance sheet, and lower stock volatility. The stark contrast in net margins—Ambarella’s deep losses versus NVE’s robust 58%—justifies heightened caution on Ambarella’s risk exposure.
Final Verdict: Which stock to choose?
Ambarella, Inc. (AMBA) boasts a research-driven innovation engine that fuels its technological edge. Its superpower lies in high R&D intensity, positioning it as a potential long-term disruptor. However, its consistently negative returns on capital signal a critical point of vigilance. This stock might suit aggressive growth seekers willing to weather volatility.
NVE Corporation (NVEC) impresses with a robust economic moat, demonstrated by its strong and growing ROIC well above its cost of capital. Its recurring cash flow and solid profitability offer a more stable profile relative to AMBA. NVEC appears fitting for investors pursuing growth at a reasonable price, valuing durability alongside returns.
If you prioritize high innovation risk and potential breakthrough gains, AMBA is the compelling choice due to its aggressive R&D focus despite current capital inefficiencies. However, if you seek superior stability and proven value creation, NVEC outshines with a durable moat and consistent profitability, commanding a premium in financial health and steady cash generation.
Disclaimer: Investment carries a risk of loss of initial capital. The past performance is not a reliable indicator of future results. Be sure to understand risks before making an investment decision.
Go Further
I encourage you to read the complete analyses of Ambarella, Inc. and NVE Corporation to enhance your investment decisions: