Nova Ltd. and Ambarella, Inc. are two dynamic players in the semiconductor industry, each driving innovation through advanced technology solutions. Nova specializes in precision metrology systems crucial for semiconductor manufacturing, while Ambarella focuses on sophisticated video processing chips powering AI-driven camera applications. Their overlapping market presence and distinct innovation strategies make them compelling investment candidates. In this article, I will help you identify which company offers the most promising opportunity for your portfolio.

Table of contents
Companies Overview
I will begin the comparison between Nova Ltd. and Ambarella, Inc. by providing an overview of these two companies and their main differences.
Nova Ltd. Overview
Nova Ltd. focuses on designing, developing, producing, and selling process control systems used in semiconductor manufacturing globally. Its product portfolio includes metrology platforms for dimensional, film, material, and chemical measurements. Serving sectors like logic, foundries, and memory manufacturers, Nova supports various process steps in semiconductor production. Headquartered in Israel, Nova operates internationally and has a market cap of approximately 12.9B USD.
Ambarella, Inc. Overview
Ambarella, Inc. develops semiconductor solutions specializing in video processing for HD and ultra HD applications worldwide. Its system-on-a-chip products integrate video, image processing, AI computer vision, and audio functions, used in automotive cameras, security systems, robotics, and consumer devices. Based in California, Ambarella has a market cap near 2.7B USD and serves original design and equipment manufacturers through direct sales and distributors.
Key similarities and differences
Both companies operate in the semiconductor technology sector with a focus on specialized chip solutions. Nova provides process control metrology for semiconductor manufacturing, while Ambarella targets video and AI processing chips across automotive, security, and consumer markets. Nova’s business is more manufacturing process-oriented, whereas Ambarella’s focuses on multimedia and intelligent vision applications. Their market caps also differ significantly, reflecting scale and market positioning.
Income Statement Comparison
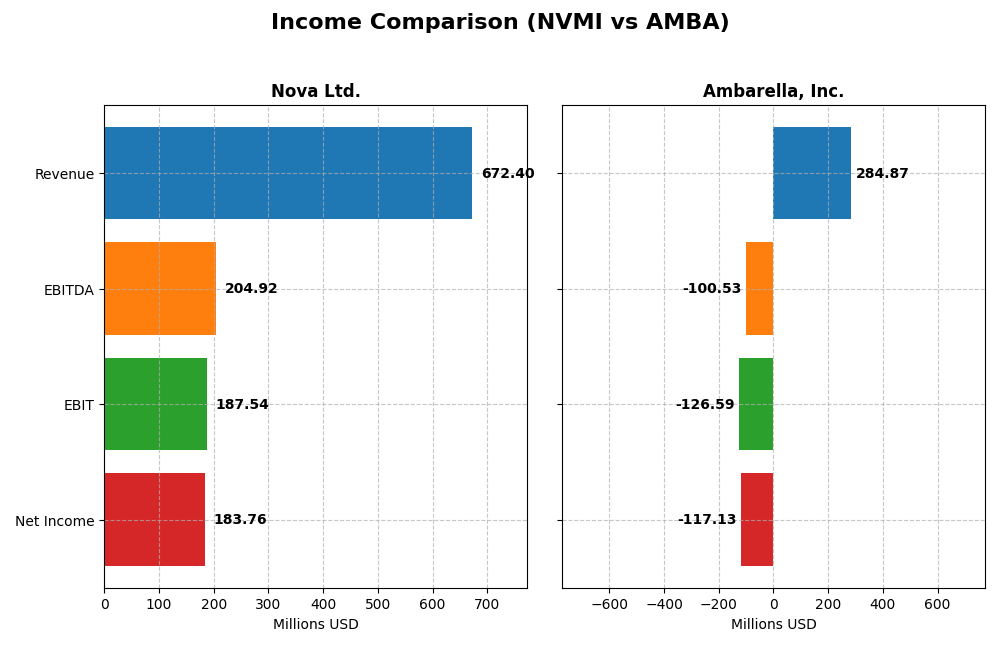
The table below compares the key income statement metrics for Nova Ltd. and Ambarella, Inc. based on their most recent fiscal year results.
| Metric | Nova Ltd. (NVMI) | Ambarella, Inc. (AMBA) |
|---|---|---|
| Market Cap | 12.9B | 2.7B |
| Revenue | 672M | 285M |
| EBITDA | 205M | -101M |
| EBIT | 188M | -127M |
| Net Income | 185M | -117M |
| EPS | 6.31 | -2.84 |
| Fiscal Year | 2024 | 2025 |
Income Statement Interpretations
Nova Ltd.
Nova Ltd. has exhibited strong revenue growth from 2020 to 2024, with a 29.83% increase in the last year alone, reaching $672M in 2024. Net income also surged significantly, reflecting a 283.58% growth over the period. Margins remained robust, with a favorable gross margin of 57.57% and a net margin of 27.33%. The most recent year showed healthy margin stability and solid EPS growth of 34.35%.
Ambarella, Inc.
Ambarella, Inc. experienced moderate revenue growth, increasing 25.78% in the latest year to $285M in 2025. However, the net income remained negative, despite a 45.04% improvement in net margin last year. The gross margin stayed favorable at 60.5%, but EBIT and net margins were unfavorable at -44.44% and -41.12%, respectively. The company’s overall net income and EPS declined substantially over the period.
Which one has the stronger fundamentals?
Nova Ltd. demonstrates stronger fundamentals with consistent revenue and net income growth, high and stable margins, and favorable margin trends, including low interest expense. Ambarella’s favorable gross margin is overshadowed by persistent net losses and negative EBIT margins. Overall, Nova’s income statement reflects greater profitability and margin improvement over the analyzed period.
Financial Ratios Comparison
The table below presents a side-by-side comparison of key financial ratios for Nova Ltd. (NVMI) and Ambarella, Inc. (AMBA) based on their most recent fiscal year data.
| Ratios | Nova Ltd. (2024) | Ambarella, Inc. (2025) |
|---|---|---|
| ROE | 19.8% | -20.9% |
| ROIC | 13.4% | -21.9% |
| P/E | 31.2 | -27.1 |
| P/B | 6.18 | 5.64 |
| Current Ratio | 2.32 | 2.65 |
| Quick Ratio | 1.92 | 2.36 |
| D/E | 0.25 | 0.009 |
| Debt-to-Assets | 17.0% | 0.8% |
| Interest Coverage | 116.2 | 0 |
| Asset Turnover | 0.48 | 0.41 |
| Fixed Asset Turnover | 5.06 | 19.96 |
| Payout Ratio | 0 | 0 |
| Dividend Yield | 0 | 0 |
Interpretation of the Ratios
Nova Ltd.
Nova Ltd. shows mostly strong financial ratios with favorable net margin at 27.33%, ROE of 19.81%, and ROIC at 13.39%. The company’s liquidity and solvency ratios, including a current ratio of 2.32 and low debt-to-assets at 16.98%, are also favorable. However, valuation multiples such as a PE of 31.2 and PB of 6.18 are relatively high, posing valuation concerns. Nova Ltd. does not pay dividends, likely focusing on reinvestment and growth.
Ambarella, Inc.
Ambarella, Inc. exhibits weaker financial health with unfavorable profitability ratios, including a net margin of -41.12% and negative ROE and ROIC. While liquidity ratios are solid, with a current ratio of 2.65 and minimal debt-to-assets at 0.76%, the company’s earnings yield is negative, and interest coverage is zero, indicating financial stress. Ambarella does not pay dividends, reflecting its ongoing losses and possible reinvestment in R&D.
Which one has the best ratios?
Based on the ratio evaluations, Nova Ltd. presents a more favorable overall financial profile with stronger profitability, solvency, and liquidity ratios, despite some valuation concerns. Ambarella, Inc. shows significant challenges in profitability and coverage metrics, resulting in an unfavorable global ratio opinion. Thus, Nova Ltd. holds the advantage in this comparison.
Strategic Positioning
This section compares the strategic positioning of Nova Ltd. and Ambarella, Inc. including market position, key segments, and exposure to technological disruption:
Nova Ltd.
- Leading semiconductor process control systems supplier facing competitive pressure in integrated circuits industry.
- Focused on semiconductor metrology platforms for lithography, etch, and packaging across logic, memory, and foundries.
- Operates in a specialized semiconductor process control niche with moderate exposure to rapid tech disruption.
Ambarella, Inc.
- Developer of semiconductor video solutions with competitive pressure in automotive and consumer markets.
- Specializes in HD video processing chips for automotive cameras, security, robotics, and consumer electronics.
- Faces technological disruption risks in AI, image processing, and evolving automotive video applications.
Nova Ltd. vs Ambarella, Inc. Positioning
Nova Ltd. pursues a concentrated approach focused on semiconductor process control systems, benefiting from specialization but limited diversification. Ambarella, Inc. targets diversified end markets in video processing, exposing it to broader but more volatile industry dynamics.
Which has the best competitive advantage?
Nova Ltd. shows a slightly favorable moat with growing profitability, indicating improving competitive advantage. Ambarella, Inc. has a very unfavorable moat with declining returns, reflecting value destruction and weaker competitive positioning.
Stock Comparison
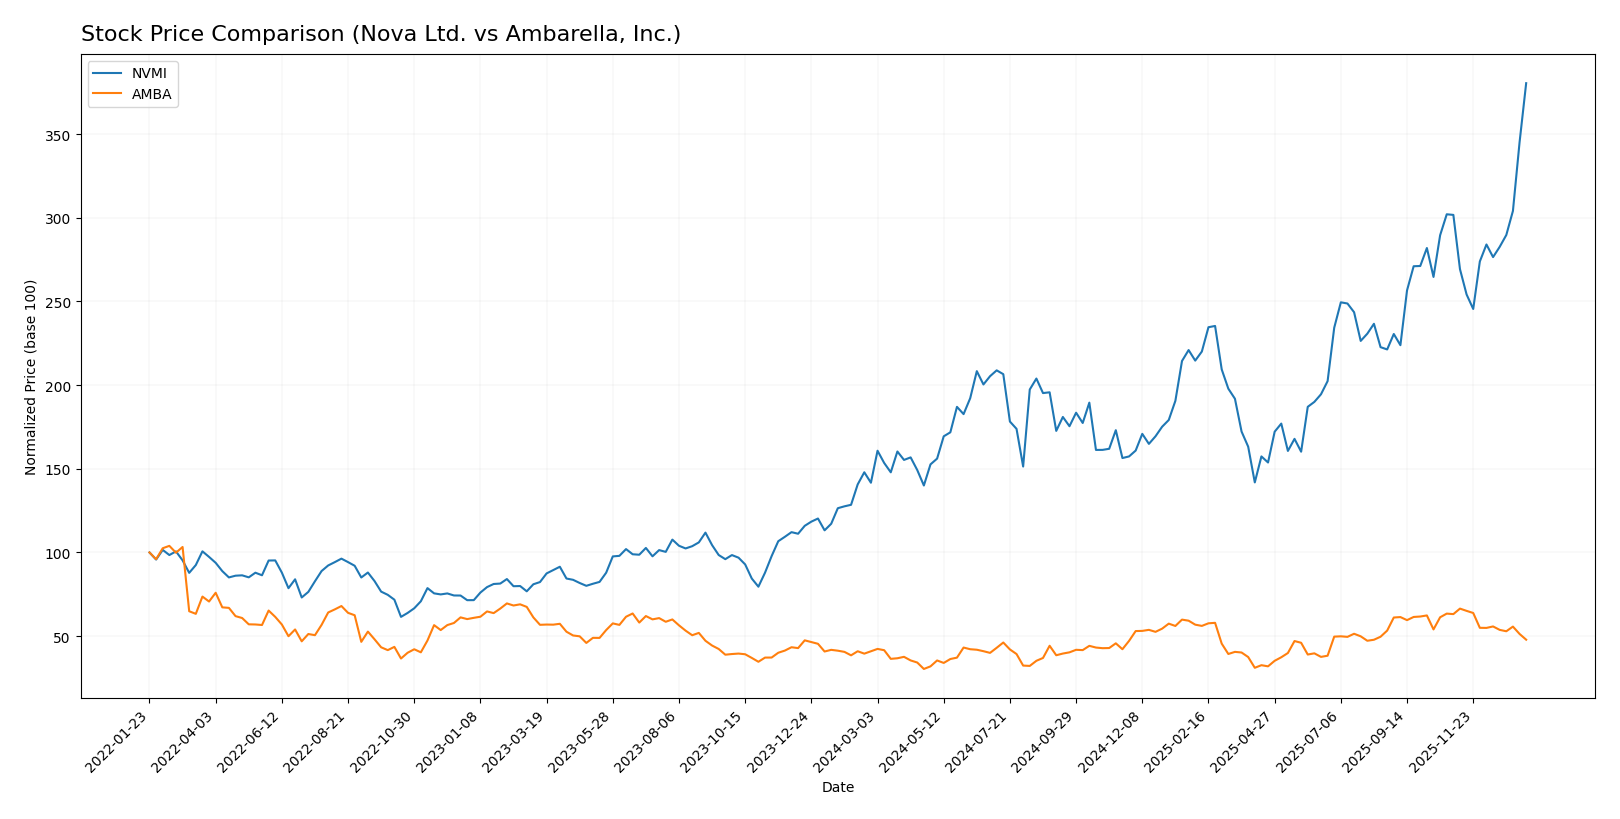
The stock price chart highlights significant bullish momentum for Nova Ltd. (NVMI) with strong gains and accelerating growth, contrasted with Ambarella, Inc. (AMBA), which shows more moderate gains and recent deceleration in price action.
Trend Analysis
Nova Ltd. (NVMI) experienced a robust bullish trend over the past 12 months, with a 168.54% price increase and accelerating momentum. The stock ranged between 159.92 and 434.55, showing high volatility with a 55.86 standard deviation.
Ambarella, Inc. (AMBA) also posted a bullish trend over the last year, gaining 16.9%, but with deceleration in growth. Its price fluctuated between 40.99 and 89.67, exhibiting lower volatility at a 12.81 standard deviation.
Comparing both, NVMI delivered the highest market performance with much stronger price appreciation and acceleration, while AMBA showed moderate gains and recent bearish short-term movement.
Target Prices
The current analyst consensus presents a mixed outlook for these semiconductor companies.
| Company | Target High | Target Low | Consensus |
|---|---|---|---|
| Nova Ltd. | 390 | 335 | 362.5 |
| Ambarella, Inc. | 115 | 80 | 97.5 |
For Nova Ltd., the consensus target price of 362.5 USD is below the current stock price of 434.55 USD, indicating potential downside risk. Ambarella’s consensus target of 97.5 USD is significantly above its current price of 64.6 USD, suggesting room for growth according to analysts.
Analyst Opinions Comparison
This section compares analysts’ ratings and grades for Nova Ltd. and Ambarella, Inc.:
Rating Comparison
Nova Ltd. Rating
- Rating: B- indicating a very favorable evaluation from analysts.
- Discounted Cash Flow Score: Moderate at 3, suggesting neutral valuation based on future cash flows.
- ROE Score: Favorable at 4, showing efficient profit generation from shareholders’ equity.
- ROA Score: Very favorable at 5, reflecting strong asset utilization to generate earnings.
- Debt To Equity Score: Very unfavorable at 1, implying high financial risk due to leverage.
- Overall Score: Moderate at 3, a balanced summary of financial health and prospects.
Ambarella, Inc. Rating
- Rating: C+ also considered very favorable by analysts.
- Discounted Cash Flow Score: Moderate at 3, similarly neutral outlook on valuation.
- ROE Score: Very unfavorable at 1, indicating weak profitability from equity.
- ROA Score: Very unfavorable at 1, signaling poor asset efficiency.
- Debt To Equity Score: Favorable at 4, indicating relatively low financial risk from debt levels.
- Overall Score: Moderate at 2, slightly lower than Nova Ltd., reflecting weaker overall metrics.
Which one is the best rated?
Based strictly on provided data, Nova Ltd. holds a higher overall rating (B-) and scores better on profitability metrics (ROE, ROA) despite a weaker debt profile. Ambarella, Inc. shows strength in debt management but has lower profitability and overall scores.
Scores Comparison
The comparison of Nova Ltd. and Ambarella, Inc. scores is as follows:
NVMI Scores
- Altman Z-Score: 7.76, indicating a safe zone with low bankruptcy risk.
- Piotroski Score: 7, categorized as strong financial health.
AMBA Scores
- Altman Z-Score: 10.69, indicating a safe zone with very low bankruptcy risk.
- Piotroski Score: 3, categorized as very weak financial health.
Which company has the best scores?
Ambarella, Inc. has a higher Altman Z-Score, suggesting greater financial stability. However, Nova Ltd. shows a significantly stronger Piotroski Score, indicating better overall financial health based on profitability and efficiency metrics.
Grades Comparison
Here is a comparison of the recent grades assigned to Nova Ltd. and Ambarella, Inc. by recognized grading companies:
Nova Ltd. Grades
The following table shows Nova Ltd.’s recent stock ratings from various grading companies:
| Grading Company | Action | New Grade | Date |
|---|---|---|---|
| B of A Securities | Maintain | Buy | 2026-01-13 |
| Jefferies | Maintain | Buy | 2025-12-15 |
| Evercore ISI Group | Maintain | Outperform | 2025-11-07 |
| Benchmark | Maintain | Buy | 2025-11-07 |
| Cantor Fitzgerald | Maintain | Overweight | 2025-06-24 |
| B of A Securities | Maintain | Buy | 2025-06-24 |
| Benchmark | Maintain | Buy | 2025-05-09 |
| Citigroup | Maintain | Buy | 2025-05-09 |
| B of A Securities | Maintain | Buy | 2025-04-16 |
| Cantor Fitzgerald | Maintain | Overweight | 2025-03-14 |
Nova Ltd.’s grades consistently show a strong positive bias, predominantly “Buy” and “Outperform” ratings, indicating sustained confidence from analysts.
Ambarella, Inc. Grades
The following table presents Ambarella, Inc.’s recent stock ratings from various grading companies:
| Grading Company | Action | New Grade | Date |
|---|---|---|---|
| B of A Securities | Maintain | Neutral | 2025-11-26 |
| Needham | Maintain | Buy | 2025-11-26 |
| Stifel | Maintain | Buy | 2025-11-26 |
| Rosenblatt | Maintain | Buy | 2025-11-26 |
| Rosenblatt | Maintain | Buy | 2025-11-24 |
| Stifel | Maintain | Buy | 2025-08-29 |
| Needham | Maintain | Buy | 2025-08-29 |
| Northland Capital Markets | Maintain | Outperform | 2025-08-29 |
| Morgan Stanley | Maintain | Overweight | 2025-08-29 |
| Oppenheimer | Maintain | Perform | 2025-08-29 |
Ambarella’s grades vary more widely, with a mixture of “Buy,” “Neutral,” “Outperform,” and “Perform” ratings, suggesting a more cautious stance among analysts.
Which company has the best grades?
Nova Ltd. has received more consistently positive grades, mostly “Buy” and “Outperform,” compared to Ambarella’s mix of “Buy,” “Neutral,” and “Perform” ratings. This consistency may denote stronger analyst confidence for Nova Ltd., which investors might interpret as more favorable sentiment.
Strengths and Weaknesses
Below is a comparison of key strengths and weaknesses between Nova Ltd. (NVMI) and Ambarella, Inc. (AMBA) based on the latest financial and strategic data.
| Criterion | Nova Ltd. (NVMI) | Ambarella, Inc. (AMBA) |
|---|---|---|
| Diversification | Moderate product focus with $538M revenue in 2024, showing growth | Limited product data, less diversified |
| Profitability | Strong net margin at 27.33%, ROIC at 13.39% (favorable) | Negative net margin (-41.12%) and ROIC (-21.96%) (unfavorable) |
| Innovation | Growing ROIC trend indicates improving efficiency and innovation | Declining ROIC trend signals weakening innovation impact |
| Global presence | Solid financial health with good liquidity ratios (current ratio 2.32) | Adequate liquidity (current ratio 2.65) but poor profitability undermines presence |
| Market Share | High fixed asset turnover (5.06) suggests effective asset use | Very high fixed asset turnover (19.96) but overall value destruction |
Nova Ltd. demonstrates a slightly favorable competitive position with improving profitability and solid financial ratios. Ambarella faces significant challenges with declining profitability and value destruction despite some operational strengths. Investors should weigh Nova’s growth potential against Ambarella’s current risks.
Risk Analysis
Below is a comparison of key risks for Nova Ltd. (NVMI) and Ambarella, Inc. (AMBA) based on the latest available data for 2025-2026:
| Metric | Nova Ltd. (NVMI) | Ambarella, Inc. (AMBA) |
|---|---|---|
| Market Risk | High beta 1.83; volatile semiconductor market exposure | Higher beta 1.95; sensitive to tech cycle swings |
| Debt Level | Low debt-to-equity 0.25; strong interest coverage (116x) | Very low debt 0.01; no interest coverage due to losses |
| Regulatory Risk | Moderate; operates globally including US, China, Israel | Moderate; US-centric with exposure to export controls |
| Operational Risk | Moderate; complex semiconductor metrology tech | Elevated; negative profit margins impact operations |
| Environmental Risk | Standard semiconductor industry risks; no major issues | Standard industry risks; no significant disclosures |
| Geopolitical Risk | Exposure to Israel, China, Taiwan; supply chain sensitivity | Mainly US-based but exposed to global supply chains |
The most impactful risks are market volatility and operational challenges. Nova Ltd. benefits from solid financial health and strong profitability, mitigating debt risk despite market fluctuations. Ambarella faces significant operational risks with negative margins and zero interest coverage, making it vulnerable if market conditions worsen. Geopolitical tensions in Asia may affect Nova’s supply chains notably. Caution and close monitoring of earnings and geopolitical developments are advised.
Which Stock to Choose?
Nova Ltd. (NVMI) shows robust income growth with a 29.83% revenue increase in 2024 and a net margin of 27.33%, supported by favorable profitability ratios including a 19.81% ROE and moderate debt levels. Its rating is very favorable with a B- grade and strong financial stability.
Ambarella, Inc. (AMBA) demonstrates positive revenue growth of 25.78% in 2025 but suffers from negative net margin (-41.12%) and profitability ratios, including a -20.86% ROE. While its debt profile is very low, the overall rating remains very favorable with a C+ grade despite weak profitability indicators.
Investors with a risk-tolerant or growth-oriented profile might find Nova Ltd.’s improving profitability and moderate financial leverage appealing, while those prioritizing low debt exposure could see Ambarella’s profile as more aligned, notwithstanding its current profitability challenges.
Disclaimer: Investment carries a risk of loss of initial capital. The past performance is not a reliable indicator of future results. Be sure to understand risks before making an investment decision.
Go Further
I encourage you to read the complete analyses of Nova Ltd. and Ambarella, Inc. to enhance your investment decisions: