Ambarella, Inc. and MicroVision, Inc. operate at the forefront of technology, specializing in semiconductor video solutions and lidar sensor development, respectively. Both companies cater to rapidly evolving markets like automotive safety and autonomous systems, making their innovation strategies and market positioning highly relevant for comparison. In this article, I will analyze each company’s strengths and risks to help you decide which one presents the most compelling investment opportunity in 2026.
Table of contents
Companies Overview
I will begin the comparison between Ambarella, Inc. and MicroVision, Inc. by providing an overview of these two companies and their main differences.
Ambarella Overview
Ambarella, Inc. develops semiconductor solutions focused on video processing, including HD and ultra HD compression, image processing, and AI-based computer vision algorithms. The company’s system-on-a-chip integrates multiple functions to deliver high-quality video and low power consumption for various applications such as automotive cameras, security cameras, robotics, and consumer devices. Ambarella operates globally and targets OEMs and ODMs in technology markets.
MicroVision Overview
MicroVision, Inc. specializes in lidar sensors primarily for automotive safety and autonomous driving, using laser beam scanning technology based on MEMS and opto-mechanics. The company also develops micro-displays for AR headsets, interactive display modules, and consumer lidar products for smart home systems. MicroVision markets its innovative scanning technology mainly to original equipment and design manufacturers, focusing on emerging hardware and automotive sectors.
Key similarities and differences
Both Ambarella and MicroVision operate in the technology sector, supplying advanced hardware solutions to OEMs and ODMs. Ambarella focuses on semiconductor chips for video and AI applications, while MicroVision centers on lidar sensors and scanning technologies for automotive and AR markets. Ambarella is considerably larger with over 900 employees and a market cap above 3B, whereas MicroVision is smaller with fewer than 200 employees and a market cap under 300M, reflecting differing scales and product specializations.
Income Statement Comparison
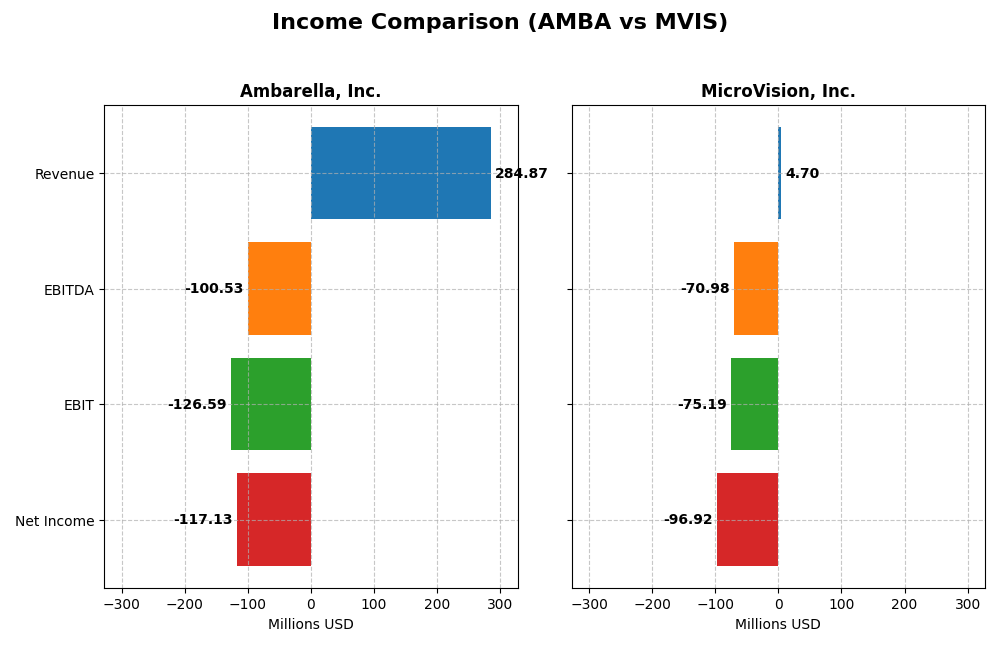
Below is a side-by-side comparison of the key income statement metrics for Ambarella, Inc. and MicroVision, Inc. for their most recent fiscal years.
| Metric | Ambarella, Inc. (AMBA) | MicroVision, Inc. (MVIS) |
|---|---|---|
| Market Cap | 3.18B | 272M |
| Revenue | 285M | 4.7M |
| EBITDA | -101M | -71M |
| EBIT | -127M | -75M |
| Net Income | -117M | -97M |
| EPS | -2.84 | -0.46 |
| Fiscal Year | 2025 | 2024 |
Income Statement Interpretations
Ambarella, Inc.
Ambarella’s revenue showed an overall growth of 27.75% from 2021 to 2025, with a significant 25.78% increase in the last year to $285M. Despite this, net income declined by 95.91% over the period, registering a loss of $117M in 2025. Gross margins remained strong at 60.5%, but net margins stayed negative at -41.12%. Recent improvements include a 45.04% net margin growth and an 18.09% EBIT growth.
MicroVision, Inc.
MicroVision’s revenue increased by 51.97% over 2020-2024 but fell by 35.31% in the last year to $4.7M. The company reported persistent net losses, with a net income decline of 610.83% over the period, reaching -$97M in 2024. Gross margin was heavily negative at -60.35%, and net margin at -2063.78%. EBIT showed a modest 14.85% improvement in the most recent year, despite overall unfavorable margin trends.
Which one has the stronger fundamentals?
Ambarella demonstrates stronger fundamentals with favorable gross margin and revenue growth, plus positive momentum in EBIT and net margin in 2025. Conversely, MicroVision faces severe margin challenges and high losses, with limited improvement confined to EBIT growth. Ambarella’s more robust revenue base and improved profitability metrics suggest comparatively better income statement health.
Financial Ratios Comparison
The table below presents a side-by-side comparison of key financial ratios for Ambarella, Inc. (AMBA) and MicroVision, Inc. (MVIS) based on their most recent fiscal year data.
| Ratios | Ambarella, Inc. (2025) | MicroVision, Inc. (2024) |
|---|---|---|
| ROE | -20.9% | -198.7% |
| ROIC | -21.96% | -83.7% |
| P/E | -27.05 | -2.83 |
| P/B | 5.64 | 5.63 |
| Current Ratio | 2.65 | 1.79 |
| Quick Ratio | 2.36 | 1.74 |
| D/E | 0.0094 | 1.06 |
| Debt-to-Assets | 0.76% | 42.62% |
| Interest Coverage | 0 | -19.19 |
| Asset Turnover | 0.41 | 0.04 |
| Fixed Asset Turnover | 19.96 | 0.20 |
| Payout ratio | 0 | 0 |
| Dividend yield | 0 | 0 |
Interpretation of the Ratios
Ambarella, Inc.
Ambarella’s financial ratios reveal a mixed profile with more unfavorable metrics, including negative net margin (-41.12%) and return on equity (-20.86%). However, liquidity ratios like current ratio (2.65) and low debt levels (debt to equity 0.01) are favorable, indicating good short-term financial health. Ambarella does not pay dividends, likely focusing on reinvestment and R&D, as suggested by its high research and development expense ratio.
MicroVision, Inc.
MicroVision shows predominantly unfavorable ratios, with extremely negative net margin (-2063.78%) and return on equity (-198.72%), reflecting significant losses. Liquidity ratios are moderate (current ratio 1.79), but high debt-to-equity (1.06) and poor asset turnover dampen financial strength. The company also pays no dividends, consistent with its heavy investment in R&D and ongoing growth challenges.
Which one has the best ratios?
Both companies present predominantly unfavorable financial ratios, but Ambarella has a higher proportion of favorable metrics (42.86% versus 21.43%) and stronger liquidity and leverage indicators. MicroVision’s ratios indicate more severe profitability issues and higher leverage, suggesting greater financial risk relative to Ambarella.
Strategic Positioning
This section compares the strategic positioning of Ambarella, Inc. and MicroVision, Inc. based on Market position, Key segments, and Exposure to technological disruption:
Ambarella, Inc.
- Established semiconductor player with $3.18B market cap facing tech competition.
- Focuses on HD video processing chips for automotive, security, robotics, and consumer cameras.
- Operates in semiconductor video tech with AI integration, exposed to rapid AI and imaging advances.
MicroVision, Inc.
- Smaller hardware firm with $272M market cap in niche lidar and display tech.
- Develops lidar sensors, micro-display modules, and PicoP scanning for automotive and AR.
- Relies on MEMS-based lidar and scanning tech, exposed to innovation in automotive safety and AR.
Ambarella, Inc. vs MicroVision, Inc. Positioning
Ambarella has a diversified product portfolio across automotive, security, and consumer markets, offering broader business drivers. MicroVision concentrates on lidar and display modules, focusing on specialized automotive and AR applications, with a smaller scale and niche exposure.
Which has the best competitive advantage?
Neither company currently demonstrates a strong economic moat; Ambarella shows declining value creation, while MicroVision has improving profitability but still sheds value, indicating both face competitive and profitability challenges.
Stock Comparison
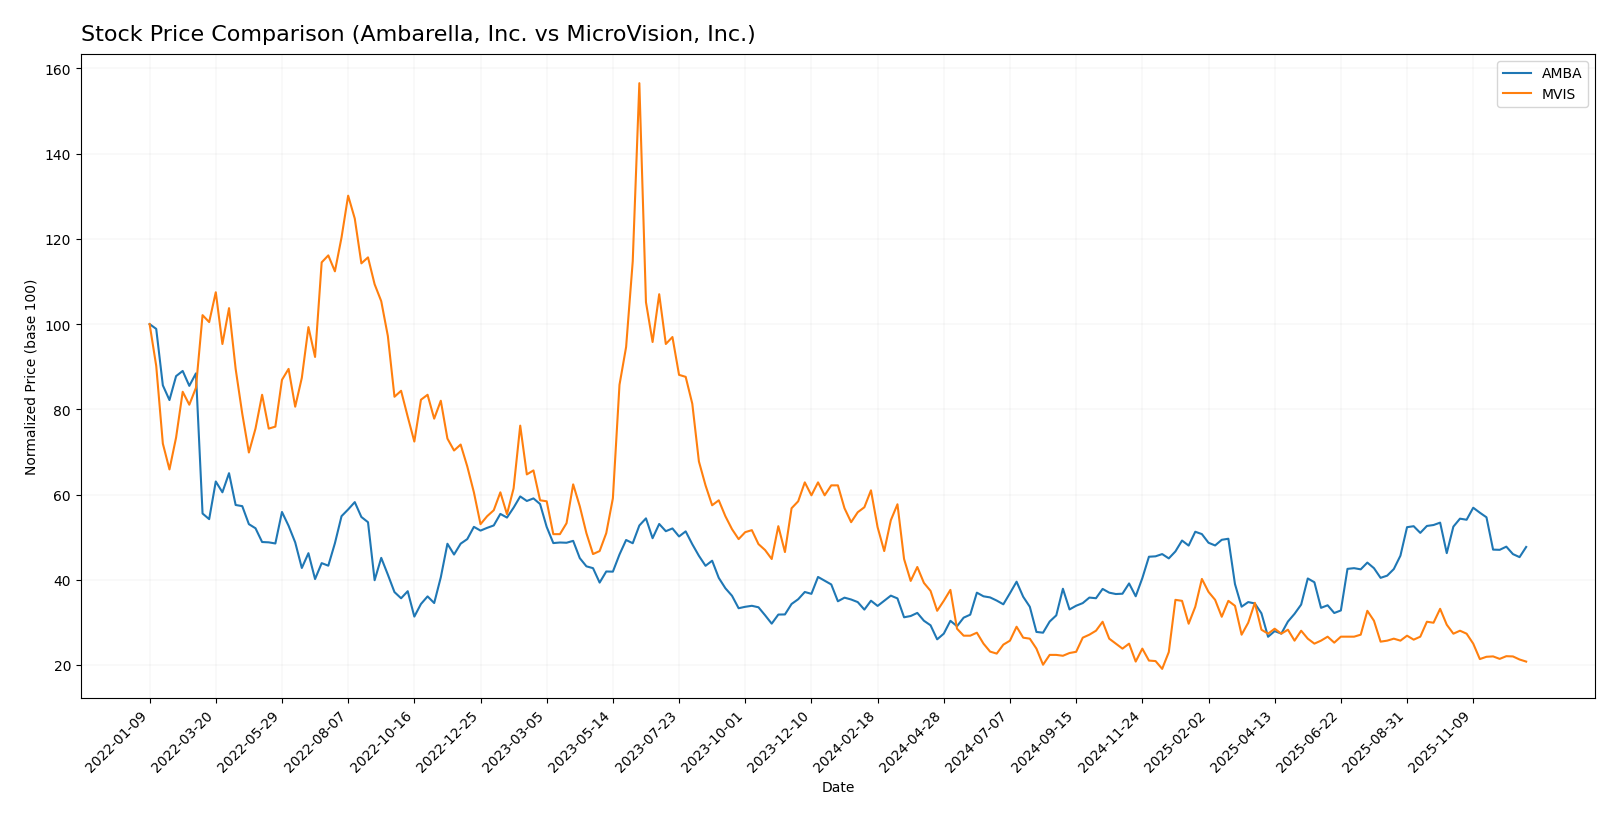
The past year showed contrasting price movements for Ambarella, Inc. and MicroVision, Inc., with Ambarella experiencing a strong overall gain despite recent pullbacks, while MicroVision faced a sustained decline marked by decelerating bearish momentum.
Trend Analysis
Ambarella, Inc. exhibited a bullish trend over the past 12 months with a 35.96% price increase, accompanied by deceleration in momentum and a significant volatility level (std deviation 12.84). The stock reached a high of 89.67 and a low of 40.99 but showed a negative trend of -9.1% in the recent period.
MicroVision, Inc. followed a bearish trend over the same period with a 65.91% price decline and decelerating bearish momentum. Volatility was low (std deviation 0.34), with the stock hitting a high of 2.61 and a low of 0.82. The recent trend continued downward with a -23.96% price change.
Comparing the two, Ambarella outperformed MicroVision significantly in market performance over the last year, delivering a positive return versus a steep decline for MicroVision.
Target Prices
The consensus target prices from recognized analysts suggest promising upside potential for these technology firms.
| Company | Target High | Target Low | Consensus |
|---|---|---|---|
| Ambarella, Inc. | 115 | 80 | 97.5 |
| MicroVision, Inc. | 5 | 5 | 5 |
Analysts expect Ambarella’s stock to trade significantly above its current price of $75.16, indicating strong growth potential. Meanwhile, MicroVision’s target consensus of $5 far exceeds its current $0.89, implying high risk but substantial upside if the company executes well.
Analyst Opinions Comparison
This section compares analysts’ ratings and financial grades for Ambarella, Inc. and MicroVision, Inc.:
Rating Comparison
Ambarella Rating
- Rating: C+ indicating a very favorable evaluation.
- Discounted Cash Flow Score: 3, moderate assessment of valuation based on future cash flows.
- ROE Score: 1, very unfavorable, showing low efficiency in generating profit from equity.
- ROA Score: 1, very unfavorable, reflecting weak asset utilization to generate earnings.
- Debt To Equity Score: 4, favorable, suggesting strong balance sheet with low financial risk.
- Overall Score: 2, moderate, reflecting an average overall financial standing.
MicroVision Rating
- Rating: C- indicating a very favorable evaluation.
- Discounted Cash Flow Score: 1, very unfavorable, indicating concerns about valuation.
- ROE Score: 1, very unfavorable, similarly indicating poor profit generation efficiency.
- ROA Score: 1, very unfavorable, also showing ineffective asset use.
- Debt To Equity Score: 2, moderate, indicating moderate financial risk due to debt levels.
- Overall Score: 1, very unfavorable, implying weaker overall financial health.
Which one is the best rated?
Ambarella holds a higher rating (C+) and scores better on discounted cash flow and debt-to-equity measures than MicroVision, which has a lower rating (C-) and generally less favorable scores. Overall, Ambarella is the better rated company based strictly on provided data.
Scores Comparison
Here is a comparison of the Altman Z-Score and Piotroski Score for Ambarella, Inc. and MicroVision, Inc.:
AMBA Scores
- Altman Z-Score: 10.88, indicating a safe zone.
- Piotroski Score: 3, classified as very weak.
MVIS Scores
- Altman Z-Score: -6.63, indicating distress zone.
- Piotroski Score: 1, classified as very weak.
Which company has the best scores?
Ambarella has a significantly higher Altman Z-Score, placing it in the safe zone, while MicroVision is in the distress zone. Both companies have very weak Piotroski Scores, but Ambarella’s Altman Z-Score suggests stronger financial stability.
Grades Comparison
The following section compares the latest reliable grades for Ambarella, Inc. and MicroVision, Inc.:
Ambarella, Inc. Grades
This table summarizes recent grades assigned by well-known financial institutions for Ambarella, Inc.:
| Grading Company | Action | New Grade | Date |
|---|---|---|---|
| Rosenblatt | Maintain | Buy | 2025-11-26 |
| Stifel | Maintain | Buy | 2025-11-26 |
| B of A Securities | Maintain | Neutral | 2025-11-26 |
| Needham | Maintain | Buy | 2025-11-26 |
| Rosenblatt | Maintain | Buy | 2025-11-24 |
| Oppenheimer | Maintain | Perform | 2025-08-29 |
| Morgan Stanley | Maintain | Overweight | 2025-08-29 |
| Northland Capital Markets | Maintain | Outperform | 2025-08-29 |
| B of A Securities | Maintain | Neutral | 2025-08-29 |
| Stifel | Maintain | Buy | 2025-08-29 |
Ambarella’s grades predominantly indicate a buy or better stance, with some neutral and outperform ratings, suggesting generally positive analyst sentiment.
MicroVision, Inc. Grades
Below is a summary of recent grades from recognized financial firms for MicroVision, Inc.:
| Grading Company | Action | New Grade | Date |
|---|---|---|---|
| D. Boral Capital | Maintain | Buy | 2025-12-16 |
| D. Boral Capital | Maintain | Buy | 2025-11-12 |
| WestPark Capital | Maintain | Buy | 2025-10-21 |
| WestPark Capital | Maintain | Buy | 2025-09-05 |
| D. Boral Capital | Maintain | Buy | 2025-09-02 |
| WestPark Capital | Maintain | Buy | 2025-08-27 |
| D. Boral Capital | Maintain | Buy | 2025-08-11 |
| D. Boral Capital | Maintain | Buy | 2025-05-21 |
| D. Boral Capital | Maintain | Buy | 2025-05-13 |
| WestPark Capital | Maintain | Buy | 2025-03-27 |
MicroVision consistently received buy ratings, reflecting a strong and stable positive outlook from its grading firms.
Which company has the best grades?
MicroVision has uniformly received buy ratings from its grading companies, while Ambarella shows a mix of buy, neutral, and outperform grades. This suggests MicroVision has a more consistently positive analyst consensus, which may influence investor confidence differently compared to Ambarella’s more varied ratings.
Strengths and Weaknesses
The table below summarizes the key strengths and weaknesses of Ambarella, Inc. (AMBA) and MicroVision, Inc. (MVIS) based on their latest financial and operational performance indicators.
| Criterion | Ambarella, Inc. (AMBA) | MicroVision, Inc. (MVIS) |
|---|---|---|
| Diversification | Limited product segmentation; focused offerings | Moderate diversification: contract, license, product revenues |
| Profitability | Negative net margin (-41.12%), declining ROIC; shedding value | Deep negative margins (-2063.78%), but improving ROIC trend; still shedding value |
| Innovation | Struggles to sustain economic moat; declining profitability | Innovation in licensing and product revenue growth; improving ROIC trend |
| Global presence | Not clearly diversified globally | Revenue streams suggest some global licensing reach |
| Market Share | Low asset turnover and profitability indicate weak competitive position | Very low asset turnover and high debt levels; weak market position |
In summary, both companies face significant profitability challenges with negative margins and unfavorable returns on invested capital. Ambarella shows a more stable financial structure but declining profitability, while MicroVision is improving its ROIC but remains heavily unprofitable with elevated debt. Caution and thorough risk assessment are advised before considering investment in either company.
Risk Analysis
Below is a comparative risk table for Ambarella, Inc. (AMBA) and MicroVision, Inc. (MVIS) based on the most recent available data:
| Metric | Ambarella, Inc. (AMBA) | MicroVision, Inc. (MVIS) |
|---|---|---|
| Market Risk | High beta of 1.975 indicating higher volatility | Beta of 1.557, moderately high volatility |
| Debt level | Very low debt-to-equity ratio (0.01), low financial risk | High debt-to-equity ratio (1.06), elevated financial risk |
| Regulatory Risk | Moderate, typical for semiconductor industry | Moderate, due to lidar and AR tech in automotive and consumer sectors |
| Operational Risk | Moderate, with negative profitability metrics | High, due to very weak profitability and operational inefficiencies |
| Environmental Risk | Low to moderate, industry exposure limited | Low to moderate, technology manufacturing with limited direct environmental impact |
| Geopolitical Risk | Moderate, US-based with global supply chain exposure | Moderate, US-based with global market dependencies |
The most impactful risks are Ambarella’s high market volatility and weak profitability despite strong liquidity and low debt, while MicroVision faces critical financial distress with high debt and poor operational performance, placing it in a distress zone per Altman Z-Score. Investors should exercise caution, particularly with MicroVision’s elevated bankruptcy risk and financial instability.
Which Stock to Choose?
Ambarella, Inc. (AMBA) shows a favorable income evolution with 25.78% revenue growth in 2025 and a 64.29% favorable income statement rating, despite negative profitability and declining ROIC. Financial ratios are mixed, with 42.86% favorable metrics, strong liquidity, low debt, but low profitability and a moderate overall rating of C+.
MicroVision, Inc. (MVIS) displays unfavorable income trends, with a sharp net margin decline of -2063.78% and 85.71% unfavorable income metrics, though revenue grew 51.97% overall. Financial ratios are mostly unfavorable (71.43%), with moderate debt levels and a very unfavorable overall rating of C-.
Investors with a tolerance for high risk seeking growth might see potential in MVIS’s improving ROIC trend despite value destruction, while those prioritizing a more balanced financial profile and stability could find AMBA’s stronger income growth and liquidity metrics more appealing, though both companies show considerable financial challenges.
Disclaimer: Investment carries a risk of loss of initial capital. The past performance is not a reliable indicator of future results. Be sure to understand risks before making an investment decision.
Go Further
I encourage you to read the complete analyses of Ambarella, Inc. and MicroVision, Inc. to enhance your investment decisions: