In the fast-evolving semiconductor industry, Micron Technology, Inc. (MU) and Ambarella, Inc. (AMBA) stand out as innovative players with distinct but overlapping market footprints. Micron dominates memory and storage solutions, while Ambarella leads in video processing chips with AI capabilities. Both companies leverage cutting-edge technology to capture growing demand, making their comparison essential for investors seeking growth and stability. This article will help you identify which company offers the most compelling investment opportunity.

Table of contents
Companies Overview
I will begin the comparison between Micron Technology and Ambarella by providing an overview of these two companies and their main differences.
Micron Technology Overview
Micron Technology, Inc. designs, manufactures, and sells memory and storage products worldwide. Operating through segments like Compute and Networking, Mobile, Storage, and Embedded, it offers DRAM, NAND, and NOR memory products under the Micron and Crucial brands. The company serves markets including cloud servers, enterprise, client, graphics, networking, automotive, industrial, and consumer. Founded in 1978, Micron is headquartered in Boise, Idaho, with a market cap of $373B.
Ambarella Overview
Ambarella, Inc. develops semiconductor solutions focused on video compression, image processing, and AI computer vision on system-on-a-chip platforms. Its products enable HD and ultra HD video for automotive cameras, security, robotics, industrial applications, and consumer devices like drones and sports cameras. Incorporated in 2004 and based in Santa Clara, California, Ambarella holds a market cap of $2.7B and targets OEMs and ODMs globally.
Key similarities and differences
Both companies operate in the semiconductor industry and supply advanced technology solutions globally. Micron focuses on memory and storage products across multiple market segments with a broad product portfolio and a large workforce. Ambarella specializes in video processing chips integrating AI capabilities for niche applications such as automotive and security cameras, with a smaller scale and workforce. Their business models differ in product focus and market diversification.
Income Statement Comparison
The table below compares the key income statement metrics for the fiscal year 2025 for Micron Technology, Inc. and Ambarella, Inc., highlighting their financial performance in revenue, profitability, and earnings per share.

| Metric | Micron Technology, Inc. | Ambarella, Inc. |
|---|---|---|
| Market Cap | 373B | 2.7B |
| Revenue | 37.4B | 285M |
| EBITDA | 18.5B | -101M |
| EBIT | 10.1B | -127M |
| Net Income | 8.54B | -117M |
| EPS | 7.65 | -2.84 |
| Fiscal Year | 2025 | 2025 |
Income Statement Interpretations
Micron Technology, Inc.
Micron Technology has shown strong revenue growth from 2021 to 2025, rising from $27.7B to $37.4B, with net income recovering from a loss in 2023 to $8.54B in 2025. Margins improved notably, with a 39.79% gross margin and 22.84% net margin in 2025. The latest year’s performance reflects robust growth and margin expansion after earlier volatility.
Ambarella, Inc.
Ambarella’s revenue increased from $223M in 2021 to $285M in 2025, accompanied by fluctuating but generally negative net income, reaching -$117M in 2025. While the gross margin is favorable at 60.5%, the EBIT margin remains deeply negative at -44.44%. The recent year shows revenue and gross profit growth, but net losses persist with negative margins.
Which one has the stronger fundamentals?
Micron Technology demonstrates stronger fundamentals, with consistent revenue and net income growth, favorable margins, and significant improvement in profitability. Ambarella shows positive revenue trends but sustained net losses and unfavorable EBIT and net margins, indicating weaker profitability despite some operational progress.
Financial Ratios Comparison
The table below presents a side-by-side comparison of key financial ratios for Micron Technology, Inc. (MU) and Ambarella, Inc. (AMBA) based on their most recent fiscal year data.
| Ratios | Micron Technology, Inc. (MU) FY 2025 | Ambarella, Inc. (AMBA) FY 2025 |
|---|---|---|
| ROE | 15.76% | -20.86% |
| ROIC | 12.12% | -21.96% |
| P/E | 15.94 | -27.05 |
| P/B | 2.51 | 5.64 |
| Current Ratio | 2.52 | 2.65 |
| Quick Ratio | 1.79 | 2.36 |
| D/E (Debt-to-Equity) | 0.28 | 0.009 |
| Debt-to-Assets | 18.45% | 0.76% |
| Interest Coverage | 20.69 | 0 |
| Asset Turnover | 0.45 | 0.41 |
| Fixed Asset Turnover | 0.79 | 19.96 |
| Payout Ratio | 6.11% | 0 |
| Dividend Yield | 0.38% | 0 |
Interpretation of the Ratios
Micron Technology, Inc.
Micron Technology shows predominantly favorable financial ratios, including strong net margin at 22.84% and return on equity of 15.76%, indicating efficient profitability and shareholder value creation. Concerns arise from an unfavorable weighted average cost of capital (WACC) and asset turnover ratios, suggesting some operational inefficiencies. The company pays a dividend, though the yield is modest at 0.38%, reflecting a cautious payout approach supported by stable free cash flow coverage.
Ambarella, Inc.
Ambarella’s ratios reveal several weaknesses with net margin at -41.12% and negative returns on equity and invested capital, indicating operational losses and poor capital efficiency. Although liquidity ratios and debt levels are favorable, the absence of dividend payments aligns with its current negative earnings and possible focus on reinvestment or growth initiatives. The company’s strong fixed asset turnover contrasts with low interest coverage, highlighting financial stress.
Which one has the best ratios?
Based on the ratio evaluations, Micron Technology presents a more favorable overall financial profile, with higher profitability and stronger returns despite some operational drawbacks. Ambarella’s unfavorable profitability and coverage ratios, combined with negative returns, position it less favorably. Therefore, Micron’s ratios appear better balanced for financial stability and shareholder returns.
Strategic Positioning
This section compares the strategic positioning of Micron Technology, Inc. and Ambarella, Inc., including market position, key segments, and exposure to technological disruption:
Micron Technology, Inc.
- Large market cap of $373B with significant competitive pressure in the semiconductor sector.
- Diverse segments: DRAM, NAND, various memory and storage products across multiple markets.
- Exposure to disruption through evolving memory technologies and cloud, automotive applications.
Ambarella, Inc.
- Smaller market cap of $2.7B; faces high beta indicating volatile competitive environment.
- Focused on HD and AI video processing chips for automotive, security, and consumer cameras.
- Exposed to disruption in AI, autonomous vehicles, and video processing technologies.
Micron Technology vs Ambarella Positioning
Micron has a diversified business model spanning multiple memory products and markets, providing broad industry exposure. Ambarella concentrates on video and AI semiconductor solutions, targeting niche segments with specialized technology focus, which may limit scale.
Which has the best competitive advantage?
Micron shows a slightly favorable moat with growing profitability, indicating improving competitive positioning. Ambarella has a very unfavorable moat with declining returns, signaling challenges in sustaining value and competitive advantage.
Stock Comparison
The stock price movements of Micron Technology, Inc. (MU) and Ambarella, Inc. (AMBA) over the past year highlight contrasting dynamics, with MU showing strong bullish acceleration and AMBA experiencing a more moderate upward trend with recent weakness.
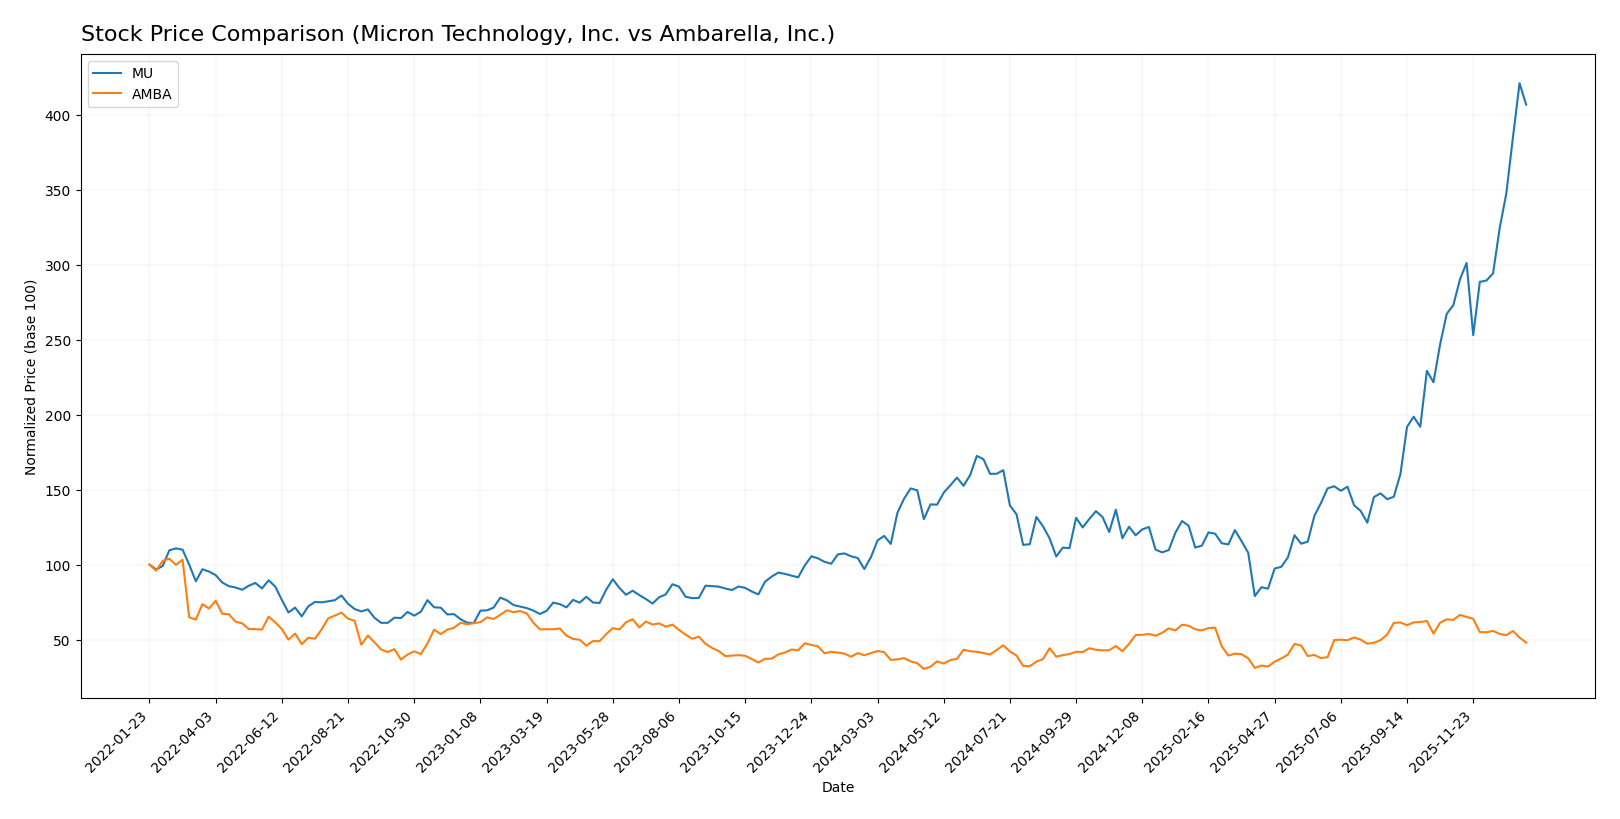
Trend Analysis
Micron Technology, Inc. (MU) exhibited a robust bullish trend over the past 12 months, with a 287.62% price increase and accelerating momentum. The stock’s volatility is notable, with a standard deviation of 57.56 and a trading range between 64.72 and 345.09.
Ambarella, Inc. (AMBA) showed a bullish trend overall with a 17.26% gain but experienced deceleration. Recent data reveals a negative price change of -23.97%, indicating short-term bearish pressure despite the 12.81 standard deviation.
Comparing both stocks, MU delivered the highest market performance over the last year, with significantly stronger gains and accelerating trend dynamics relative to AMBA’s moderate appreciation and recent decline.
Target Prices
The consensus target prices for Micron Technology, Inc. and Ambarella, Inc. reflect moderate upside potential based on analyst estimates.
| Company | Target High | Target Low | Consensus |
|---|---|---|---|
| Micron Technology, Inc. | 450 | 190 | 328.22 |
| Ambarella, Inc. | 115 | 80 | 97.5 |
Analysts see Micron’s stock price near its consensus target, indicating limited immediate upside, while Ambarella’s consensus target suggests a significant potential increase above the current price.
Analyst Opinions Comparison
This section compares analysts’ ratings and grades for Micron Technology, Inc. (MU) and Ambarella, Inc. (AMBA):
Rating Comparison
MU Rating
- Rating: B, assessed as Very Favorable by analysts.
- Discounted Cash Flow Score: 1, considered Very Unfavorable, indicating concerns on valuation.
- ROE Score: 4, Favorable, reflecting efficient profit generation from equity.
- ROA Score: 5, Very Favorable, indicating strong asset utilization.
- Debt To Equity Score: 3, Moderate, showing average financial risk.
- Overall Score: 3, Moderate, reflecting a balanced overall financial standing.
AMBA Rating
- Rating: C+, also assessed as Very Favorable by analysts.
- Discounted Cash Flow Score: 3, Moderate, suggesting a more balanced view on future cash flows.
- ROE Score: 1, Very Unfavorable, showing weak efficiency in generating profits from equity.
- ROA Score: 1, Very Unfavorable, signaling poor asset utilization.
- Debt To Equity Score: 4, Favorable, indicating lower financial risk and stronger balance sheet.
- Overall Score: 2, Moderate, slightly lower overall financial standing than MU.
Which one is the best rated?
Based strictly on the provided data, MU holds a better overall rating (B) and outperforms AMBA in profitability and asset utilization scores. AMBA scores better only in debt-to-equity but has a lower overall score and weaker returns.
Scores Comparison
Here is a comparison of the Altman Z-Score and Piotroski Score for both companies:
MU Scores
- Altman Z-Score: 10.5, indicating a safe zone with low bankruptcy risk.
- Piotroski Score: 7, reflecting strong financial health.
AMBA Scores
- Altman Z-Score: 10.7, indicating a safe zone with low bankruptcy risk.
- Piotroski Score: 3, indicating very weak financial strength.
Which company has the best scores?
Both MU and AMBA have Altman Z-Scores in the safe zone, showing low bankruptcy risk. However, MU’s Piotroski Score is significantly higher, indicating stronger financial health compared to AMBA’s very weak rating.
Grades Comparison
Here is a comparison of recent grades for Micron Technology, Inc. and Ambarella, Inc.:
Micron Technology, Inc. Grades
The table below summarizes recent grades assigned by reputable grading companies for Micron Technology, Inc.:
| Grading Company | Action | New Grade | Date |
|---|---|---|---|
| Keybanc | Maintain | Overweight | 2026-01-13 |
| B of A Securities | Maintain | Buy | 2026-01-13 |
| Lynx Global | Maintain | Buy | 2026-01-12 |
| Mizuho | Maintain | Outperform | 2026-01-09 |
| UBS | Maintain | Buy | 2026-01-07 |
| Piper Sandler | Maintain | Overweight | 2026-01-07 |
| Piper Sandler | Maintain | Overweight | 2025-12-18 |
| Barclays | Maintain | Overweight | 2025-12-18 |
| Keybanc | Maintain | Overweight | 2025-12-18 |
| Wolfe Research | Maintain | Outperform | 2025-12-18 |
Micron Technology’s grades predominantly reflect strong buy-side sentiment, consistently rated as Buy, Overweight, or Outperform.
Ambarella, Inc. Grades
The table below summarizes recent grades assigned by reputable grading companies for Ambarella, Inc.:
| Grading Company | Action | New Grade | Date |
|---|---|---|---|
| B of A Securities | Maintain | Neutral | 2025-11-26 |
| Needham | Maintain | Buy | 2025-11-26 |
| Stifel | Maintain | Buy | 2025-11-26 |
| Rosenblatt | Maintain | Buy | 2025-11-26 |
| Rosenblatt | Maintain | Buy | 2025-11-24 |
| Stifel | Maintain | Buy | 2025-08-29 |
| Needham | Maintain | Buy | 2025-08-29 |
| Northland Capital Markets | Maintain | Outperform | 2025-08-29 |
| Morgan Stanley | Maintain | Overweight | 2025-08-29 |
| Oppenheimer | Maintain | Perform | 2025-08-29 |
Ambarella’s grades show a mix of Buy and Outperform ratings, tempered by a Neutral and Perform rating, indicating moderate positive sentiment.
Which company has the best grades?
Micron Technology has received more consistent and higher-grade ratings such as Overweight and Outperform from multiple top-tier firms, suggesting stronger analyst conviction. Ambarella, while generally rated Buy, has some Neutral and Perform grades, indicating slightly more cautious views. These grading patterns may influence investors’ perception of relative confidence and expected performance.
Strengths and Weaknesses
Below is a comparison of key strengths and weaknesses for Micron Technology, Inc. (MU) and Ambarella, Inc. (AMBA) based on the most recent financial and operational data.
| Criterion | Micron Technology, Inc. (MU) | Ambarella, Inc. (AMBA) |
|---|---|---|
| Diversification | Strong diversification with multiple product lines: DRAM ($28.6B) and NAND ($8.5B) in 2025 | Limited product diversification; focused mainly on semiconductor solutions |
| Profitability | Favorable profitability: net margin 22.8%, ROIC 12.1%, positive ROE 15.8% | Unfavorable profitability: net margin -41.1%, ROIC -22.0%, negative ROE -20.9% |
| Innovation | Moderate innovation evidenced by growing ROIC trend (+8.2%) | Innovation challenges with sharply declining ROIC (-81.3%) and value destruction |
| Global presence | Large global presence with significant revenue from multiple segments and regions | Smaller global footprint, less diversified markets |
| Market Share | Significant market share in memory products, especially DRAM | Smaller market share and lower asset turnover |
Key takeaways: Micron Technology shows solid profitability and a growing return on invested capital, supported by diversified product segments and a strong market position in memory chips. Ambarella faces serious profitability and innovation challenges, with declining returns and limited diversification, posing higher investment risks.
Risk Analysis
Below is a comparative risk overview of Micron Technology, Inc. (MU) and Ambarella, Inc. (AMBA) based on the most recent 2025 data.
| Metric | Micron Technology, Inc. (MU) | Ambarella, Inc. (AMBA) |
|---|---|---|
| Market Risk | Beta 1.50 (moderate volatility) | Beta 1.95 (high volatility) |
| Debt level | Low debt-to-equity 0.28 (favorable) | Very low debt-to-equity 0.01 (favorable) |
| Regulatory Risk | Moderate (semiconductor industry regulations) | Moderate (semiconductor/video tech regulations) |
| Operational Risk | Moderate, large-scale manufacturing complexity | Higher due to smaller size and niche focus |
| Environmental Risk | Moderate, manufacturing impacts | Lower, primarily design-focused |
| Geopolitical Risk | High, global supply chain exposure | Moderate, less global footprint |
The most likely and impactful risks for Micron stem from geopolitical tensions affecting its global supply chain and moderate operational complexity in manufacturing. Ambarella faces higher market volatility and operational risks due to its smaller scale and niche product line, alongside weak profitability signaling financial stress despite low leverage. Caution is advised when allocating capital, with Micron showing more stability but exposed to international risks.
Which Stock to Choose?
Micron Technology, Inc. (MU) shows strong income growth with a 48.85% revenue increase in 2025 and favorable profitability metrics, including a 22.84% net margin and 15.76% ROE. Its debt levels are well managed, and the overall rating is very favorable with a B grade.
Ambarella, Inc. (AMBA) exhibits positive revenue growth at 25.78% in 2025 but suffers from negative net margin (-41.12%) and ROE (-20.86%). Despite low debt ratios and a C+ rating, its financial ratios and profitability remain unfavorable, reflecting ongoing value destruction.
Considering ratings and financial evaluations, MU’s favorable income statement and ratios might appeal to investors seeking quality and growth, while AMBA’s profile could be more suited to risk-tolerant investors focusing on potential turnaround opportunities despite current challenges.
Disclaimer: Investment carries a risk of loss of initial capital. The past performance is not a reliable indicator of future results. Be sure to understand risks before making an investment decision.
Go Further
I encourage you to read the complete analyses of Micron Technology, Inc. and Ambarella, Inc. to enhance your investment decisions: