Home > Comparison > Technology > AMBA vs MXL
The strategic rivalry between Ambarella, Inc. and MaxLinear, Inc. shapes the semiconductor industry’s evolution. Ambarella excels as a video-centric SoC innovator focused on AI-driven imaging solutions. MaxLinear operates as a diversified communications SoC provider targeting broad connectivity markets. This analysis pits Ambarella’s specialized growth against MaxLinear’s diversified approach to reveal which offers superior risk-adjusted returns for a balanced technology portfolio.

Table of contents
Companies Overview
Two influential players in the semiconductor space, Ambarella and MaxLinear, shape the future of connected devices and communication technologies.
Ambarella, Inc.: Innovator in Video Processing Semiconductors
Ambarella dominates the video processing semiconductor market by integrating HD video compression, AI vision, and image processing on single chips. Its core revenue stems from system-on-a-chip solutions for automotive cameras, security, and robotics. In 2026, Ambarella strategically emphasizes advanced driver assistance and autonomous vehicle camera systems, leveraging low power consumption and differentiated functionality.
MaxLinear, Inc.: Leader in RF and Mixed-Signal Communication SoCs
MaxLinear specializes in RF and mixed-signal SoCs powering connected home devices and communication infrastructure. Its revenue derives from broadband radio transceivers, data converters, and embedded systems used in modems, routers, and 4G/5G infrastructure. In 2026, MaxLinear focuses on expanding high-speed communication platforms across wired and wireless networks, targeting scalable, integrated end-to-end solutions.
Strategic Collision: Similarities & Divergences
Ambarella and MaxLinear share a semiconductor foundation but diverge sharply in focus—Ambarella pursues a closed ecosystem in video-centric AI chips, while MaxLinear champions open infrastructure for communication networks. Their primary battleground is the expanding IoT and wireless connectivity market. Ambarella’s niche in automotive AI contrasts with MaxLinear’s broad communication scope, creating distinct risk and growth profiles for investors.
Income Statement Comparison
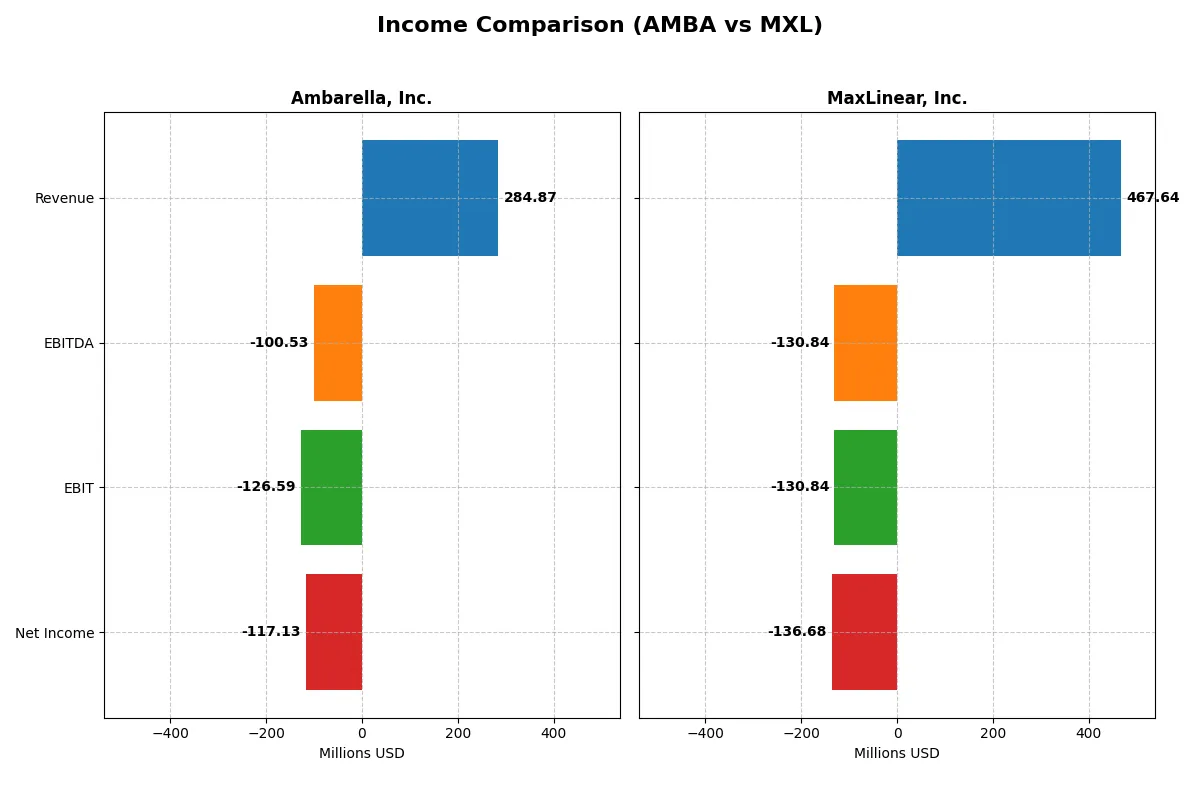
This comparison dissects the core profitability and scalability of both corporate engines to reveal who dominates the bottom line:
| Metric | Ambarella, Inc. (AMBA) | MaxLinear, Inc. (MXL) |
|---|---|---|
| Revenue | 285M | 468M |
| Cost of Revenue | 113M | 202M |
| Operating Expenses | 299M | 393M |
| Gross Profit | 172M | 266M |
| EBITDA | -101M | -131M |
| EBIT | -127M | -131M |
| Interest Expense | 0 | 10M |
| Net Income | -117M | -137M |
| EPS | -2.84 | -1.58 |
| Fiscal Year | 2025 | 2025 |
Income Statement Analysis: The Bottom-Line Duel
This income statement comparison reveals which company runs a more efficient and sustainable corporate engine from revenue to net income.
Ambarella, Inc. Analysis
Ambarella’s revenue climbed to $285M in 2025, up 25.8% from 2024, showing solid top-line growth. Gross margin remains healthy at 60.5%, but net losses persist with a -41.1% net margin. Despite negative earnings, the company improved its EBIT margin by 18%, signaling better operational momentum and expense control.
MaxLinear, Inc. Analysis
MaxLinear reported $468M revenue in 2025, growing 29.7% year-over-year, but overall revenue declined 47.6% over five years. Its gross margin stands at 56.8%, slightly lower than Ambarella’s, while net margin at -29.2% shows ongoing losses. MaxLinear’s EBIT margin improved by 42.6%, reflecting meaningful operational leverage and margin recovery.
Margin Strength vs. Growth Trajectory
Ambarella sustains superior gross margin and steady revenue growth, yet struggles with persistent net losses. MaxLinear offers higher revenue scale and sharper EBIT margin improvement but faces deeper structural net losses and long-term revenue decline. Ambarella’s profile favors margin resilience, while MaxLinear appeals with stronger operational momentum—investors must weigh stability against growth potential.
Financial Ratios Comparison
These vital ratios act as a diagnostic tool to expose the underlying fiscal health, valuation premiums, and capital efficiency of the companies compared below:
| Ratios | Ambarella, Inc. (AMBA) | MaxLinear, Inc. (MXL) |
|---|---|---|
| ROE | -20.9% | -47.5% |
| ROIC | -21.9% | -24.3% |
| P/E | -27.1 | -6.7 |
| P/B | 5.64 | 3.20 |
| Current Ratio | 2.65 | 1.77 |
| Quick Ratio | 2.36 | 1.28 |
| D/E (Debt/Equity) | 0.009 | 0.29 |
| Debt-to-Assets | 0.008 | 0.17 |
| Interest Coverage | 0 | -15.5 |
| Asset Turnover | 0.41 | 0.42 |
| Fixed Asset Turnover | 20.0 | 4.65 |
| Payout Ratio | 0 | 0 |
| Dividend Yield | 0 | 0 |
| Fiscal Year | 2025 | 2024 |
Efficiency & Valuation Duel: The Vital Signs
Financial ratios serve as a company’s DNA, unveiling hidden operational strengths and risks that raw numbers might mask.
Ambarella, Inc.
Ambarella shows negative profitability with a -20.86% ROE and a -41.12% net margin, signaling operational challenges. The stock trades at a favorable negative P/E, suggesting market skepticism or losses priced in. Ambarella maintains a strong current ratio of 2.65 and reinvests heavily in R&D, prioritizing growth over dividends.
MaxLinear, Inc.
MaxLinear suffers deeper profitability issues, with a -47.49% ROE and a -68.01% net margin, indicating severe earnings strain. Its P/E is also negative but less extreme than Ambarella’s, reflecting market uncertainty. The company holds a decent liquidity position (current ratio 1.77) and focuses on R&D rather than shareholder payouts, aiming to rebuild its business.
Operational Fragility vs. Growth Ambition
Both companies face unfavorable profitability and high risk, evidenced by negative returns and elevated valuations. Ambarella’s stronger liquidity and aggressive R&D spending offset some concerns, while MaxLinear’s weaker margins and lower liquidity heighten risk. Investors seeking a slightly more stable profile might lean toward Ambarella’s balance of cash and growth focus.
Which one offers the Superior Shareholder Reward?
Ambarella (AMBA) and MaxLinear (MXL) both forgo dividends, focusing instead on reinvestment and buybacks. AMBA lacks buybacks, reflecting strained margins and negative net income, while MXL shows modest buyback activity despite recent losses. MXL’s lower price-to-sales ratio (4.6 vs. AMBA’s 11.1) and improving operating cash flow signal a more sustainable model. I see MXL’s balanced capital allocation and potential for margin recovery as offering superior long-term shareholder returns in 2026.
Comparative Score Analysis: The Strategic Profile
The radar chart reveals the fundamental DNA and trade-offs of Ambarella, Inc. and MaxLinear, Inc., highlighting their financial strengths and weaknesses:
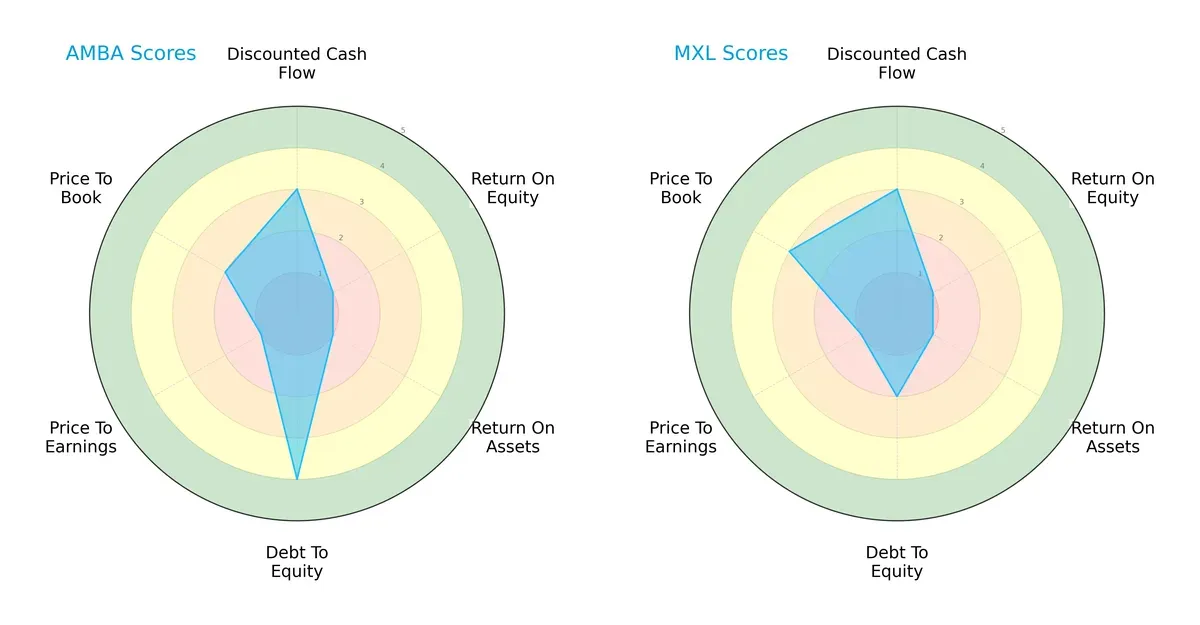
Both companies share moderate discounted cash flow scores, signaling similar market expectations on valuation. Ambarella shows a stronger balance sheet with a debt-to-equity score of 4 versus MaxLinear’s 2, indicating lower financial risk. However, both struggle with profitability metrics, scoring very low on ROE and ROA, suggesting operational challenges. MaxLinear edges out slightly on price-to-book valuation, implying marginally better market pricing. Overall, Ambarella presents a more balanced financial profile, while MaxLinear depends on valuation nuances amid weaker leverage metrics.
Bankruptcy Risk: Solvency Showdown
Ambarella’s Altman Z-Score of 10.14 places it firmly in the safe zone, while MaxLinear’s 2.13 signals caution in the grey zone:
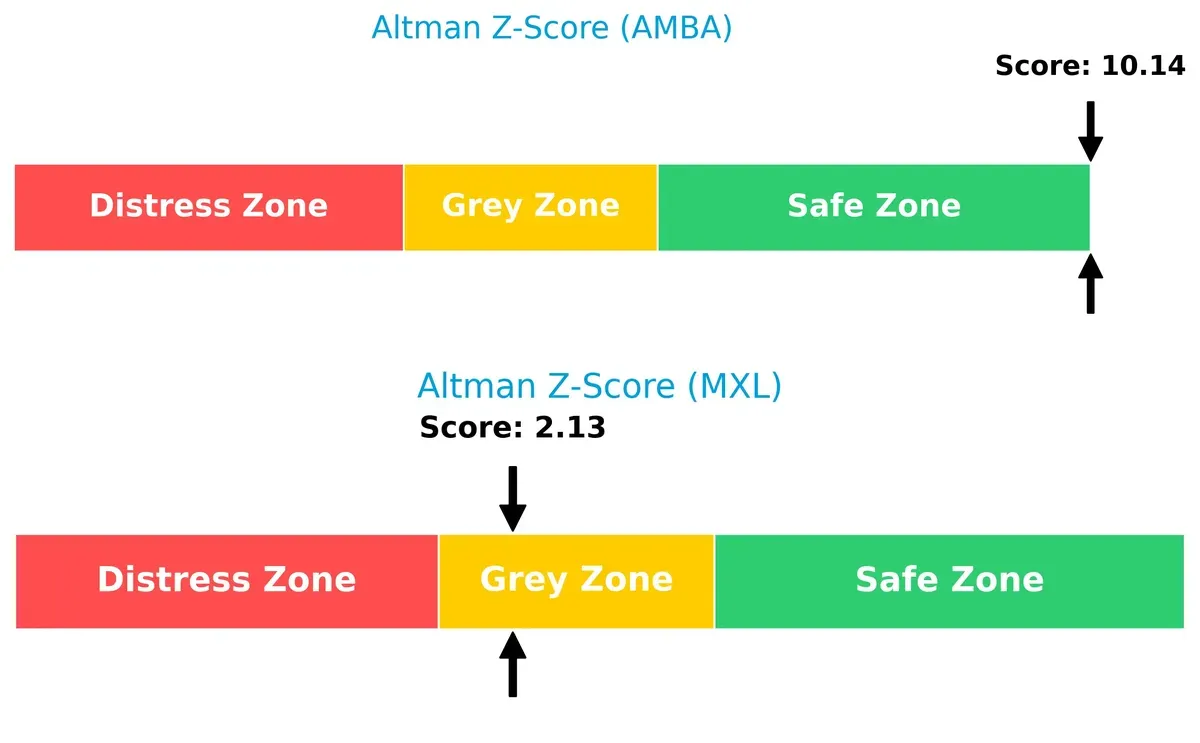
Ambarella’s robust solvency suggests resilience against economic downturns. MaxLinear’s borderline score highlights elevated bankruptcy risk, demanding investor vigilance amid current market cycles.
Financial Health: Quality of Operations
Both firms record a Piotroski F-Score of 3, reflecting very weak financial health:
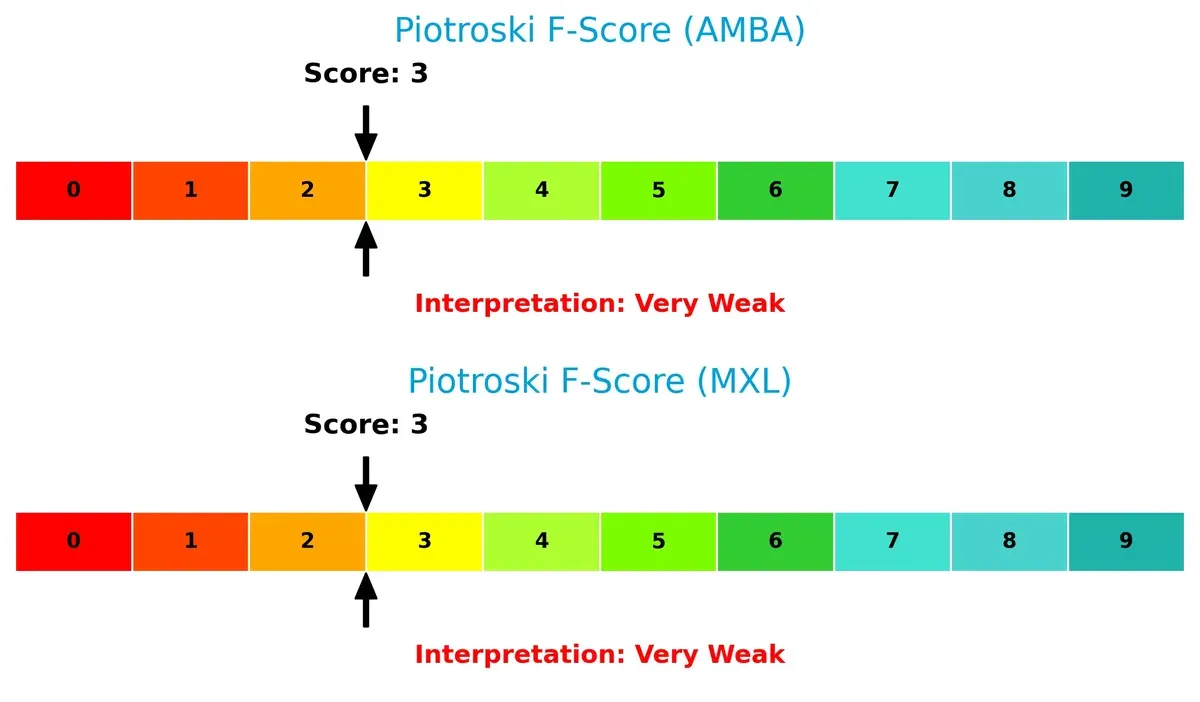
Such low scores flag potential operational or financial red flags, with neither company demonstrating strong internal metrics. Investors should approach both cautiously, as these scores imply limited quality in earnings, liquidity, and efficiency measures.
How are the two companies positioned?
This section dissects Ambarella and MaxLinear’s operational DNA by comparing their revenue distribution and internal strengths and weaknesses. The goal is to confront their economic moats to identify which model offers the most resilient, sustainable competitive advantage today.
Revenue Segmentation: The Strategic Mix
This visual comparison dissects how Ambarella, Inc. and MaxLinear, Inc. diversify their income streams and reveals where their primary sector bets lie:
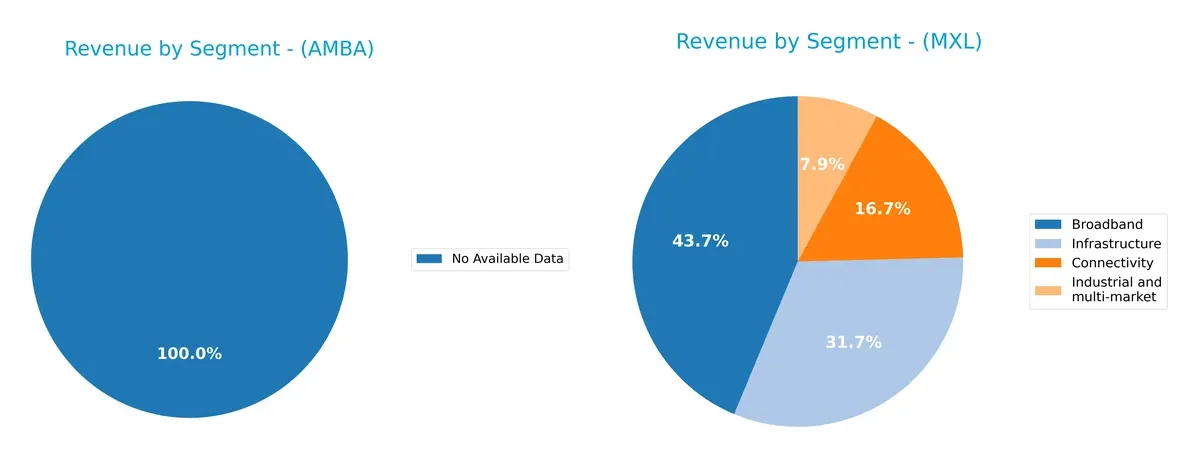
Ambarella lacks available segmentation data, preventing direct comparison. MaxLinear pivots on Broadband, which dwarfs other segments at $204M in 2025. Connectivity ($78M), Infrastructure ($148M), and Industrial ($37M) form a moderate diversification. MaxLinear’s reliance on Broadband anchors its strategy in communications infrastructure but poses concentration risks if market dynamics shift. The balanced secondary segments provide some hedge against volatility.
Strengths and Weaknesses Comparison
This table compares the Strengths and Weaknesses of Ambarella, Inc. (AMBA) and MaxLinear, Inc. (MXL):
AMBA Strengths
- Strong liquidity with current ratio 2.65 and quick ratio 2.36
- Very low debt-to-equity at 0.01 supports financial stability
- High fixed asset turnover of 19.96 indicates efficient asset use
- Favorable price-to-earnings despite losses suggests market optimism
MXL Strengths
- Diversified revenue across Broadband, Connectivity, Industrial, Infrastructure segments
- Favorable current ratio (1.77) and quick ratio (1.28) support liquidity
- Moderate debt-to-equity (0.29) and debt-to-assets (17.23%) signal manageable leverage
- Fixed asset turnover of 4.65 shows decent asset efficiency
- Favorable price-to-earnings ratio reflects some market confidence
AMBA Weaknesses
- Negative profitability metrics: net margin -41.12%, ROE -20.86%, ROIC -21.96%
- High WACC at 12.99% may pressure returns
- Poor interest coverage at zero suggests risk in servicing debt
- High price-to-book at 5.64 may indicate overvaluation
- Zero dividend yield could deter income-focused investors
- Low asset turnover (0.41) signals inefficiency
MXL Weaknesses
- Significantly negative profitability with net margin -68.01%, ROE -47.49%, ROIC -24.31%
- WACC at 11.7% remains high versus returns
- Negative interest coverage (-13.01) raises solvency concerns
- Lower liquidity ratios than AMBA limit short-term flexibility
- Zero dividend yield limits shareholder returns
- Asset turnover (0.42) also signals operational inefficiency
Both companies face profitability challenges with negative margins and returns below their cost of capital. AMBA exhibits stronger liquidity and lower leverage, while MXL benefits from broader product diversification. These factors shape their financial resilience and strategic options in a demanding market environment.
The Moat Duel: Analyzing Competitive Defensibility
A structural moat is the only thing protecting long-term profits from being eroded by competition. Let’s examine how these two semiconductor firms defend their turf:
Ambarella, Inc.: AI-Driven Product Innovation
Ambarella’s moat centers on intangible assets and specialized AI chip designs, reflected in strong gross margins near 60%. However, its declining ROIC signals weakening profitability, although new automotive and security camera markets could deepen its moat in 2026.
MaxLinear, Inc.: Integrated Communication Systems
MaxLinear leverages a cost advantage through integrated RF and mixed-signal SoCs, achieving solid gross margins near 57%. Its ROIC also declines sharply, yet expanding 5G infrastructure and data center solutions offer a path to reinforce its competitive edge.
Innovation Intensity vs. Integration Scale: Who Holds the Moat Stronger?
Both firms face deteriorating ROICs, indicating shrinking economic moats. Yet, Ambarella’s focus on AI and vision processing offers a deeper moat than MaxLinear’s broader but less specialized communications approach. Ambarella appears better positioned to defend and grow its market share.
Which stock offers better returns?
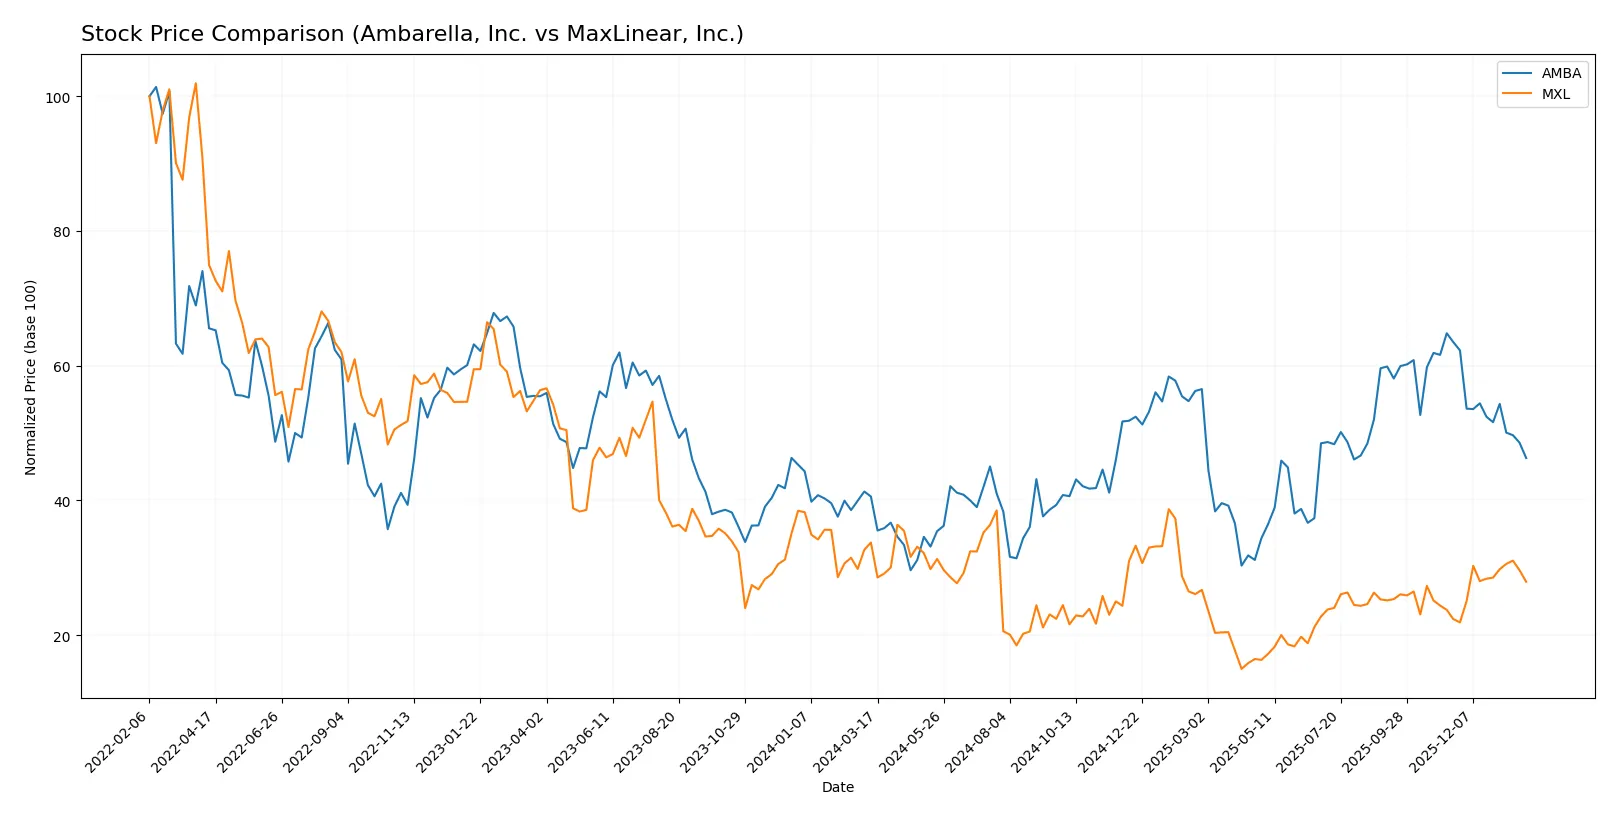
The past year saw Ambarella, Inc. gain 14.1% overall, showing a decelerating bullish trend, while MaxLinear, Inc. declined 17.3%, but with accelerating bearish momentum.
Trend Comparison
Ambarella’s stock rose 14.1% over 12 months, marking a bullish trend with decelerating price gains and a high volatility level (12.79% std deviation). Its recent three-month stretch shows a sharp 27.1% drop, indicating short-term weakness.
MaxLinear’s stock fell 17.3% over the same 12 months, confirming a bearish trend with accelerating losses and lower volatility (3.37%). However, it posted a 24.8% price rebound recently, signaling a moderate recovery phase.
Ambarella outperformed MaxLinear in overall market returns despite recent declines. Ambarella’s bullish annual trend contrasts MaxLinear’s bearish trend, making it the stronger performer over the last year.
Target Prices
Analysts present a cautiously optimistic target consensus for Ambarella and MaxLinear.
| Company | Target Low | Target High | Consensus |
|---|---|---|---|
| Ambarella, Inc. | 80 | 115 | 97.5 |
| MaxLinear, Inc. | 15 | 25 | 21 |
Ambarella’s target consensus at $97.5 significantly exceeds its current $64 price, signaling strong upside potential. MaxLinear’s $21 consensus also suggests moderate appreciation from its $17.35 market price.

Don’t Let Luck Decide Your Entry Point
Optimize your entry points with our advanced ProRealTime indicators. You’ll get efficient buy signals with precise price targets for maximum performance. Start outperforming now!
How do institutions grade them?
Ambarella, Inc. Grades
The following table shows recent grades assigned by reputable institutions to Ambarella, Inc.:
| Grading Company | Action | New Grade | Date |
|---|---|---|---|
| Stifel | Maintain | Buy | 2025-11-26 |
| Needham | Maintain | Buy | 2025-11-26 |
| B of A Securities | Maintain | Neutral | 2025-11-26 |
| Rosenblatt | Maintain | Buy | 2025-11-26 |
| Rosenblatt | Maintain | Buy | 2025-11-24 |
| Oppenheimer | Maintain | Perform | 2025-08-29 |
| B of A Securities | Maintain | Neutral | 2025-08-29 |
| Needham | Maintain | Buy | 2025-08-29 |
| Rosenblatt | Maintain | Buy | 2025-08-29 |
| Morgan Stanley | Maintain | Overweight | 2025-08-29 |
MaxLinear, Inc. Grades
Below are recent grades given by recognized institutions to MaxLinear, Inc.:
| Grading Company | Action | New Grade | Date |
|---|---|---|---|
| Wells Fargo | Maintain | Equal Weight | 2026-01-30 |
| Benchmark | Maintain | Buy | 2026-01-16 |
| Benchmark | Maintain | Buy | 2025-10-24 |
| Benchmark | Maintain | Buy | 2025-10-17 |
| Benchmark | Maintain | Buy | 2025-09-02 |
| Loop Capital | Maintain | Hold | 2025-08-04 |
| Wells Fargo | Maintain | Equal Weight | 2025-07-24 |
| Benchmark | Maintain | Buy | 2025-07-24 |
| Susquehanna | Maintain | Neutral | 2025-07-24 |
| Susquehanna | Maintain | Neutral | 2025-07-22 |
Which company has the best grades?
Ambarella, Inc. holds predominantly Buy and Overweight ratings, indicating stronger institutional confidence. MaxLinear, Inc. mostly receives Buy and Equal Weight grades with some Neutral and Hold ratings, suggesting a more cautious stance. This contrast could influence investor perception of growth potential and risk.
Risks specific to each company
In the challenging 2026 market environment, the following categories highlight critical pressure points and systemic threats facing both Ambarella, Inc. and MaxLinear, Inc.:
1. Market & Competition
Ambarella, Inc.
- Faces intense semiconductor competition with a focus on AI-driven video solutions, risking margin pressure.
MaxLinear, Inc.
- Competes in mixed-signal and RF SoCs amid evolving 5G and broadband demands, facing rapid tech shifts.
2. Capital Structure & Debt
Ambarella, Inc.
- Extremely low debt with a D/E of 0.01, indicating strong balance sheet conservatism.
MaxLinear, Inc.
- Higher leverage at 0.29 D/E, which adds financial risk but supports growth initiatives.
3. Stock Volatility
Ambarella, Inc.
- Beta near 1.95 signals high volatility, sensitive to tech market cycles and earnings swings.
MaxLinear, Inc.
- Beta of 1.77 also indicates elevated volatility, but slightly less reactive than Ambarella.
4. Regulatory & Legal
Ambarella, Inc.
- Exposed to evolving data privacy and AI usage regulations affecting video processing products.
MaxLinear, Inc.
- Faces regulatory scrutiny in communications infrastructure, especially regarding 5G deployment and export controls.
5. Supply Chain & Operations
Ambarella, Inc.
- Semiconductor supply constraints and reliance on external foundries may disrupt production.
MaxLinear, Inc.
- Complex supply chain for RF components risks delays amid geopolitical trade tensions.
6. ESG & Climate Transition
Ambarella, Inc.
- Growing pressure to improve energy efficiency in AI chips and reduce carbon footprint.
MaxLinear, Inc.
- Must address environmental impact of manufacturing and align with green communications standards.
7. Geopolitical Exposure
Ambarella, Inc.
- Limited direct exposure but vulnerable to US-China tech tensions impacting supply chains.
MaxLinear, Inc.
- Higher sensitivity to geopolitical risks due to broader international infrastructure markets.
Which company shows a better risk-adjusted profile?
Ambarella’s most impactful risk lies in its market competition and profitability challenges, evidenced by negative margins and returns despite a strong balance sheet. MaxLinear’s key risk is its higher leverage combined with operational vulnerabilities amid regulatory and geopolitical pressures. Ambarella’s ultra-low debt and better Altman Z-score (10.14 vs. 2.13) suggest a superior risk-adjusted profile despite volatility. MaxLinear’s financial distress risk remains moderate, underscoring cautious investor scrutiny.
Final Verdict: Which stock to choose?
Ambarella, Inc. shines with its unmatched efficiency in managing working capital and maintaining a strong liquidity buffer. Its relentless investment in R&D signals a future-ready tech edge. However, its persistent negative returns on capital remain a point of vigilance. Ambarella fits best in an aggressive growth portfolio willing to tolerate volatility for innovation-led upside.
MaxLinear, Inc. boasts a strategic moat through its recurring revenue streams and solid balance sheet discipline. Compared to Ambarella, it offers better current ratio stability but faces challenges in profitability and capital returns. MaxLinear appeals to investors seeking GARP (Growth at a Reasonable Price) exposure with a more measured risk appetite.
If you prioritize aggressive innovation and capitalizing on cutting-edge R&D, Ambarella is the compelling choice due to its operational efficiency and forward-looking investments. However, if you seek steadier growth with a defensive financial profile, MaxLinear offers better stability and recurring revenue resilience despite its profitability headwinds. Both scenarios require careful risk management given their current value destruction trends.
Disclaimer: Investment carries a risk of loss of initial capital. The past performance is not a reliable indicator of future results. Be sure to understand risks before making an investment decision.
Go Further
I encourage you to read the complete analyses of Ambarella, Inc. and MaxLinear, Inc. to enhance your investment decisions: