Marvell Technology, Inc. and Ambarella, Inc. are two prominent players in the semiconductor industry, each focusing on innovative chip solutions but targeting distinct yet overlapping markets. Marvell excels in networking and storage integrated circuits, while Ambarella specializes in video processing and AI-driven vision chips. This comparison explores their market positions and innovation strategies to help you decide which company holds the most promise for your investment portfolio.

Table of contents
Companies Overview
I will begin the comparison between Marvell Technology, Inc. and Ambarella, Inc. by providing an overview of these two companies and their main differences.
Marvell Technology, Inc. Overview
Marvell Technology, Inc. designs, develops, and sells a broad portfolio of integrated circuits including Ethernet solutions, processors, ASICs, and storage controllers. It serves multiple markets with products supporting various host interfaces and fiber channel connectivity. Founded in 1995 and headquartered in Wilmington, Delaware, Marvell holds a significant position in the semiconductor industry with global operations spanning Asia and the United States.
Ambarella, Inc. Overview
Ambarella, Inc. specializes in semiconductor solutions for high-definition video processing, compression, and AI-powered computer vision algorithms. Its system-on-a-chip designs target automotive cameras, security systems, robotics, and consumer electronics. Founded in 2004 and based in Santa Clara, California, Ambarella focuses on delivering integrated video and image quality solutions with an emphasis on low power consumption for diverse end markets.
Key similarities and differences
Both companies operate in the semiconductor sector with a focus on highly specialized integrated circuits. Marvell offers a wider range of products including networking, storage, and processing solutions, whereas Ambarella concentrates on video-related chips with AI capabilities tailored to automotive and security applications. While Marvell is larger with over 7K employees and a $69B market cap, Ambarella is smaller, employing under 1K staff and holding a market cap around $2.7B.
Income Statement Comparison
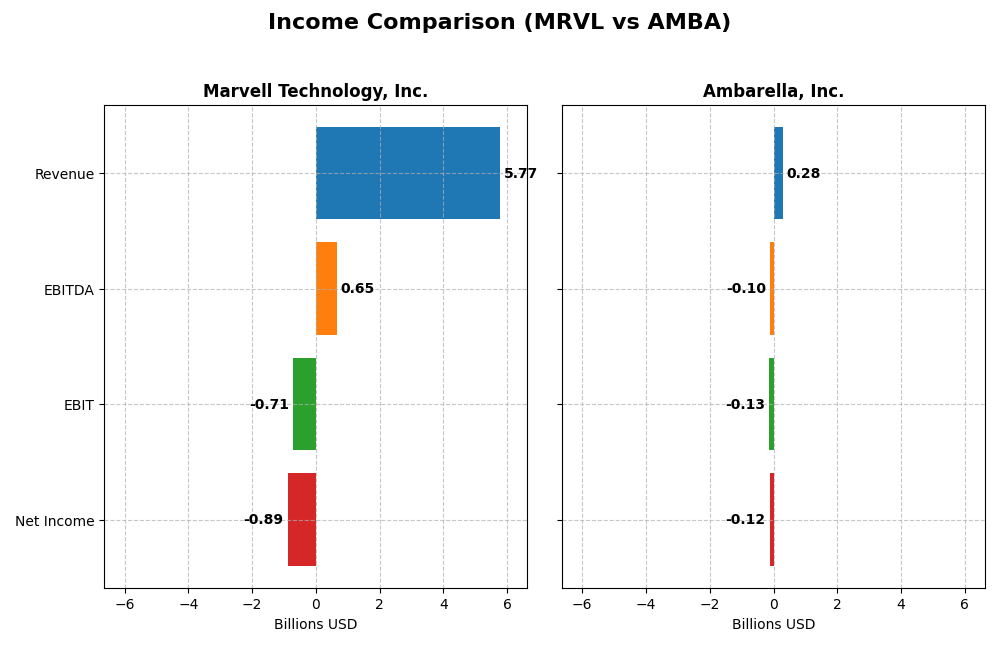
This table compares the key income statement metrics for Marvell Technology, Inc. and Ambarella, Inc. based on their most recent fiscal year data.
| Metric | Marvell Technology, Inc. | Ambarella, Inc. |
|---|---|---|
| Market Cap | 69.3B | 2.7B |
| Revenue | 5.77B | 285M |
| EBITDA | 652M | -101M |
| EBIT | -705M | -127M |
| Net Income | -885M | -117M |
| EPS | -1.02 | -2.84 |
| Fiscal Year | 2025 | 2025 |
Income Statement Interpretations
Marvell Technology, Inc.
Marvell’s revenue nearly doubled from 2021 to 2025, reaching $5.77B in 2025, but net income remained negative, worsening overall. Gross margins stayed strong at 41.31%, though EBIT and net margins were unfavorable at -12.23% and -15.35%. The latest year showed moderate revenue growth of 4.7%, yet operating income declined significantly.
Ambarella, Inc.
Ambarella’s revenue grew steadily by 27.75% over the period, hitting $285M in 2025, but net income stayed negative, shrinking overall. Gross margin was favorable at 60.5%, while EBIT and net margins were deeply negative at -44.44% and -41.12%. The recent year reported strong revenue and profit margin improvements, signaling operational progress.
Which one has the stronger fundamentals?
Ambarella displays stronger fundamentals in terms of gross margin and recent growth across revenue, EBIT, and net margin, with a predominantly favorable income statement evaluation. Marvell shows higher absolute revenue but faces persistent negative net income and declining EBIT margins, resulting in a less favorable overall income statement profile.
Financial Ratios Comparison
The table below presents a clear comparison of key financial ratios for Marvell Technology, Inc. and Ambarella, Inc. based on their most recent fiscal year data.
| Ratios | Marvell Technology, Inc. (2025) | Ambarella, Inc. (2025) |
|---|---|---|
| ROE | -6.6% | -20.9% |
| ROIC | -3.9% | -22.0% |
| P/E | -110.4 | -27.1 |
| P/B | 7.27 | 5.64 |
| Current Ratio | 1.54 | 2.65 |
| Quick Ratio | 1.03 | 2.36 |
| D/E | 0.32 | 0.009 |
| Debt-to-Assets | 21.5% | 0.8% |
| Interest Coverage | -3.80 | 0 |
| Asset Turnover | 0.29 | 0.41 |
| Fixed Asset Turnover | 5.56 | 19.96 |
| Payout ratio | -23.4% | 0 |
| Dividend yield | 0.21% | 0 |
Interpretation of the Ratios
Marvell Technology, Inc.
Marvell Technology shows mixed financial ratios with 42.86% favorable and 57.14% unfavorable. Key weaknesses include negative net margin (-15.35%), negative return on equity (-6.59%), and poor interest coverage (-3.72), indicating profitability and financial stress concerns. The company pays a modest dividend, with a low yield of 0.21%, suggesting limited shareholder returns amid these challenges.
Ambarella, Inc.
Ambarella’s ratios reflect similar challenges, with 42.86% favorable and 57.14% unfavorable metrics. The firm suffers from a substantial negative net margin (-41.12%) and return on equity (-20.86%), alongside a zero dividend yield, indicating no distributions to shareholders. Ambarella prioritizes reinvestment and R&D, consistent with its lack of dividend payments and focus on growth.
Which one has the best ratios?
Both companies exhibit unfavorable overall ratio profiles, each with a 57.14% share of negative metrics. Marvell has slightly higher leverage but offers a marginal dividend yield, while Ambarella shows stronger liquidity and minimal debt but no dividends. Neither stands out decisively; both face significant profitability and return issues.
Strategic Positioning
This section compares the strategic positioning of Marvell Technology, Inc. and Ambarella, Inc. across Market position, Key segments, and Exposure to technological disruption:
Marvell Technology, Inc.
- Large market cap of 69B facing competition in semiconductors
- Diverse segments: Data Center, Enterprise Networking, Automotive, Consumer, Carrier Infrastructure
- Exposure through integrated circuits in networking and storage
Ambarella, Inc.
- Smaller market cap of 2.7B in semiconductor niche
- Focused on video processing chips for automotive, security, robotics, and consumer cameras
- Exposure via AI and HD video compression system-on-chip tech
Marvell Technology, Inc. vs Ambarella, Inc. Positioning
Marvell shows a diversified business with multiple revenue streams across data center and networking sectors, while Ambarella concentrates on video-related semiconductor solutions, limiting breadth but focusing on specialized applications.
Which has the best competitive advantage?
Both companies display very unfavorable MOAT evaluations with declining ROIC and value destruction; neither currently demonstrates a sustainable competitive advantage based on capital efficiency trends.
Stock Comparison
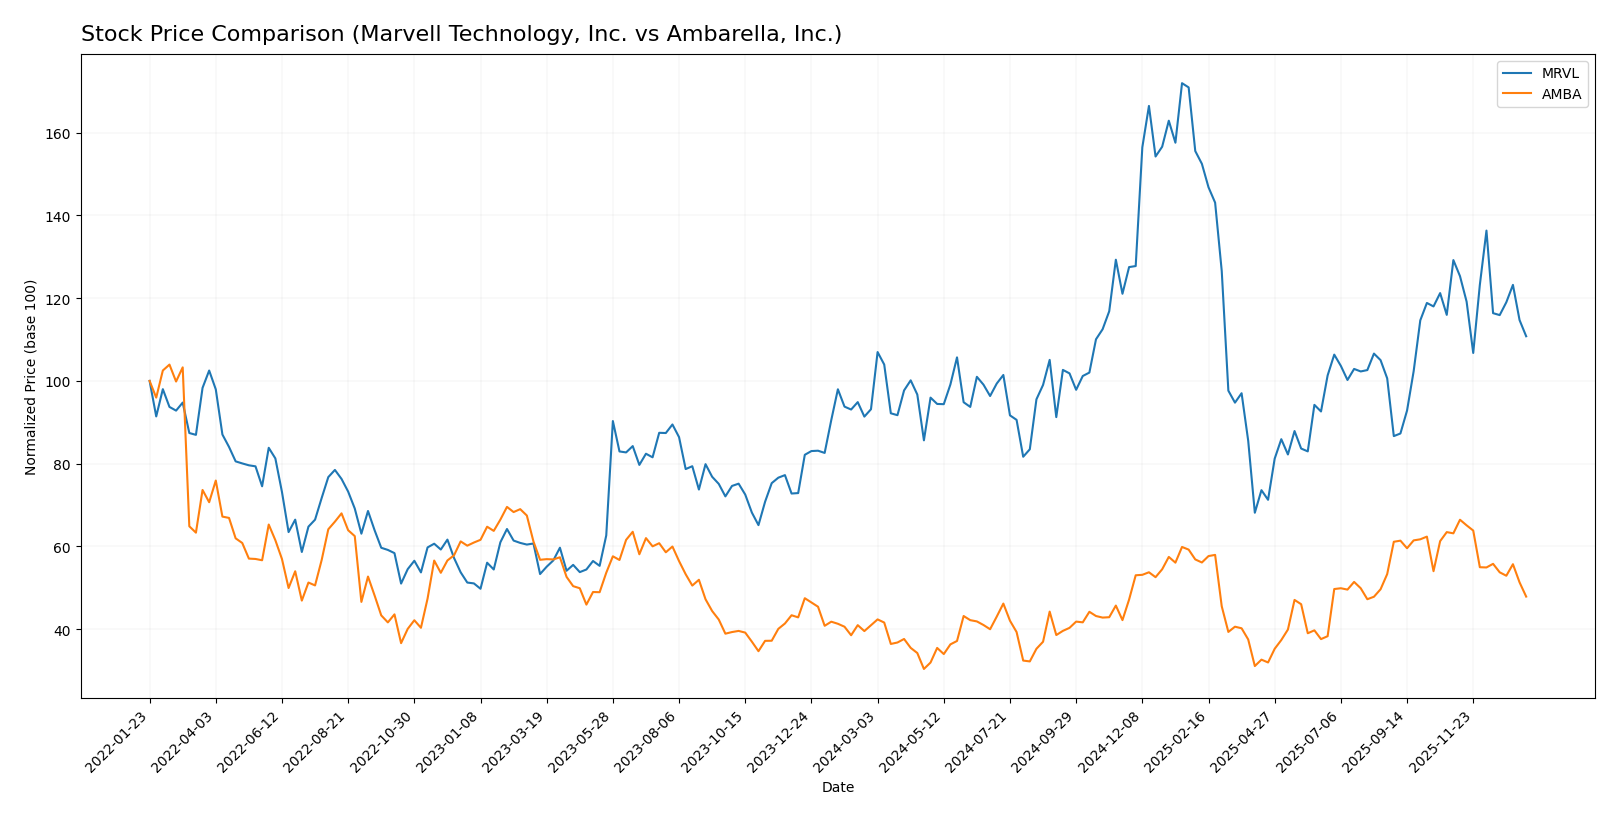
The stock price movements of Marvell Technology, Inc. and Ambarella, Inc. over the past year reveal significant bullish trends with decelerating momentum, followed by recent short-term declines reflecting seller dominance in trading volumes.
Trend Analysis
Marvell Technology, Inc. experienced an 18.94% price increase over the past 12 months, indicating a bullish trend with deceleration; the stock ranged between 49.43 and 124.76, with recent weeks showing a -14.25% decline.
Ambarella, Inc. showed a 16.9% price increase over the last year, also bullish with deceleration; the price fluctuated from 40.99 to 89.67, but recent trading saw a sharper -24.21% drop.
Comparing both, Marvell delivered a slightly higher annual market performance, while both stocks faced notable short-term downward pressure and seller dominance recently.
Target Prices
Analysts present a clear consensus on target prices for Marvell Technology, Inc. and Ambarella, Inc.
| Company | Target High | Target Low | Consensus |
|---|---|---|---|
| Marvell Technology, Inc. | 156 | 80 | 117 |
| Ambarella, Inc. | 115 | 80 | 97.5 |
The consensus target prices indicate upside potential for both stocks, with Marvell’s target consensus significantly above its current price of 80.38, and Ambarella’s target consensus also well above its current price of 64.6, reflecting generally positive analyst expectations.
Analyst Opinions Comparison
This section compares analysts’ ratings and grades for Marvell Technology, Inc. and Ambarella, Inc.:
Rating Comparison
Marvell Technology, Inc. Rating
- Rating: B+ with a very favorable overall assessment.
- Discounted Cash Flow Score: 3, indicating moderate valuation.
- ROE Score: 4, showing favorable profit generation efficiency.
- ROA Score: 5, reflecting very favorable asset utilization.
- Debt To Equity Score: 2, a moderate level of financial risk.
- Overall Score: 3, moderate overall financial standing.
Ambarella, Inc. Rating
- Rating: C+ with a very favorable overall assessment.
- Discounted Cash Flow Score: 3, indicating moderate valuation.
- ROE Score: 1, indicating very unfavorable profit generation efficiency.
- ROA Score: 1, reflecting very unfavorable asset utilization.
- Debt To Equity Score: 4, indicating favorable financial risk management.
- Overall Score: 2, moderate overall financial standing.
Which one is the best rated?
Based on the data, Marvell Technology holds a higher rating of B+ compared to Ambarella’s C+. Marvell also scores better in ROE and ROA, while Ambarella’s strength lies in its lower financial risk indicated by a better debt-to-equity score. Overall, Marvell is better rated.
Scores Comparison
Here is a comparison of the Altman Z-Score and Piotroski Score for both companies:
MRVL Scores
- Altman Z-Score: 6.76, indicating a safe zone, low bankruptcy risk.
- Piotroski Score: 7, classified as strong financial health.
AMBA Scores
- Altman Z-Score: 10.69, indicating a safe zone, very low bankruptcy risk.
- Piotroski Score: 3, classified as very weak financial health.
Which company has the best scores?
AMBA shows a higher Altman Z-Score, suggesting stronger bankruptcy safety, while MRVL has a significantly better Piotroski Score, indicating stronger overall financial health. The scores reflect different strengths for each company.
Grades Comparison
The following is a detailed comparison of recent grades assigned to Marvell Technology, Inc. and Ambarella, Inc.:
Marvell Technology, Inc. Grades
This table summarizes recent grades and rating actions from reputable grading companies for Marvell Technology, Inc.:
| Grading Company | Action | New Grade | Date |
|---|---|---|---|
| Rosenblatt | Maintain | Buy | 2026-01-07 |
| Melius Research | Upgrade | Buy | 2026-01-05 |
| Benchmark | Downgrade | Hold | 2025-12-08 |
| B. Riley Securities | Maintain | Buy | 2025-12-03 |
| JP Morgan | Maintain | Overweight | 2025-12-03 |
| Susquehanna | Maintain | Positive | 2025-12-03 |
| Benchmark | Maintain | Buy | 2025-12-03 |
| Oppenheimer | Maintain | Outperform | 2025-12-03 |
| Stifel | Maintain | Buy | 2025-12-03 |
| Rosenblatt | Maintain | Buy | 2025-12-03 |
Overall, Marvell Technology’s grades predominantly indicate a Buy consensus with consistent positive outlooks, though there was a recent Hold downgrade.
Ambarella, Inc. Grades
This table presents recent grade actions from recognized grading firms for Ambarella, Inc.:
| Grading Company | Action | New Grade | Date |
|---|---|---|---|
| B of A Securities | Maintain | Neutral | 2025-11-26 |
| Needham | Maintain | Buy | 2025-11-26 |
| Stifel | Maintain | Buy | 2025-11-26 |
| Rosenblatt | Maintain | Buy | 2025-11-26 |
| Rosenblatt | Maintain | Buy | 2025-11-24 |
| Stifel | Maintain | Buy | 2025-08-29 |
| Needham | Maintain | Buy | 2025-08-29 |
| Northland Capital Markets | Maintain | Outperform | 2025-08-29 |
| Morgan Stanley | Maintain | Overweight | 2025-08-29 |
| Oppenheimer | Maintain | Perform | 2025-08-29 |
Ambarella’s grades show a strong Buy tendency with some Neutral and Perform ratings, reflecting generally positive but slightly more mixed views.
Which company has the best grades?
Both companies hold a consensus Buy rating, but Marvell Technology has a higher count of Buy and equivalent positive grades, including Overweight and Outperform, suggesting stronger analyst confidence. This may influence investor sentiment towards a more bullish outlook on Marvell compared to Ambarella.
Strengths and Weaknesses
Below is a comparative overview of key strengths and weaknesses for Marvell Technology, Inc. (MRVL) and Ambarella, Inc. (AMBA) based on recent financial and operational data.
| Criterion | Marvell Technology, Inc. (MRVL) | Ambarella, Inc. (AMBA) |
|---|---|---|
| Diversification | Broad revenue base with significant contributions from Data Center (4.16B), Enterprise Networking (626M), and Carrier Infrastructure (338M) | Less diversified product portfolio; no recent detailed segmentation available |
| Profitability | Negative net margin (-15.35%), ROIC -3.88%, overall value destruction with declining ROIC | More severe negative profitability: net margin -41.12%, ROIC -21.96%, also value destroying |
| Innovation | Moderate innovation indicated by stable fixed-asset turnover (5.56) but declining economic moat | Fixed asset turnover very high (19.96) but profitability and ROIC trends show weakness |
| Global presence | Strong presence in high-growth markets like Data Center and Networking | Smaller scale and less diversified global footprint implied by limited data |
| Market Share | Significant in Data Center and Networking sectors, with revenues in billions | Market share appears limited with no clear revenue segmentation disclosed |
Key takeaways: Both companies are currently facing profitability challenges, with declining returns and value destruction. Marvell benefits from a more diversified and sizeable revenue base, particularly in Data Center markets, while Ambarella suffers from more acute profitability issues and less diversification. Caution is warranted when considering investment in either company given their unfavorable financial metrics.
Risk Analysis
Below is a comparative risk assessment table for Marvell Technology, Inc. (MRVL) and Ambarella, Inc. (AMBA) based on the latest available data for 2025.
| Metric | Marvell Technology, Inc. (MRVL) | Ambarella, Inc. (AMBA) |
|---|---|---|
| Market Risk | High beta (1.945) indicates elevated volatility | High beta (1.953) indicates elevated volatility |
| Debt level | Moderate debt-to-equity (0.32), manageable leverage | Very low debt-to-equity (0.01), minimal leverage |
| Regulatory Risk | Moderate, operates globally including China and US | Moderate, US-based with global sales, less exposure to China |
| Operational Risk | Complex global operations with 7K+ employees | Smaller scale with 941 employees, less operational complexity |
| Environmental Risk | Moderate; semiconductor manufacturing has environmental impact | Moderate; semiconductor production and AI processing consume energy |
| Geopolitical Risk | Significant exposure to geopolitical tensions in Asia | Lower, but some exposure through supply chains and markets |
The most impactful risks for both companies stem from high market volatility and operational exposure to global supply chains, especially geopolitical tensions affecting Asia. Marvell’s broader international footprint increases its geopolitical and regulatory risks, while Ambarella’s financials show weaker profitability and operational efficiency, amplifying market risks. Investors should carefully monitor global trade dynamics and semiconductor industry cycles.
Which Stock to Choose?
Marvell Technology, Inc. (MRVL) shows moderate revenue growth of 4.71% in 2025 with an unfavorable net margin of -15.35%. Its financial ratios are generally unfavorable, with declining profitability and a net debt-to-EBITDA ratio of 5.21. The company holds a very favorable B+ rating despite value destruction indicated by a negative ROIC versus WACC.
Ambarella, Inc. (AMBA) exhibits stronger revenue growth at 25.78% in 2025 and a higher gross margin of 60.5%, but suffers a worse net margin of -41.12%. Its financial ratios are mostly unfavorable, with low profitability and minimal debt. The rating is a very favorable C+, though ROIC remains well below WACC, signaling persistent value erosion.
For investors, MRVL’s stronger rating and less severe profitability decline might appeal to those seeking quality and moderate stability, while AMBA’s higher growth rates and stronger gross margins could attract growth-oriented profiles despite greater risks. Both companies show value destruction and declining moats, suggesting caution for risk-averse investors.
Disclaimer: Investment carries a risk of loss of initial capital. The past performance is not a reliable indicator of future results. Be sure to understand risks before making an investment decision.
Go Further
I encourage you to read the complete analyses of Marvell Technology, Inc. and Ambarella, Inc. to enhance your investment decisions: