Home > Comparison > Technology > LRCX vs AMBA
The strategic rivalry between Lam Research Corporation and Ambarella, Inc. shapes the semiconductor industry’s evolution. Lam Research operates as a capital-intensive equipment manufacturer, enabling chip fabrication worldwide. Ambarella focuses on high-margin, integrated semiconductor solutions for video processing and AI applications. This analysis explores their contrasting models and competitive dynamics. I will determine which company presents a superior risk-adjusted return, guiding portfolio decisions amid sector innovation and volatility.
Table of contents
Companies Overview
Lam Research Corporation and Ambarella, Inc. both shape the semiconductor industry’s future with distinct technological strengths and market roles.
Lam Research Corporation: Semiconductor Equipment Powerhouse
Lam Research dominates the semiconductor equipment market by designing and servicing advanced processing tools for integrated circuit fabrication. Its core revenue stems from selling systems like ALTUS for tungsten metallization and VECTOR for plasma-enhanced CVD. In 2026, Lam emphasizes expanding its portfolio in high-precision wafer cleaning and etching to maintain its leadership in semiconductor manufacturing technology.
Ambarella, Inc.: Video Semiconductor Innovator
Ambarella leads in semiconductor solutions specializing in high-definition video processing and AI-driven computer vision. Its revenue engine revolves around system-on-a-chip designs for automotive cameras, security, and consumer electronics. The company focuses on enhancing low-power, high-quality video compression technologies to fuel growth across automotive and industrial markets in 2026.
Strategic Collision: Similarities & Divergences
Both companies thrive in semiconductors but diverge sharply: Lam invests in capital-intensive equipment for chip fabrication, while Ambarella develops integrated video processing chips. Their primary battleground is the semiconductor market’s upstream versus downstream segments. Investors will find Lam offers scale and asset intensity, whereas Ambarella presents nimble innovation in niche video processing applications.
Income Statement Comparison
The following data dissects the core profitability and scalability of both corporate engines to reveal who dominates the bottom line:
| Metric | Lam Research Corporation (LRCX) | Ambarella, Inc. (AMBA) |
|---|---|---|
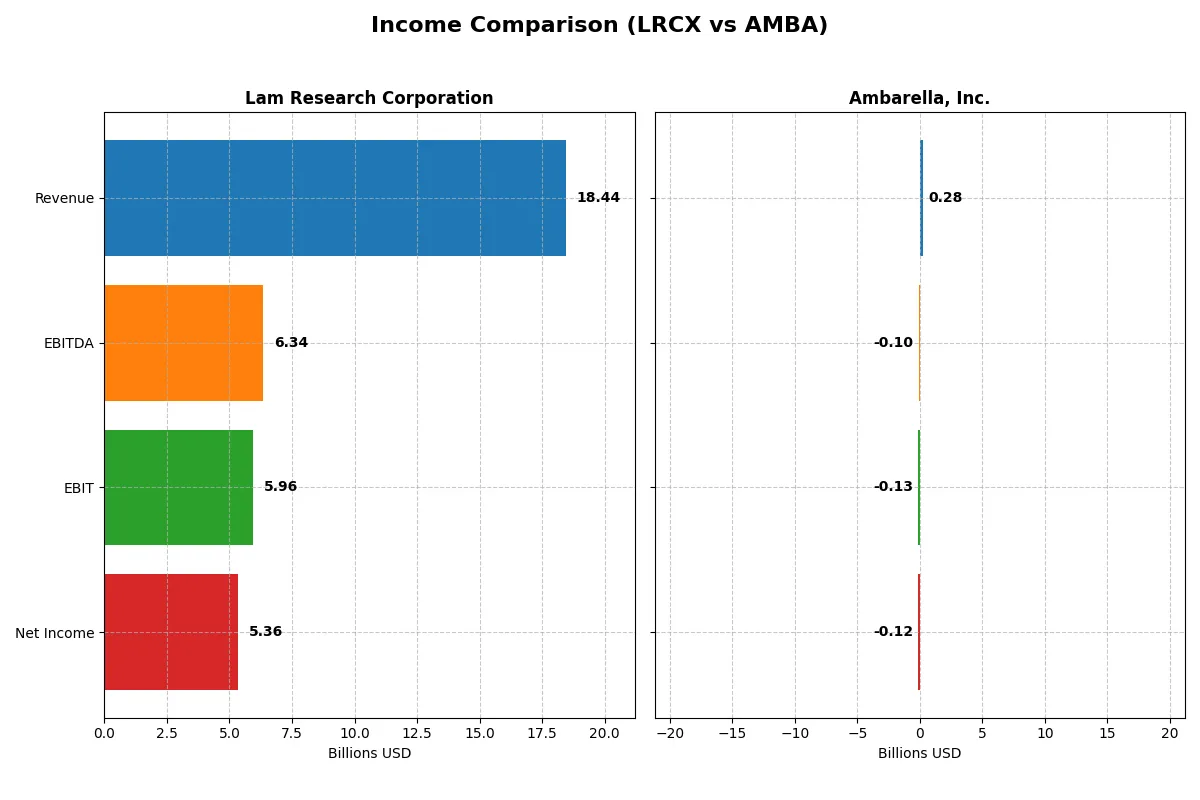
| Revenue | 18.4B | 285M |
| Cost of Revenue | 9.5B | 113M |
| Operating Expenses | 3.1B | 299M |
| Gross Profit | 9.0B | 172M |
| EBITDA | 6.3B | -101M |
| EBIT | 6.0B | -127M |
| Interest Expense | 178M | 0 |
| Net Income | 5.4B | -117M |
| EPS | 4.17 | -2.84 |
| Fiscal Year | 2025 | 2025 |
Income Statement Analysis: The Bottom-Line Duel
This income statement comparison reveals which company runs a more efficient and profitable corporate engine in the current market cycle.
Lam Research Corporation Analysis
Lam Research’s revenue climbed sharply from $14.9B in 2024 to $18.4B in 2025, reflecting strong market demand. Its net income surged 40% to $5.36B, driving a robust net margin near 29%. Gross and EBIT margins remain favorable at 48.7% and 32.3%, signaling excellent cost control and operational efficiency in 2025.
Ambarella, Inc. Analysis
Ambarella’s revenue grew 26% year-over-year to $285M in 2025, showing solid top-line momentum for a smaller player. However, it remains unprofitable with a net loss of $117M, despite a strong gross margin above 60%. The negative EBIT margin of -44.4% highlights ongoing challenges scaling operating expenses efficiently.
Margin Dominance vs. Growth Struggles
Lam Research dominates with superior scale, profitability, and margin expansion, reflecting a mature, well-managed business. Ambarella shows promising revenue growth but struggles to convert it into profits, weighed down by high operating costs. For investors prioritizing consistent earnings and margin strength, Lam Research presents a more attractive profile.
Financial Ratios Comparison
These vital ratios act as a diagnostic tool to expose the underlying fiscal health, valuation premiums, and capital efficiency of the companies compared below:
| Ratios | Lam Research (LRCX) | Ambarella (AMBA) |
|---|---|---|
| ROE | 54.3% | -20.9% |
| ROIC | 34.0% | -22.0% |
| P/E | 23.4 | -27.1 |
| P/B | 12.7 | 5.6 |
| Current Ratio | 2.21 | 2.65 |
| Quick Ratio | 1.55 | 2.36 |
| D/E | 0.48 | 0.009 |
| Debt-to-Assets | 22.3% | 0.8% |
| Interest Coverage | 33.1 | 0 |
| Asset Turnover | 0.86 | 0.41 |
| Fixed Asset Turnover | 7.59 | 19.96 |
| Payout Ratio | 21.5% | 0% |
| Dividend Yield | 0.92% | 0% |
| Fiscal Year | 2025 | 2025 |
Efficiency & Valuation Duel: The Vital Signs
Financial ratios act as a company’s DNA, uncovering hidden risks and operational strengths that drive investor decisions.
Lam Research Corporation
Lam Research delivers stellar profitability with a 54.33% ROE and a strong 29.06% net margin, signaling operational excellence. Its valuation at a 23.36 P/E ratio is neutral, while a 6.7 EV/sales suggests moderate premium pricing. The company returns capital cautiously, offering a modest 0.92% dividend yield alongside robust reinvestment in R&D at 11.4% of revenue.
Ambarella, Inc.
Ambarella struggles with negative profitability metrics, including a -20.86% ROE and -41.12% net margin, reflecting operational challenges. Its -27.05 P/E ratio is technically favorable but reflects losses, while an EV/sales of 10.63 indicates a stretched valuation. The firm pays no dividends, allocating nearly 79.4% of revenue to R&D, prioritizing growth over immediate returns.
Premium Profitability vs. Growth Struggles
Lam Research balances strong returns and steady valuation, offering more operational safety. Ambarella’s high R&D spend and negative earnings signal high risk despite growth ambitions. Investors seeking stability may prefer Lam’s profile, while those targeting speculative growth might consider Ambarella’s trajectory.
Which one offers the Superior Shareholder Reward?
Lam Research Corporation (LRCX) pays a modest dividend yield around 0.9%, with a sustainable payout ratio near 21%, supported by strong free cash flow coverage (~88%). It pairs dividends with steady buyback programs, enhancing total shareholder returns. Ambarella, Inc. (AMBA) pays no dividends and reports negative net margins, reflecting ongoing losses. AMBA reinvests heavily in growth and R&D, but its free cash flow relative to buybacks is limited. Given LRCX’s balanced distribution strategy and robust cash generation, I see it offering a more attractive and sustainable total return profile in 2026.
Comparative Score Analysis: The Strategic Profile
The radar chart reveals the fundamental DNA and trade-offs of Lam Research Corporation and Ambarella, Inc.:
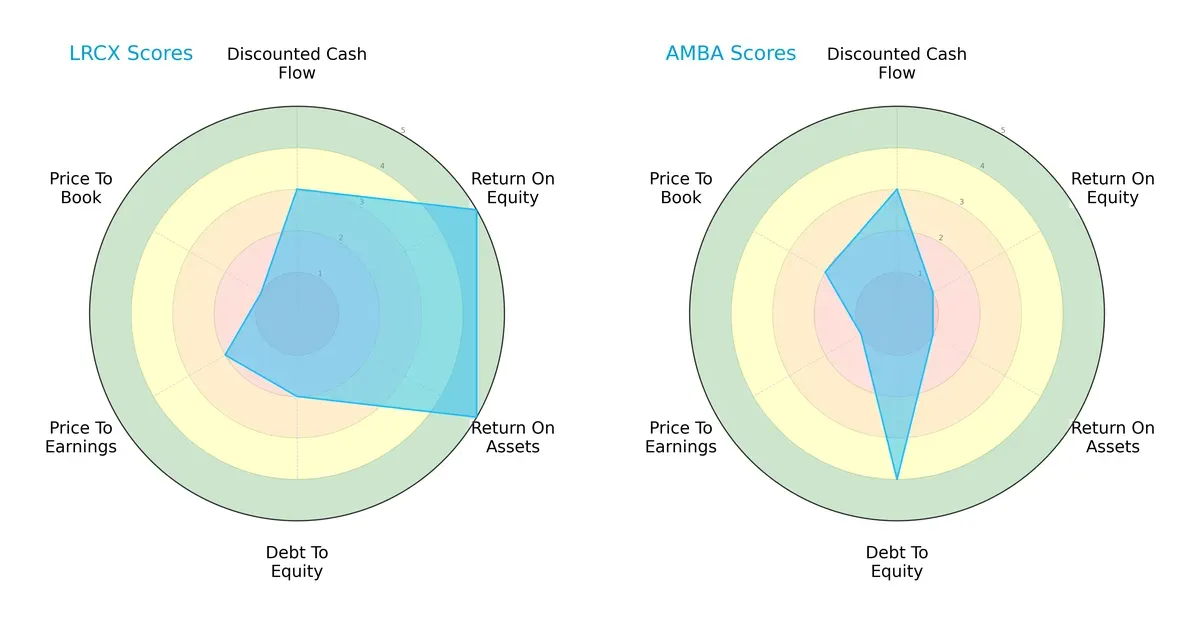
Lam Research displays a balanced strength in ROE and ROA (both 5), signaling superior profitability and asset efficiency. Conversely, Ambarella struggles with low ROE and ROA scores (1 each), indicating operational challenges. Ambarella’s stronger debt-to-equity score (4 vs. 2) suggests better leverage management. Lam’s valuation metrics reveal potential overvaluation risks, especially with a very unfavorable price-to-book score (1). Overall, Lam leverages operational excellence, while Ambarella relies more on conservative balance sheet management.
Bankruptcy Risk: Solvency Showdown
Lam Research’s Altman Z-Score of 21.18 far exceeds Ambarella’s 10.14, both safely in the safe zone:
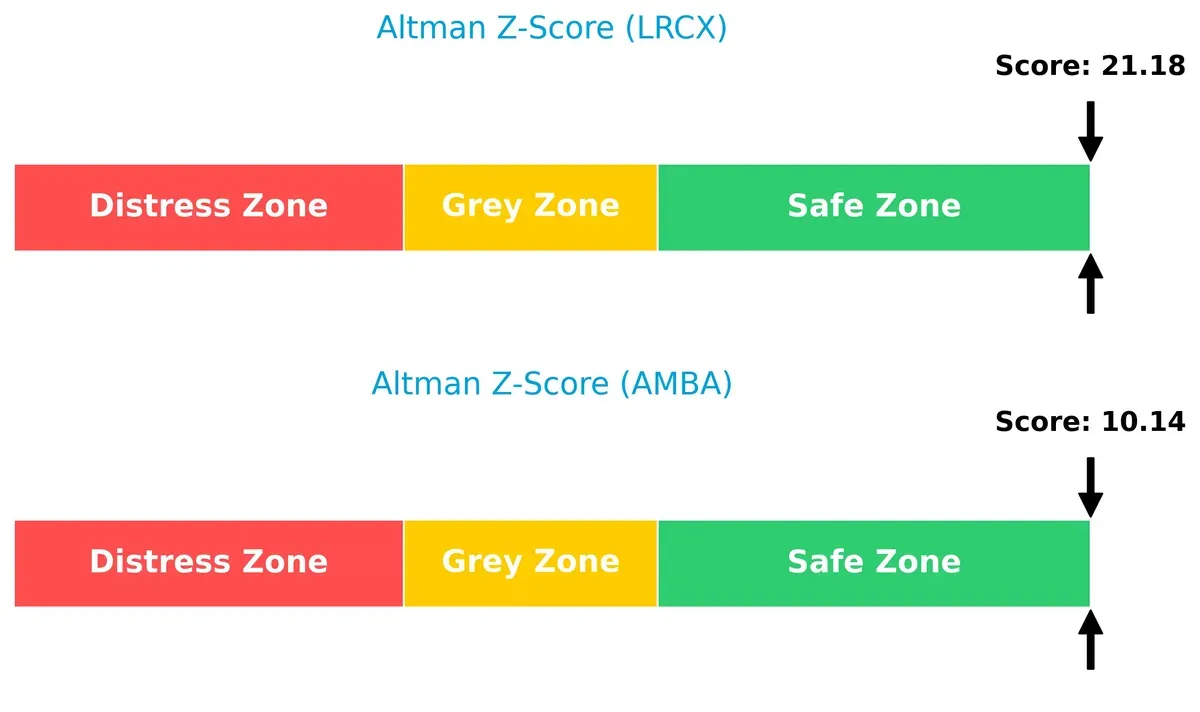
These robust scores imply both firms are financially stable with minimal bankruptcy risk. Lam’s higher score confirms a stronger buffer against economic downturns and cyclical volatility, reinforcing its resilience.
Financial Health: Quality of Operations
Lam Research’s Piotroski F-Score of 8 signals very strong financial health, contrasting sharply with Ambarella’s weak score of 3:
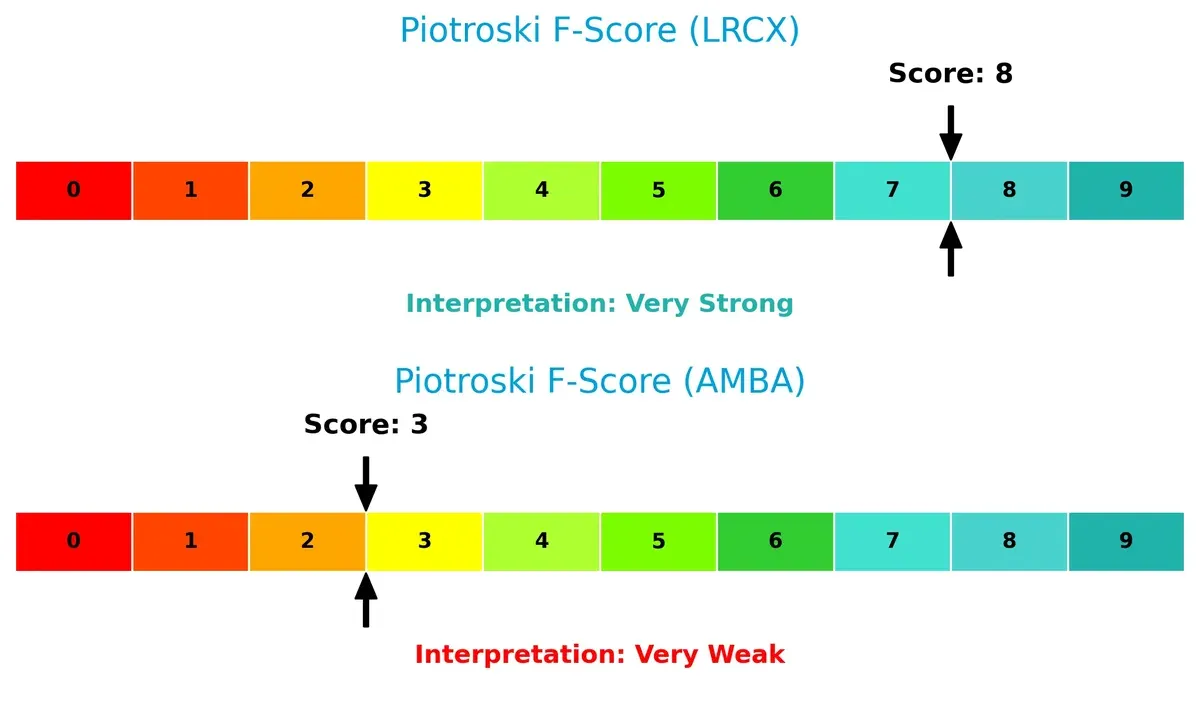
Lam’s internal metrics reflect efficient profitability, liquidity, and leverage management. Ambarella’s low score raises red flags about operational weaknesses and financial distress potential. For disciplined investors, Lam’s superior quality of earnings offers greater confidence.
How are the two companies positioned?
This section dissects Lam Research and Ambarella’s operational DNA by comparing revenue distribution and internal dynamics. The goal is to confront their economic moats to identify which model offers the most resilient, sustainable competitive advantage today.
Revenue Segmentation: The Strategic Mix
The following visual comparison dissects how both firms diversify their income streams and where their primary sector bets lie:
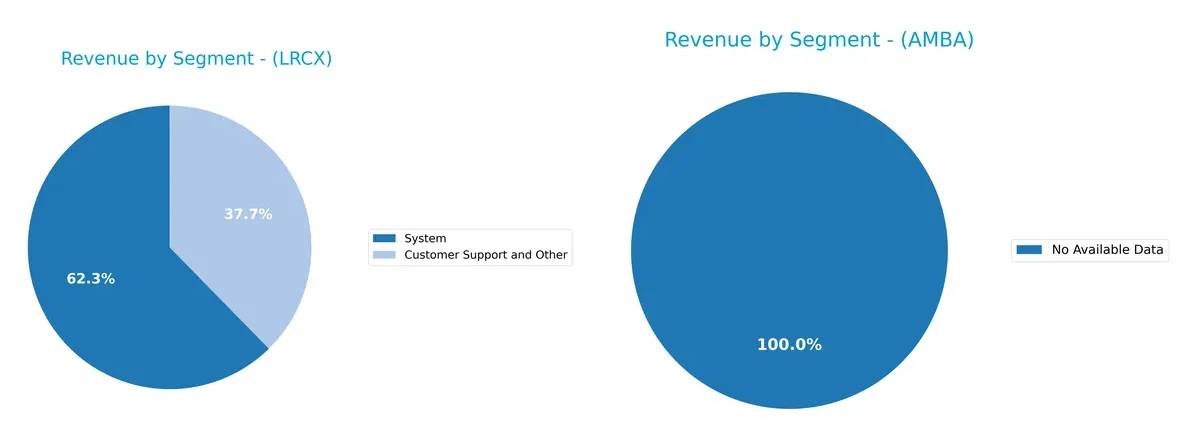
Lam Research Corporation anchors its revenue in two key segments: Systems at $11.5B and Customer Support at $6.9B in 2025. This mix shows moderate diversification, balancing high-margin systems with recurring support income. Ambarella, Inc. lacks available segmentation data, preventing direct comparison. Lam’s strategy pivots on infrastructure dominance and ecosystem lock-in, reducing risk versus sector peers that rely heavily on a single product line.
Strengths and Weaknesses Comparison
This table compares the Strengths and Weaknesses of Lam Research Corporation and Ambarella, Inc.:
Lam Research Corporation Strengths
- Strong profitability with 29% net margin and 54% ROE
- Favorable liquidity ratios above 2.0
- Low debt-to-assets at 22% supports financial stability
- High fixed asset turnover at 7.59 indicates efficient use of assets
- Diversified revenue streams from systems and customer support
- Significant global presence with strong sales in China and Korea
Ambarella, Inc. Strengths
- Favorable current and quick ratios above 2.3 show solid liquidity
- Minimal debt with debt-to-assets under 1% reduces financial risk
- High fixed asset turnover at 19.96 reflects efficient asset use
- Positive PE ratio despite losses suggests potential valuation upside
- Presence in Taiwan and Europe indicates some geographic diversification
- Stable market share in niche semiconductor segments
Lam Research Corporation Weaknesses
- Elevated WACC at 12% increases capital costs
- High P/B ratio of 12.7 may indicate overvaluation risk
- Dividend yield below 1% limits income appeal
- Neutral asset turnover at 0.86 suggests room for efficiency gains
- Dependence on Asia-Pacific markets may expose to geopolitical risks
Ambarella, Inc. Weaknesses
- Negative profitability with -41% net margin and -21% ROIC
- Zero interest coverage signals inability to cover debt costs
- Unfavorable asset turnover at 0.41 indicates inefficient asset use
- Negative ROE of -21% reflects poor shareholder returns
- No dividend yield reduces appeal to income investors
- Higher WACC at 13% raises cost of capital
Lam Research shows strong profitability and liquidity with diversified global sales but faces valuation and capital cost pressures. Ambarella struggles with profitability and asset efficiency despite low debt and good liquidity, highlighting strategic challenges in improving returns.
The Moat Duel: Analyzing Competitive Defensibility
A structural moat is the only barrier that protects long-term profits from relentless competitive forces. Let’s examine how Lam Research and Ambarella defend their turf:
Lam Research Corporation: Durable Operational Excellence
Lam Research’s moat lies in its cost advantage and high-tech manufacturing expertise. It sustains a very favorable ROIC, 22% above WACC, reflecting efficient capital use and margin stability. In 2026, expanding wafer fabrication innovations could deepen this moat amid global semiconductor demand.
Ambarella, Inc.: Innovation-Driven but Profitability-Challenged
Ambarella relies on intangible assets—AI and video processing IP—to differentiate itself. However, its declining ROIC and negative margins reveal a fragile moat compared to Lam’s robust cost leadership. Future growth hinges on breakthroughs in autonomous vehicle and security markets, yet profitability risks remain.
Cost Leadership vs. Intellectual Property: Which Moat Holds Stronger?
Lam Research’s wider and more durable moat outclasses Ambarella’s shrinking competitive edge. Lam’s consistent value creation and margin growth position it better to defend market share against rivals and economic cycles. Ambarella faces a steep climb to translate innovation into sustainable profits.
Which stock offers better returns?
The stock price performance over the past year reveals stark contrasts in growth and trading dynamics between the two companies.
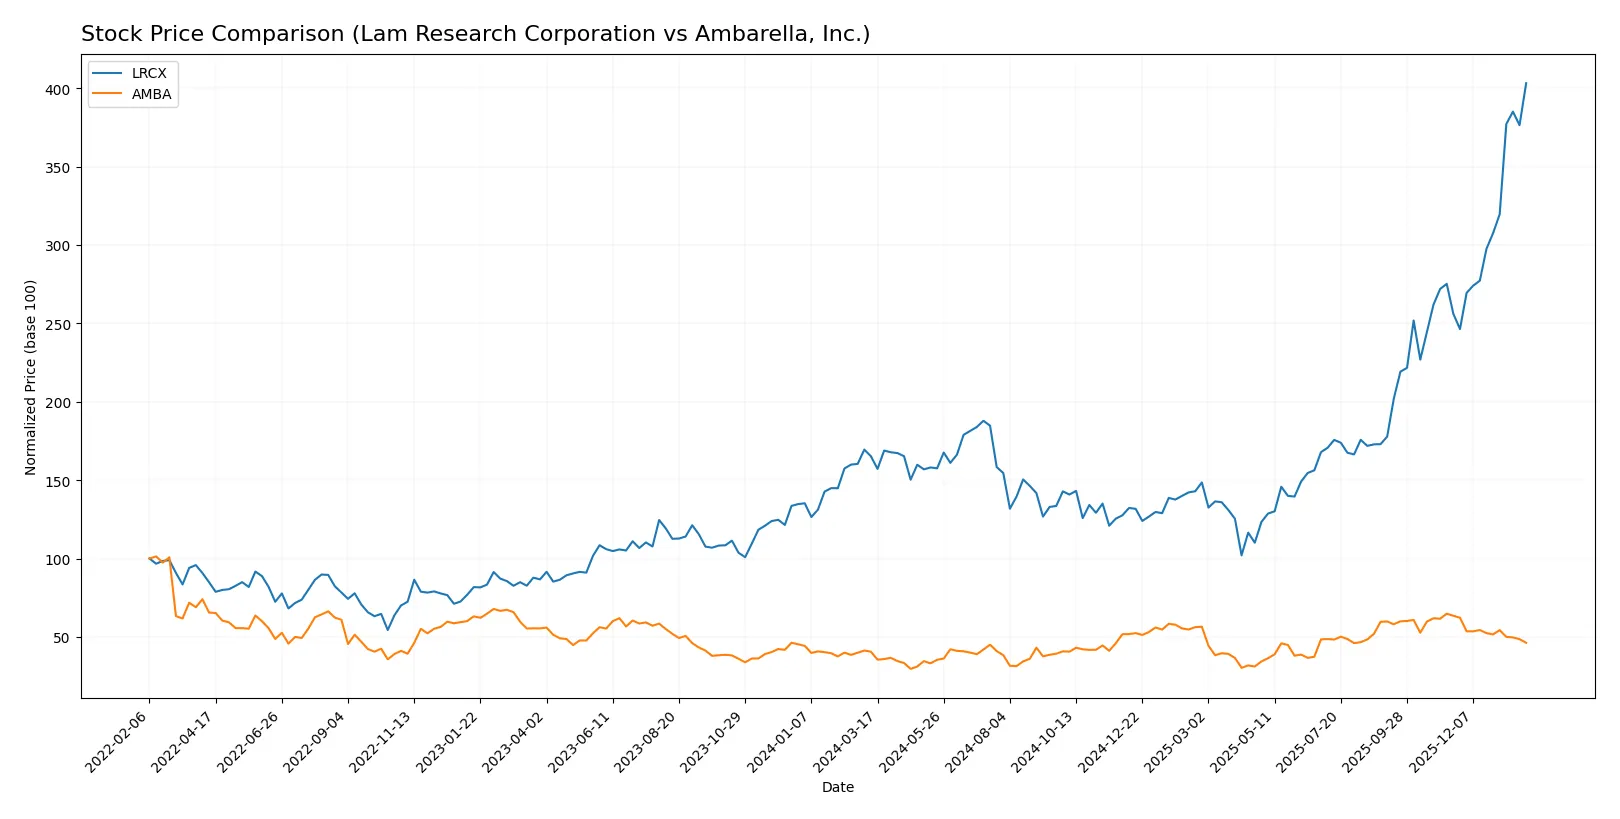
Trend Comparison
Lam Research Corporation (LRCX) shows a strong bullish trend with a 144.03% price increase over 12 months. This growth accelerates, peaking at 233.46, with notable volatility (std dev 36.82).
Ambarella, Inc. (AMBA) also trends bullish overall but with modest gains of 14.09% over the year. The trend decelerates, showing lower volatility (std dev 12.79) and a recent negative price change.
LRCX outperforms AMBA significantly, delivering the highest market returns and stronger buyer dominance in volume trends.
Target Prices
Analyst consensus shows strong upside potential for both Lam Research Corporation and Ambarella, Inc.
| Company | Target Low | Target High | Consensus |
|---|---|---|---|
| Lam Research Corporation | 127 | 325 | 266.76 |
| Ambarella, Inc. | 80 | 115 | 97.5 |
Lam Research’s target consensus at 267 implies about 14% upside from its current 233.46, signaling robust confidence. Ambarella’s 97.5 target shows a significant 52% gain potential versus its 64.04 price, reflecting strong growth expectations.

Don’t Let Luck Decide Your Entry Point
Optimize your entry points with our advanced ProRealTime indicators. You’ll get efficient buy signals with precise price targets for maximum performance. Start outperforming now!
How do institutions grade them?
The grades from reputable institutions for Lam Research Corporation and Ambarella, Inc. are as follows:
Lam Research Corporation Grades
The following table summarizes recent grades assigned by major financial institutions to Lam Research Corporation:
| Grading Company | Action | New Grade | Date |
|---|---|---|---|
| Susquehanna | Maintain | Positive | 2026-01-29 |
| Citigroup | Maintain | Buy | 2026-01-29 |
| RBC Capital | Maintain | Outperform | 2026-01-29 |
| Needham | Maintain | Buy | 2026-01-29 |
| UBS | Maintain | Buy | 2026-01-29 |
| Cantor Fitzgerald | Maintain | Overweight | 2026-01-29 |
| Goldman Sachs | Maintain | Buy | 2026-01-29 |
| Morgan Stanley | Maintain | Equal Weight | 2026-01-29 |
| Wells Fargo | Maintain | Overweight | 2026-01-29 |
| Stifel | Maintain | Buy | 2026-01-29 |
Ambarella, Inc. Grades
Below are the latest grades from credible financial firms for Ambarella, Inc.:
| Grading Company | Action | New Grade | Date |
|---|---|---|---|
| Stifel | Maintain | Buy | 2025-11-26 |
| Needham | Maintain | Buy | 2025-11-26 |
| B of A Securities | Maintain | Neutral | 2025-11-26 |
| Rosenblatt | Maintain | Buy | 2025-11-26 |
| Rosenblatt | Maintain | Buy | 2025-11-24 |
| Oppenheimer | Maintain | Perform | 2025-08-29 |
| B of A Securities | Maintain | Neutral | 2025-08-29 |
| Needham | Maintain | Buy | 2025-08-29 |
| Rosenblatt | Maintain | Buy | 2025-08-29 |
| Morgan Stanley | Maintain | Overweight | 2025-08-29 |
Which company has the best grades?
Lam Research Corporation consistently receives higher grades such as Buy, Outperform, and Overweight from multiple top-tier institutions. Ambarella, Inc. shows a mix of Buy and Neutral ratings with fewer Outperform or Overweight grades. Investors may interpret Lam Research’s broader institutional confidence as a stronger endorsement.
Risks specific to each company
The following categories identify critical pressure points and systemic threats facing both firms in the 2026 market environment:
1. Market & Competition
Lam Research Corporation
- Operates in a highly competitive semiconductor equipment industry with global scale and diversified customer base.
Ambarella, Inc.
- Faces intense competition in semiconductor video processing chips with smaller scale and niche markets.
2. Capital Structure & Debt
Lam Research Corporation
- Moderate debt-to-equity ratio (0.48) with strong interest coverage (33.43), indicating solid financial stability.
Ambarella, Inc.
- Minimal debt (D/E 0.01) but zero interest coverage, raising concerns about profitability to cover interest expenses.
3. Stock Volatility
Lam Research Corporation
- Beta of 1.779 shows above-market volatility, typical for semiconductor equipment leaders.
Ambarella, Inc.
- Higher beta of 1.953 reflects even greater price swings and risk for investors.
4. Regulatory & Legal
Lam Research Corporation
- Subject to global semiconductor export controls and IP regulations, with experience managing compliance risks.
Ambarella, Inc.
- Faces regulatory scrutiny in AI and video processing markets, with emerging data privacy and export issues.
5. Supply Chain & Operations
Lam Research Corporation
- Global supply chain exposure but benefits from scale and operational expertise in semiconductor fabrication equipment.
Ambarella, Inc.
- Smaller scale and reliance on specialized chip manufacturing create higher supply chain vulnerability.
6. ESG & Climate Transition
Lam Research Corporation
- Increasing ESG focus with efforts to reduce emissions in manufacturing processes; industry norms demand strong compliance.
Ambarella, Inc.
- ESG initiatives less mature; climate transition risks rising as customers demand sustainable solutions.
7. Geopolitical Exposure
Lam Research Corporation
- Significant exposure to US-China tech tensions impacting supply chains and sales in Asia-Pacific markets.
Ambarella, Inc.
- Similar geopolitical risks but less diversified revenue base increases vulnerability to regional disruptions.
Which company shows a better risk-adjusted profile?
Lam Research faces notable market and geopolitical risks but demonstrates stronger financial stability and operational scale. Ambarella struggles with profitability and higher volatility, despite low debt. Lam’s robust Altman Z-score (21.2) and high Piotroski score (8) contrast sharply with Ambarella’s weaker scores, underscoring Lam’s superior risk-adjusted profile. Ambarella’s negative margins and interest coverage raise red flags, signaling elevated financial distress risk despite its low debt.
Final Verdict: Which stock to choose?
Lam Research’s superpower lies in its durable competitive advantage and exceptional capital efficiency. It consistently generates returns well above its cost of capital, signaling strong value creation. Its main point of vigilance is the premium valuation, which could compress in a market downturn. It suits an aggressive growth portfolio that can tolerate some valuation risk.
Ambarella’s strategic moat centers on its niche in high-margin, high-barrier video processing technology, supported by recurring R&D investment. Relative to Lam Research, it offers a safer balance sheet but struggles with profitability and declining returns. Its appeal fits a GARP portfolio willing to bet on a turnaround.
If you prioritize enduring value creation and proven profitability, Lam Research outshines Ambarella with superior financial health and growth momentum. However, if you seek a speculative GARP scenario with potential upside in a specialized tech niche, Ambarella offers a less stable but intriguing alternative. Both demand close monitoring of valuation and operational risks.
Disclaimer: Investment carries a risk of loss of initial capital. The past performance is not a reliable indicator of future results. Be sure to understand risks before making an investment decision.
Go Further
I encourage you to read the complete analyses of Lam Research Corporation and Ambarella, Inc. to enhance your investment decisions: