Home > Comparison > Technology > KLAC vs AMBA
The competitive dynamic between KLA Corporation and Ambarella, Inc. shapes the semiconductor sector’s innovation frontier. KLA operates as a capital-intensive process control powerhouse, while Ambarella focuses on high-margin, AI-driven video processing solutions. This analysis pits KLA’s industrial scale against Ambarella’s technological niche to assess which strategy delivers superior risk-adjusted returns. I will evaluate their trajectories to guide investors seeking resilient exposure within this critical technology industry.

Table of contents
Companies Overview
KLA Corporation and Ambarella, Inc. both shape the semiconductor sector with distinct market roles and innovation priorities.
KLA Corporation: Semiconductor Process Control Leader
KLA Corporation dominates the semiconductor process control market. It generates revenue by providing advanced wafer inspection, metrology, and defect management solutions. In 2026, its strategic focus emphasizes integrated process control software and expanding capabilities in PCB and display inspection, reinforcing its competitive edge in yield management.
Ambarella, Inc.: Vision-Centric Semiconductor Innovator
Ambarella, Inc. specializes in semiconductor solutions for video processing. Its core revenue stems from system-on-chip designs combining HD video, AI vision algorithms, and low power consumption. The company’s 2026 strategy targets automotive and security camera markets, leveraging AI and image processing to drive innovation in autonomous vehicle sensors and smart surveillance.
Strategic Collision: Similarities & Divergences
While both operate in semiconductors, KLA pursues a process control and inspection niche, contrasting Ambarella’s focus on video and AI-enabled chipsets. They compete indirectly in advanced technology adoption but target different end-markets. KLA offers a stable, capital-intensive business; Ambarella presents a growth-oriented profile fueled by emerging AI applications.
Income Statement Comparison
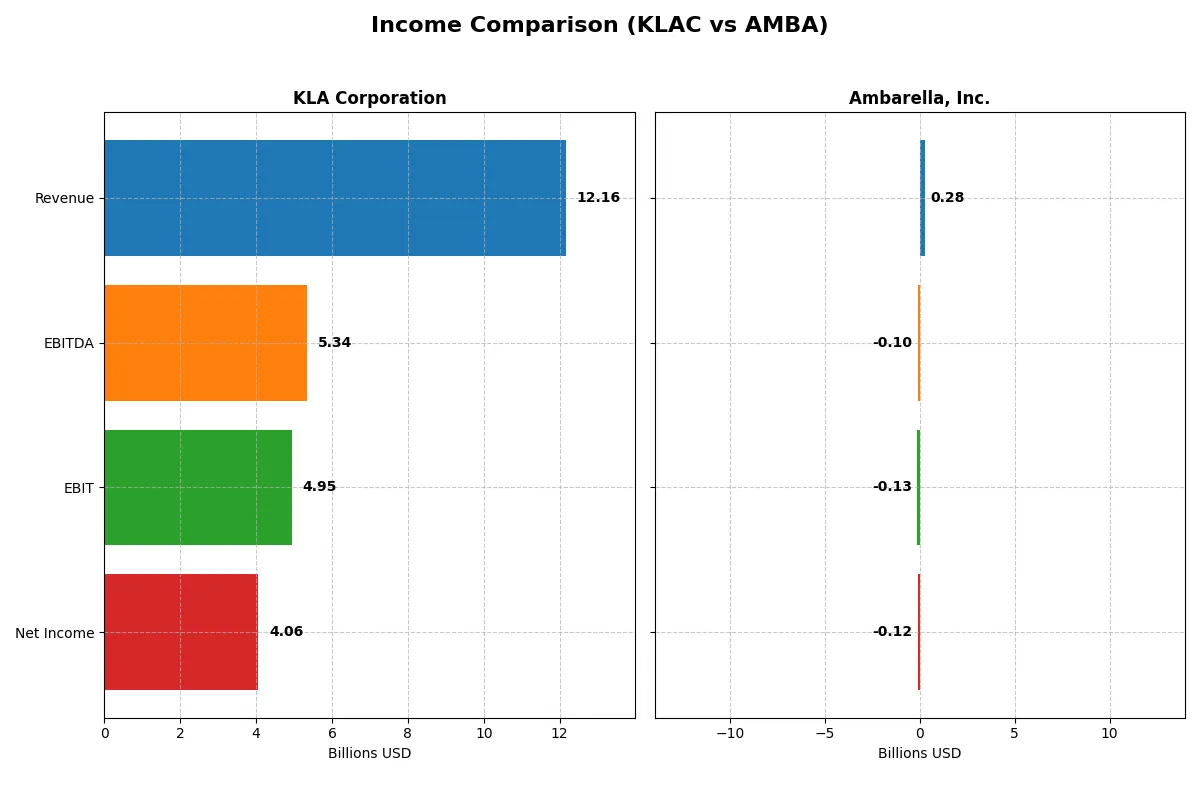
This data dissects the core profitability and scalability of both corporate engines to reveal who dominates the bottom line:
| Metric | KLA Corporation (KLAC) | Ambarella, Inc. (AMBA) |
|---|---|---|
| Revenue | 12.2B | 285M |
| Cost of Revenue | 4.58B | 113M |
| Operating Expenses | 2.33B | 299M |
| Gross Profit | 7.58B | 172M |
| EBITDA | 5.34B | -101M |
| EBIT | 4.95B | -127M |
| Interest Expense | 302M | 0 |
| Net Income | 4.06B | -117M |
| EPS | 30.53 | -2.84 |
| Fiscal Year | 2025 | 2025 |
Income Statement Analysis: The Bottom-Line Duel
This income statement comparison reveals which company converts revenue into profit most efficiently over recent years.
KLA Corporation Analysis
KLA’s revenue rose sharply from 6.9B in 2021 to 12.2B in 2025, nearly doubling net income from 2.1B to 4.1B. Gross margins hold strong above 62%, while net margins exceed 33%, showcasing impressive operational control. The latest fiscal year demonstrates robust momentum, with revenue and net income growth exceeding 20% annually, driven by expanding margins and disciplined capital allocation.
Ambarella, Inc. Analysis
Ambarella’s revenue increased modestly from 223M in 2021 to 285M in 2025, but net losses persist, albeit narrowing from -60M to -117M. Despite a favorable gross margin near 60%, negative EBIT and net margins reflect ongoing operating inefficiencies. Recent growth in revenue and gross profit around 25% hints at improving scale, yet profitability remains elusive, highlighting challenges in cost management and earnings conversion.
Verdict: Dominant Profitability vs. Struggling Scalability
KLA clearly leads with substantial revenue scale and consistent profit growth, boasting strong margins that outpace industry averages. Ambarella shows promising top-line momentum but continues to operate at a loss, indicating structural profitability risks. For investors seeking solid, proven earnings power, KLA’s profile offers far greater stability and margin resilience than Ambarella’s growth-at-a-loss model.
Financial Ratios Comparison
These vital ratios act as a diagnostic tool to expose the underlying fiscal health, valuation premiums, and capital efficiency of the companies compared below:
| Ratios | KLA Corporation (KLAC) | Ambarella, Inc. (AMBA) |
|---|---|---|
| ROE | 86.6% | -20.9% |
| ROIC | 38.0% | -22.0% |
| P/E | 29.3 | -27.1 |
| P/B | 25.4 | 5.64 |
| Current Ratio | 2.62 | 2.65 |
| Quick Ratio | 1.83 | 2.36 |
| D/E (Debt-to-Equity) | 1.30 | 0.0094 |
| Debt-to-Assets | 37.9% | 0.76% |
| Interest Coverage | 17.3 | 0 |
| Asset Turnover | 0.76 | 0.41 |
| Fixed Asset Turnover | 9.70 | 19.96 |
| Payout ratio | 22.3% | 0% |
| Dividend yield | 0.76% | 0% |
| Fiscal Year | 2025 | 2025 |
Efficiency & Valuation Duel: The Vital Signs
Financial ratios serve as a company’s DNA, unveiling hidden risks and operational strengths that raw numbers alone cannot expose.
KLA Corporation
KLA demonstrates exceptional profitability with an 86.6% ROE and a robust 33.4% net margin. Its P/E at 29.3 signals a stretched valuation relative to the S&P 500 average. The company maintains operational efficiency and returns value through a modest 0.76% dividend yield, balancing shareholder payouts with heavy reinvestment in R&D at 11.1% of revenue.
Ambarella, Inc.
Ambarella struggles with negative profitability metrics: a -20.9% ROE and a -41.1% net margin. Despite a favorable negative P/E of -27.1, these figures reflect underlying operational challenges. The company has no dividend and allocates nearly 79.4% of revenue to R&D, aiming for growth but burdened by weak cash flow and interest coverage at zero.
Premium Valuation vs. Operational Safety
KLA offers a rare blend of high profitability and manageable risk, albeit at a premium valuation. Ambarella’s financial ratios reveal distress and operational inefficiency despite aggressive reinvestment. Investors seeking stability and proven returns lean toward KLA, while those tolerating risk for potential turnaround may consider Ambarella’s growth profile.
Which one offers the Superior Shareholder Reward?
I observe that KLA Corporation pays a modest dividend yield near 0.76% with a sustainable payout ratio around 22%, supported by strong free cash flow (28/share). KLA also executes robust buybacks, enhancing shareholder value consistently. Ambarella, Inc. pays no dividends, focusing on reinvestment and growth. However, AMBA’s negative margins and weak cash flow (free cash flow only 0.57/share) limit buyback capacity. Historically, KLA’s balanced distribution and buyback program offer a more reliable total return than Ambarella’s high-risk growth model. I conclude KLA delivers the superior shareholder reward in 2026.
Comparative Score Analysis: The Strategic Profile
The radar chart reveals the fundamental DNA and trade-offs of KLA Corporation and Ambarella, Inc., showcasing their financial strengths and weaknesses side by side:
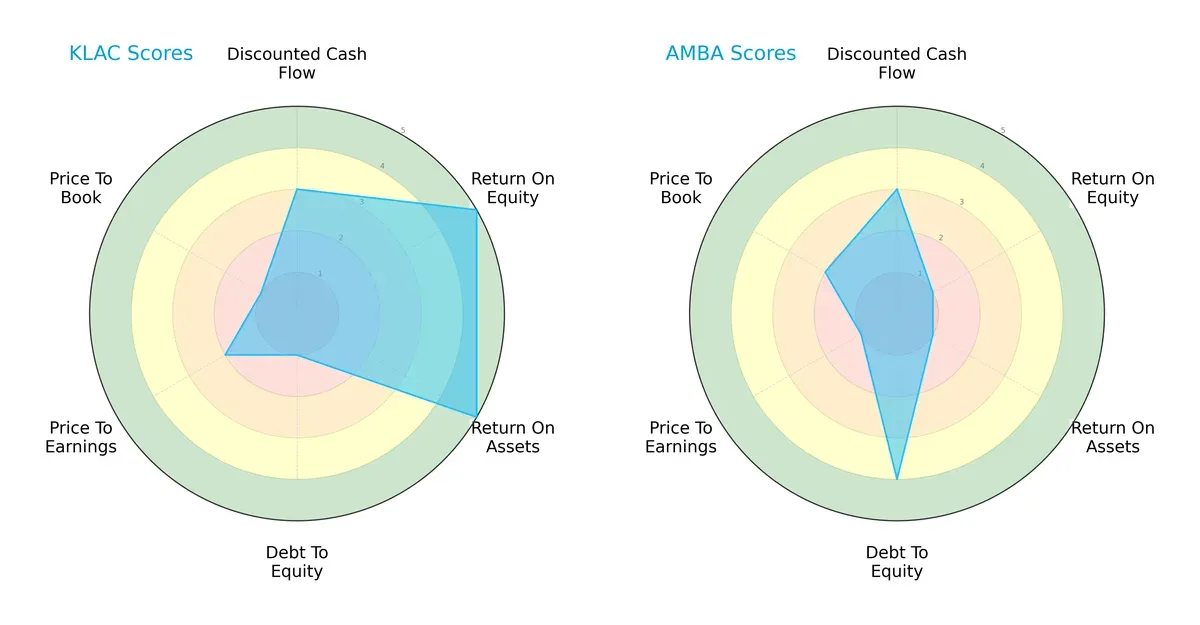
KLA demonstrates superior profitability with top ROE and ROA scores (5 each), signaling excellent capital efficiency. However, it carries significant financial risk, reflected in a very unfavorable debt-to-equity score (1). Ambarella, conversely, has a stronger balance sheet with a favorable debt-to-equity score (4) but lags significantly in profitability metrics (ROE and ROA scores of 1). KLA’s profile is more unbalanced but driven by operational excellence. Ambarella relies more on financial stability but struggles with returns.
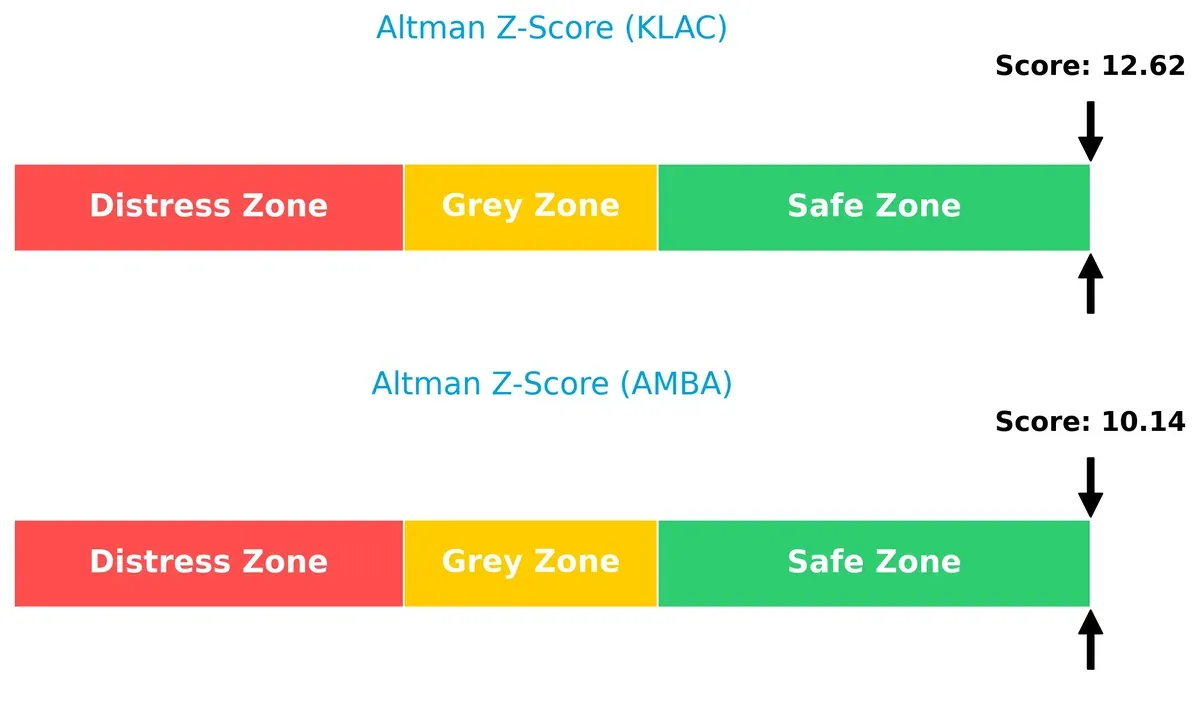
Bankruptcy Risk: Solvency Showdown
KLA’s Altman Z-Score of 12.6 versus Ambarella’s 10.1 signals both firms reside comfortably in the safe zone, indicating robust solvency and low bankruptcy risk in this cycle:
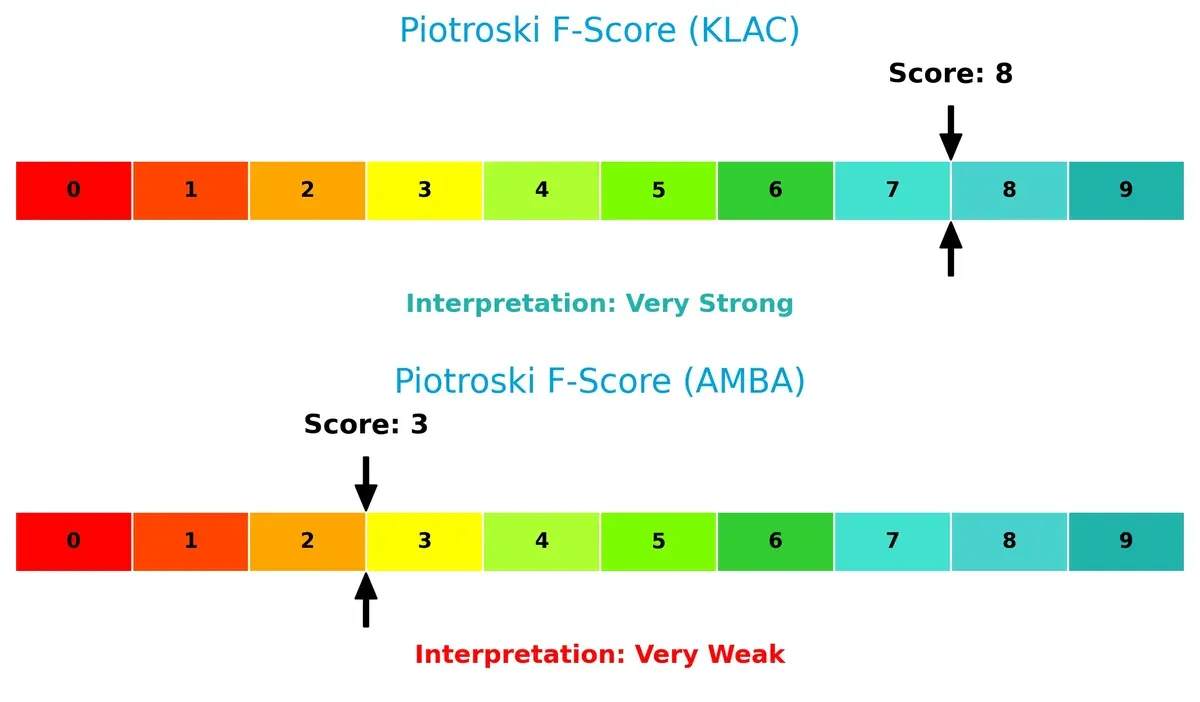
Financial Health: Quality of Operations
KLA scores an impressive 8 on the Piotroski F-Score, indicating very strong financial health and operational quality. Ambarella’s 3 signals red flags in profitability and efficiency, highlighting weaker internal financial metrics compared to KLA:
How are the two companies positioned?
This section dissects the operational DNA of KLA and Ambarella by comparing their revenue distribution and internal dynamics. The goal is to confront their economic moats and identify which model offers the most resilient competitive advantage today.
Revenue Segmentation: The Strategic Mix
This visual comparison dissects how KLA Corporation and Ambarella, Inc. diversify their income streams and reveals where their primary sector bets lie:
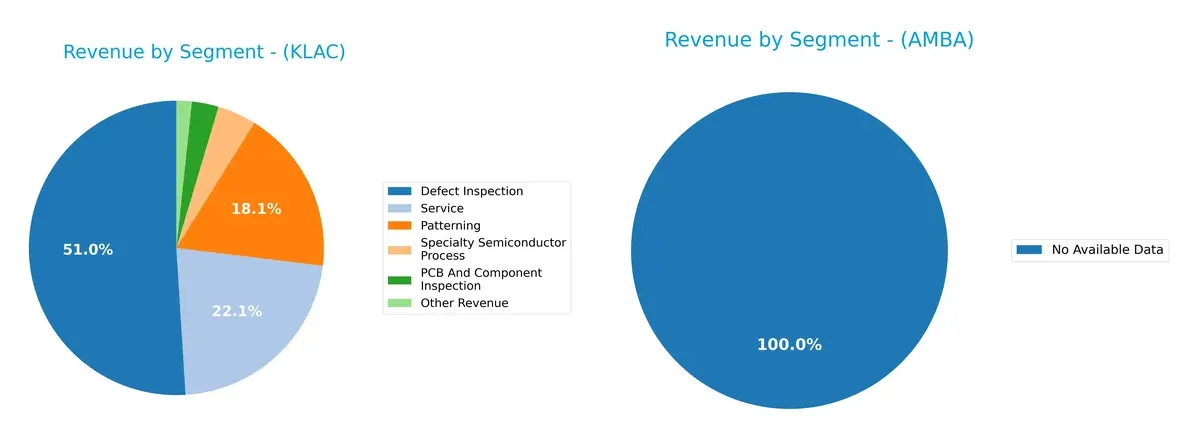
KLA Corporation clearly anchors its revenue in Defect Inspection, generating $6.2B in 2025, dwarfing all other segments. Service at $2.7B and Patterning at $2.2B provide solid secondary pillars, showing moderate diversification. Ambarella lacks available data to evaluate. KLA’s heavy reliance on Defect Inspection signals infrastructure dominance but also concentration risk if market shifts occur. Its diversified services help mitigate exposure, maintaining a balanced strategic mix.
Strengths and Weaknesses Comparison
This table compares the Strengths and Weaknesses of KLA Corporation and Ambarella, Inc.:
KLA Corporation Strengths
- High profitability with 33.41% net margin
- Strong ROE at 86.56% and ROIC at 37.97%
- Solid liquidity with current ratio 2.62 and quick ratio 1.83
- Diverse product segments including Defect Inspection and Patterning
- Broad global presence notably in China, Taiwan, North America, and Korea
- Favorable interest coverage at 16.37 and efficient fixed asset turnover at 9.7
Ambarella, Inc. Strengths
- Strong liquidity with current ratio 2.65 and quick ratio 2.36
- Minimal debt with debt-to-assets at 0.76% and D/E at 0.01
- High fixed asset turnover at 19.96 indicating efficient asset use
- Presence in Asia Pacific, Europe, Taiwan, and North America markets
- Favorable P/E despite negative profitability metrics
KLA Corporation Weaknesses
- Elevated WACC at 10.42% above ROIC
- High valuation multiples with P/B at 25.39 and P/E at 29.34
- Moderate leverage with D/E at 1.3 and debt-to-assets near 38%
- Low dividend yield at 0.76%
- Neutral asset turnover at 0.76
Ambarella, Inc. Weaknesses
- Negative profitability with -41.12% net margin and negative ROE/ROIC
- Unfavorable interest coverage at zero, indicating risk on debt servicing
- Lower asset turnover at 0.41
- No dividend yield
- Higher WACC at 12.99% and unfavorable P/B at 5.64
KLA demonstrates strong profitability, liquidity, and global diversification but faces high valuation and leverage concerns. Ambarella shows liquidity strength and asset efficiency but struggles with profitability and debt servicing risks, impacting its financial stability.
The Moat Duel: Analyzing Competitive Defensibility
A structural moat is the only reliable shield protecting long-term profits from relentless competition erosion. Let’s examine two semiconductor players’ moats:
KLA Corporation: Precision Process Control Moat
KLA’s moat stems from intangible assets in process control technology, driving a 40.7% EBIT margin and 27.5% ROIC premium over WACC. Expanding into advanced semiconductor markets in 2026 should deepen this edge.
Ambarella, Inc.: Niche AI Video Processing Moat
Ambarella relies on AI-driven video compression chips, a narrower moat than KLA’s broad tech base. Its negative ROIC trend signals weakening defensibility, though growth in automotive and security cameras offers upside if profitability improves.
Verdict: Process Control Excellence vs. AI Niche Vulnerability
KLA possesses the wider, more durable moat with strong and growing ROIC, while Ambarella’s shrinking profitability reveals a fragile competitive position. KLA is better equipped to defend and expand its market share in 2026.
Which stock offers better returns?
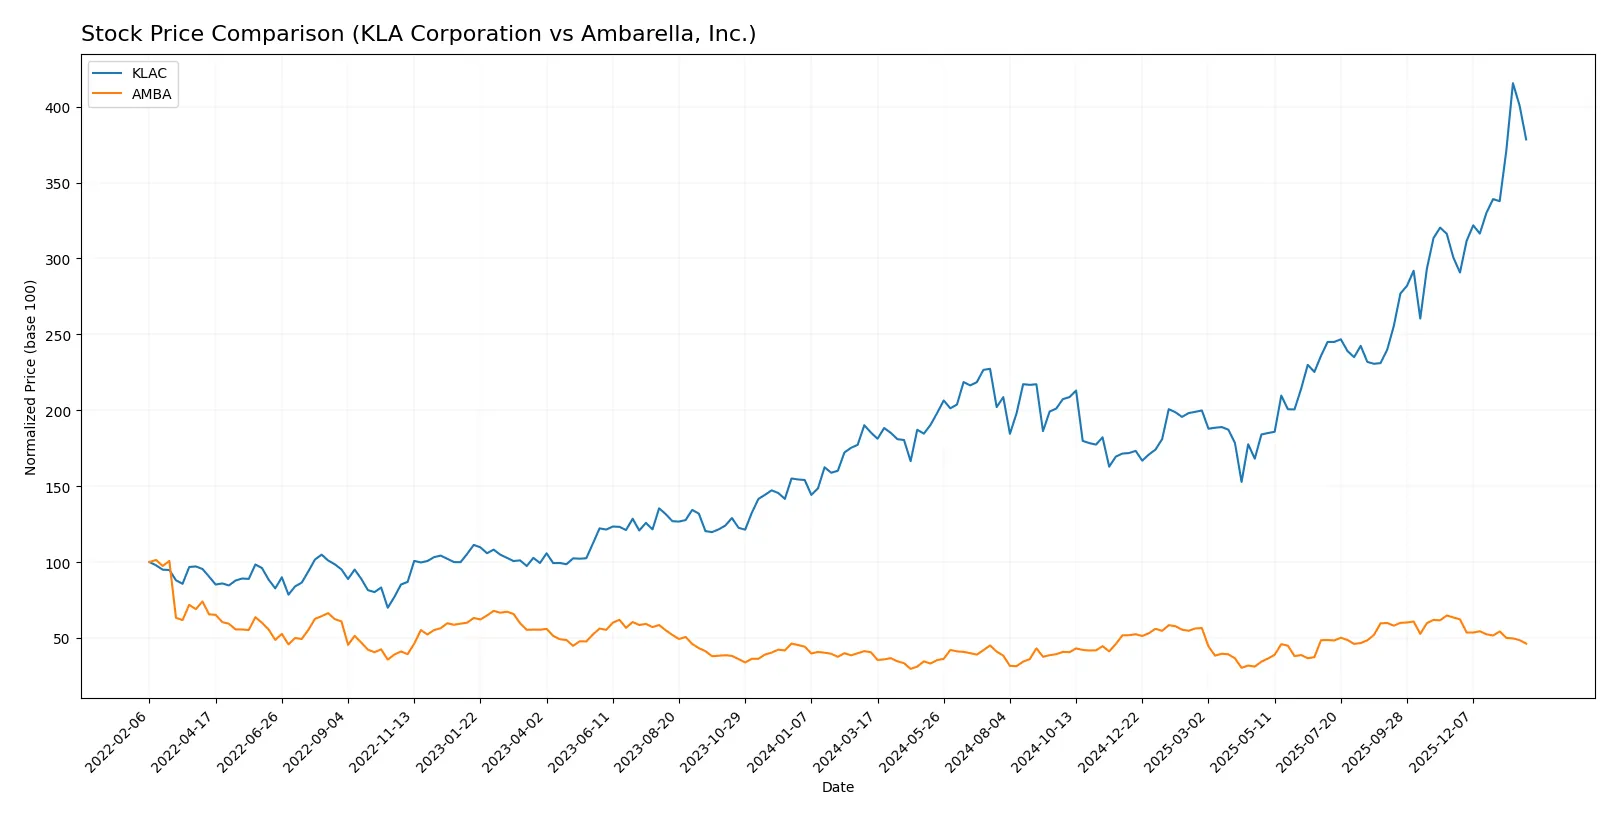
Over the past year, KLA Corporation’s stock more than doubled, showing strong price acceleration. Ambarella, Inc. posted modest gains but faced recent weakness and deceleration in price movement.
Trend Comparison
KLA Corporation’s stock price rose sharply by 104.22% over the past 12 months, indicating a bullish trend with accelerating momentum and significant volatility.
Ambarella, Inc. gained 14.09% in the same period, reflecting a bullish trend but with deceleration. Recent months show a 27.09% decline, signaling emerging weakness.
KLA’s performance clearly outpaces Ambarella’s, delivering the highest market returns and stronger upward trajectory over the analyzed year.
Target Prices
Analysts show a clear upside potential for both KLA Corporation and Ambarella, Inc. based on current consensus targets.
| Company | Target Low | Target High | Consensus |
|---|---|---|---|
| KLA Corporation | 1400 | 1900 | 1672.25 |
| Ambarella, Inc. | 80 | 115 | 97.5 |
The consensus target for KLA is about 17% above its current price of 1428, indicating moderate upside. Ambarella’s target sits over 52% higher than its current 64, reflecting stronger analyst optimism.

Don’t Let Luck Decide Your Entry Point
Optimize your entry points with our advanced ProRealTime indicators. You’ll get efficient buy signals with precise price targets for maximum performance. Start outperforming now!
How do institutions grade them?
Below is a summary of institutional grades for KLA Corporation and Ambarella, Inc.:
KLA Corporation Grades
The following table shows recent grades assigned to KLA Corporation by reputable firms.
| Grading Company | Action | New Grade | Date |
|---|---|---|---|
| RBC Capital | Maintain | Sector Perform | 2026-01-30 |
| Needham | Maintain | Buy | 2026-01-30 |
| Cantor Fitzgerald | Maintain | Overweight | 2026-01-30 |
| Wells Fargo | Maintain | Overweight | 2026-01-30 |
| Jefferies | Maintain | Buy | 2026-01-30 |
| Barclays | Maintain | Overweight | 2026-01-30 |
| Stifel | Maintain | Buy | 2026-01-30 |
| Oppenheimer | Maintain | Outperform | 2026-01-30 |
| Deutsche Bank | Maintain | Hold | 2026-01-21 |
| UBS | Maintain | Neutral | 2026-01-20 |
Ambarella, Inc. Grades
Here are the most recent institutional grades provided for Ambarella, Inc.
| Grading Company | Action | New Grade | Date |
|---|---|---|---|
| Stifel | Maintain | Buy | 2025-11-26 |
| Needham | Maintain | Buy | 2025-11-26 |
| B of A Securities | Maintain | Neutral | 2025-11-26 |
| Rosenblatt | Maintain | Buy | 2025-11-26 |
| Rosenblatt | Maintain | Buy | 2025-11-24 |
| Oppenheimer | Maintain | Perform | 2025-08-29 |
| B of A Securities | Maintain | Neutral | 2025-08-29 |
| Needham | Maintain | Buy | 2025-08-29 |
| Rosenblatt | Maintain | Buy | 2025-08-29 |
| Morgan Stanley | Maintain | Overweight | 2025-08-29 |
Which company has the best grades?
KLA Corporation consistently earns higher and more favorable grades, including multiple Buy and Overweight ratings. Ambarella, Inc. shows a mix of Buy and Neutral ratings with fewer top-tier endorsements. Investors might interpret KLA’s stronger grades as greater confidence by analysts.
Risks specific to each company
The following categories identify the critical pressure points and systemic threats facing both firms in the 2026 market environment:
1. Market & Competition
KLA Corporation
- Dominates semiconductor process control with a large market cap of $188B and diversified product segments.
Ambarella, Inc.
- Faces intense competition in niche video semiconductor solutions with a small $2.8B market cap and narrower product focus.
2. Capital Structure & Debt
KLA Corporation
- Leverages debt moderately with D/E of 1.3, which is a red flag despite strong interest coverage of 16.4x.
Ambarella, Inc.
- Maintains minimal leverage with D/E near zero and negligible interest burden, signaling conservative capital structure.
3. Stock Volatility
KLA Corporation
- Beta of 1.44 implies moderate volatility, with a significant recent price drop (-15%).
Ambarella, Inc.
- Exhibits higher volatility with beta near 1.95 but smaller price decline (-2.8%), reflecting riskier sentiment.
4. Regulatory & Legal
KLA Corporation
- Operates globally in highly regulated semiconductor markets, with potential exposure to export controls.
Ambarella, Inc.
- Faces regulatory scrutiny related to AI and automotive sectors but benefits from smaller scale and agility.
5. Supply Chain & Operations
KLA Corporation
- Complex global supply chain for semiconductor manufacturing equipment, vulnerable to geopolitical disruptions.
Ambarella, Inc.
- Relies on semiconductor chip fabrication partners, less vertically integrated but sensitive to component availability.
6. ESG & Climate Transition
KLA Corporation
- Large established company with ongoing ESG initiatives but faces pressure to reduce carbon footprint in manufacturing.
Ambarella, Inc.
- Smaller footprint and focus on energy-efficient chips, potentially better positioned for climate transition demands.
7. Geopolitical Exposure
KLA Corporation
- High exposure to US-China tensions affecting semiconductor supply chains and sales in Asia.
Ambarella, Inc.
- Also exposed to geopolitical risks but lower scale mitigates potential impact.
Which company shows a better risk-adjusted profile?
KLA Corporation’s main risk is its elevated debt level despite strong profitability and robust Altman Z-Score (12.6). Ambarella suffers from poor profitability and weak financial health, reflected in its negative margins and very weak Piotroski score (3). Despite higher volatility, KLA’s diversified scale and financial strength offer a superior risk-adjusted profile. The recent 15% price drop in KLA signals market concern about leverage, but Ambarella’s persistent losses and low interest coverage present greater fundamental risks.
Final Verdict: Which stock to choose?
KLA Corporation’s superpower lies in its durable competitive advantage, demonstrated by consistently growing returns on invested capital well above its cost of capital. This efficiency fuels strong profitability and cash generation. A point of vigilance remains its elevated debt-to-equity ratio, which slightly increases financial risk. It suits portfolios focused on aggressive growth with an appetite for capital-intensive leaders.
Ambarella, Inc. benefits from a strategic moat rooted in its niche market and relatively low leverage, offering a safer balance sheet compared to KLA. However, persistent value destruction and declining profitability mark significant challenges. This profile fits investors targeting growth at a reasonable price (GARP), willing to tolerate volatility for potential turnaround rewards.
If you prioritize durable value creation and robust profitability, KLA outshines with its proven moat and accelerating momentum. However, if you seek a lower-risk growth play with a defensive capital structure, Ambarella offers better stability despite its current operational setbacks. Both present compelling but distinct analytical scenarios tied to investor risk tolerance and growth expectations.
Disclaimer: Investment carries a risk of loss of initial capital. The past performance is not a reliable indicator of future results. Be sure to understand risks before making an investment decision.
Go Further
I encourage you to read the complete analyses of KLA Corporation and Ambarella, Inc. to enhance your investment decisions: