Home > Comparison > Technology > INTC vs AMBA
The strategic rivalry between Intel Corporation and Ambarella, Inc. shapes the semiconductor sector’s evolution. Intel operates as a capital-intensive industry giant, delivering broad platform and adjacent products worldwide. Ambarella, a niche innovator, focuses on high-margin, AI-driven video processing chips. This analysis pits scale against specialization to determine which corporate trajectory offers superior risk-adjusted returns for diversified portfolios navigating today’s technology landscape.

Table of contents
Companies Overview
Intel Corporation and Ambarella, Inc. both hold pivotal roles in the semiconductor industry, shaping technology’s future with distinct approaches.
Intel Corporation: Semiconductor Giant with Broad Market Reach
Intel leads as a semiconductor powerhouse, generating revenue through designing and selling CPUs, chipsets, and adjacent high-performance compute products. Its 2026 strategy emphasizes expanding platforms for cloud, enterprise, and autonomous driving markets, leveraging AI partnerships to enhance drug discovery and computing solutions.
Ambarella, Inc.: Specialist in Video Semiconductor Solutions
Ambarella specializes in system-on-chip designs for HD and ultra-HD video processing with integrated AI vision algorithms. In 2026, it focuses on automotive cameras, security, robotics, and consumer electronics, aiming to deliver low-power, high-quality video solutions that cater to autonomous vehicles and smart sensing applications.
Strategic Collision: Similarities & Divergences
Both firms compete in semiconductors but diverge philosophically: Intel pursues a broad platform ecosystem, while Ambarella targets niche video and AI-driven applications. Their primary battleground is embedded systems for autonomous and smart technologies. Intel offers scale and diversification; Ambarella provides focused innovation, creating distinct risk and growth profiles for investors.
Income Statement Comparison
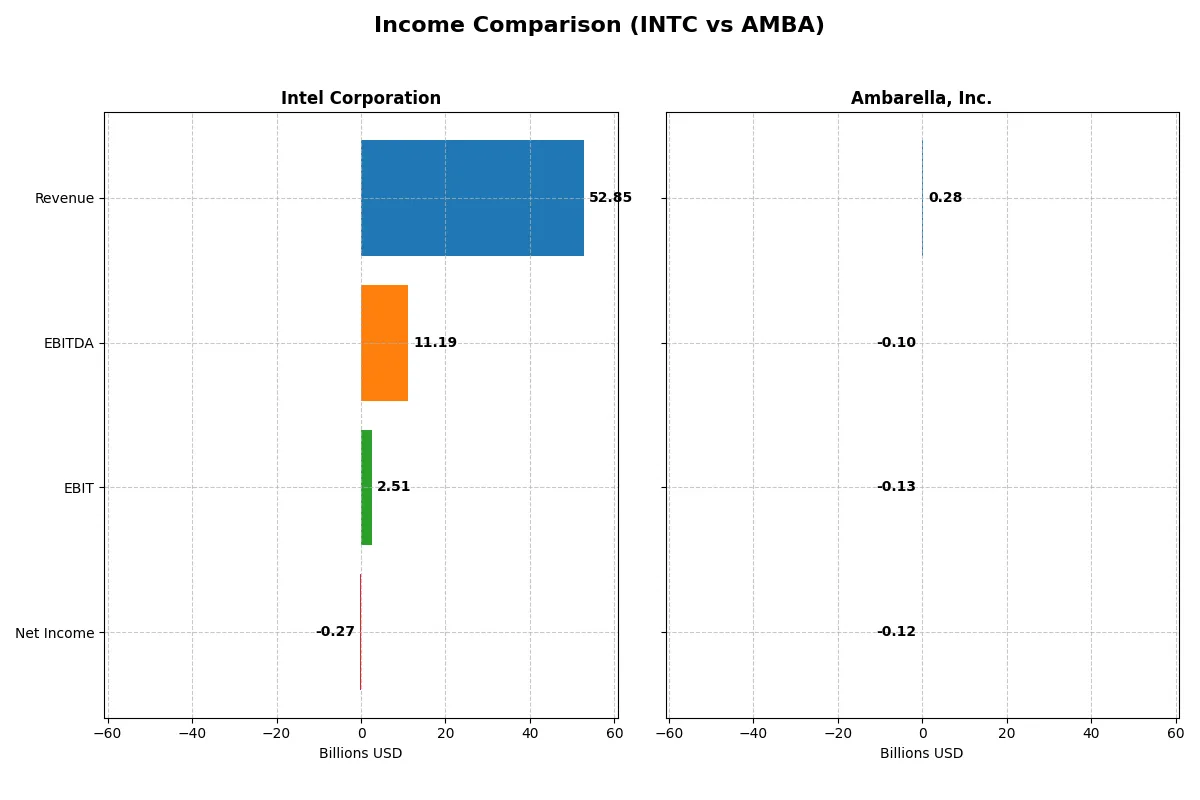
This data dissects the core profitability and scalability of both corporate engines to reveal who dominates the bottom line:
| Metric | Intel Corporation (INTC) | Ambarella, Inc. (AMBA) |
|---|---|---|
| Revenue | 52.9B | 285M |
| Cost of Revenue | 34.4B | 113M |
| Operating Expenses | 20.6B | 299M |
| Gross Profit | 18.5B | 172M |
| EBITDA | 11.2B | -101M |
| EBIT | 2.5B | -127M |
| Interest Expense | 953M | 0 |
| Net Income | -267M | -117M |
| EPS | -0.08 | -2.84 |
| Fiscal Year | 2025 | 2025 |
Income Statement Analysis: The Bottom-Line Duel
This income statement comparison reveals which company converts revenue into profit most efficiently and sustainably.
Intel Corporation Analysis
Intel’s revenue slightly declined from 79B in 2021 to 53B in 2025, reflecting a -33% drop over five years. Gross margin weakened but stayed solid at 35% in 2025, while net income turned negative at -267M. Despite a challenging 2024 loss of -18.8B, Intel improved operating income momentum in 2025, signaling operational stabilization.
Ambarella, Inc. Analysis
Ambarella’s revenue rose steadily from 223M in 2021 to 285M in 2025, a 28% gain. It sustains a strong gross margin above 60%, yet persistent net losses deepened to -117M in 2025. EBIT remains deeply negative at -44%, highlighting ongoing unprofitability despite growth. Ambarella’s improving revenue growth rate contrasts with continued bottom-line pressure.
Margin Resilience vs. Revenue Growth
Intel shows scale and margin resilience but struggles with net profitability and revenue contraction. Ambarella delivers robust revenue growth and exceptional gross margins but faces heavy net losses and negative EBIT margins. Intel’s sheer size and margin recovery offer stability, while Ambarella’s profile suits investors prioritizing growth potential over near-term profits.
Financial Ratios Comparison
These vital ratios act as a diagnostic tool to expose the underlying fiscal health, valuation premiums, and capital efficiency of each company:
| Ratios | Intel Corporation (INTC) | Ambarella, Inc. (AMBA) |
|---|---|---|
| ROE | -0.23% | -20.86% |
| ROIC | -0.02% | -21.96% |
| P/E | -658.4 | -27.05 |
| P/B | 1.54 | 5.64 |
| Current Ratio | 2.02 | 2.65 |
| Quick Ratio | 1.65 | 2.36 |
| D/E | 0.41 | 0.01 |
| Debt-to-Assets | 22.0% | 0.76% |
| Interest Coverage | -2.23 | 0 |
| Asset Turnover | 0.25 | 0.41 |
| Fixed Asset Turnover | 0.50 | 19.96 |
| Payout ratio | 0 | 0 |
| Dividend yield | 0% | 0% |
| Fiscal Year | 2025 | 2025 |
Efficiency & Valuation Duel: The Vital Signs
Financial ratios act as a company’s DNA, exposing underlying risks and operational strengths that raw numbers often conceal.
Intel Corporation
Intel shows weak profitability with a negative ROE of -0.23% and a net margin at -0.51%, signaling operational challenges. Its valuation appears attractive, with a favorable negative P/E due to losses but a neutral price-to-book at 1.54. Intel maintains a solid current ratio of 2.02, but offers no dividend, likely reinvesting heavily in R&D to fuel future growth.
Ambarella, Inc.
Ambarella suffers from severe profitability issues, with ROE at -20.86% and a net margin plunging to -41.12%. The stock trades with a favorable negative P/E of -27.05 but an expensive price-to-book of 5.64, reflecting stretched valuation. Ambarella records a strong current ratio of 2.65 but pays no dividend, focusing instead on intensive R&D spending above 79% of revenue.
Valuation Stretch vs. Operational Strain
Intel balances moderate valuation with operational inefficiencies, while Ambarella faces deeper profitability woes amid a stretched valuation. Intel’s profile suits investors prioritizing stability and reinvestment, whereas Ambarella fits those seeking growth potential despite higher risk.
Which one offers the Superior Shareholder Reward?
Intel Corporation (INTC) pays a modest dividend yield near 1.8% with no recent buyback activity and negative free cash flow, raising sustainability concerns. Ambarella, Inc. (AMBA) pays no dividends but invests heavily in share buybacks and growth, supported by positive free cash flow and a strong cash ratio. Historically, I’ve observed that stable dividends backed by solid free cash flow provide reliable income but Intel’s current cash flow erosion undermines this. Ambarella’s aggressive buybacks and reinvestment signal potential for capital appreciation, though with higher risk given recent losses. For 2026, I judge Ambarella’s distribution model as more sustainable and offering superior total shareholder return, especially for growth-oriented investors willing to accept volatility.
Comparative Score Analysis: The Strategic Profile
The radar chart reveals the fundamental DNA and trade-offs of Intel Corporation and Ambarella, Inc., highlighting their financial strengths and weaknesses:
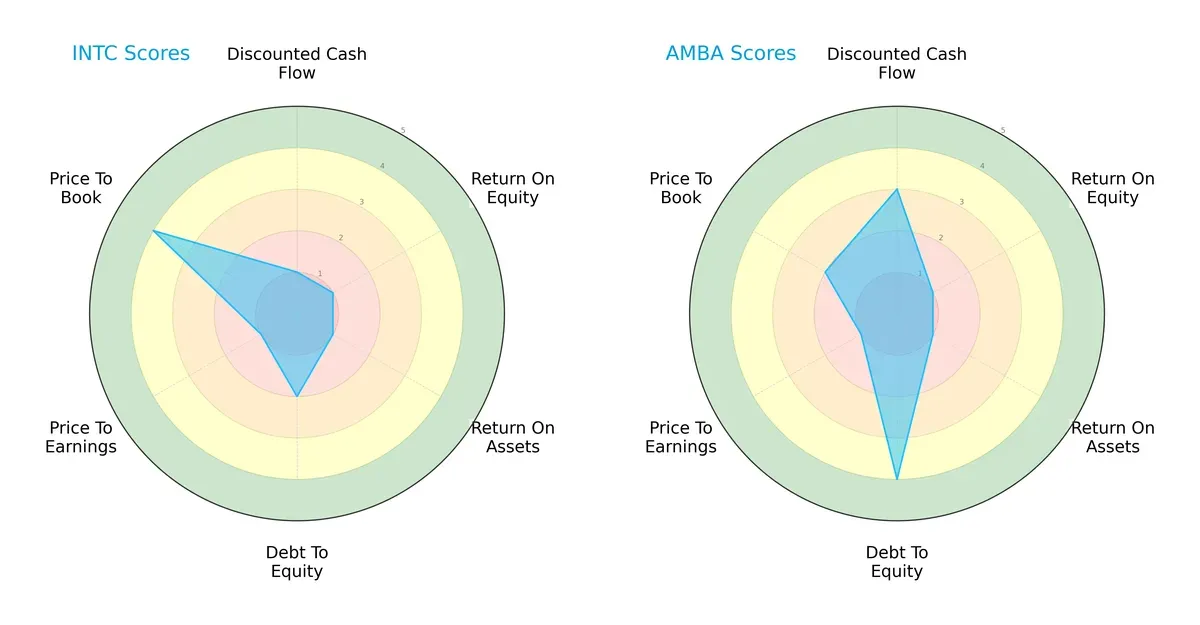
Intel displays a highly skewed profile with weak DCF, ROE, ROA, and P/E scores but a favorable price-to-book score, reflecting possible undervaluation. Ambarella shows strength in discounted cash flow and debt management but shares poor profitability metrics. Ambarella’s balanced leverage and value scores contrast with Intel’s asset utilization struggles, making Ambarella’s profile more balanced overall.
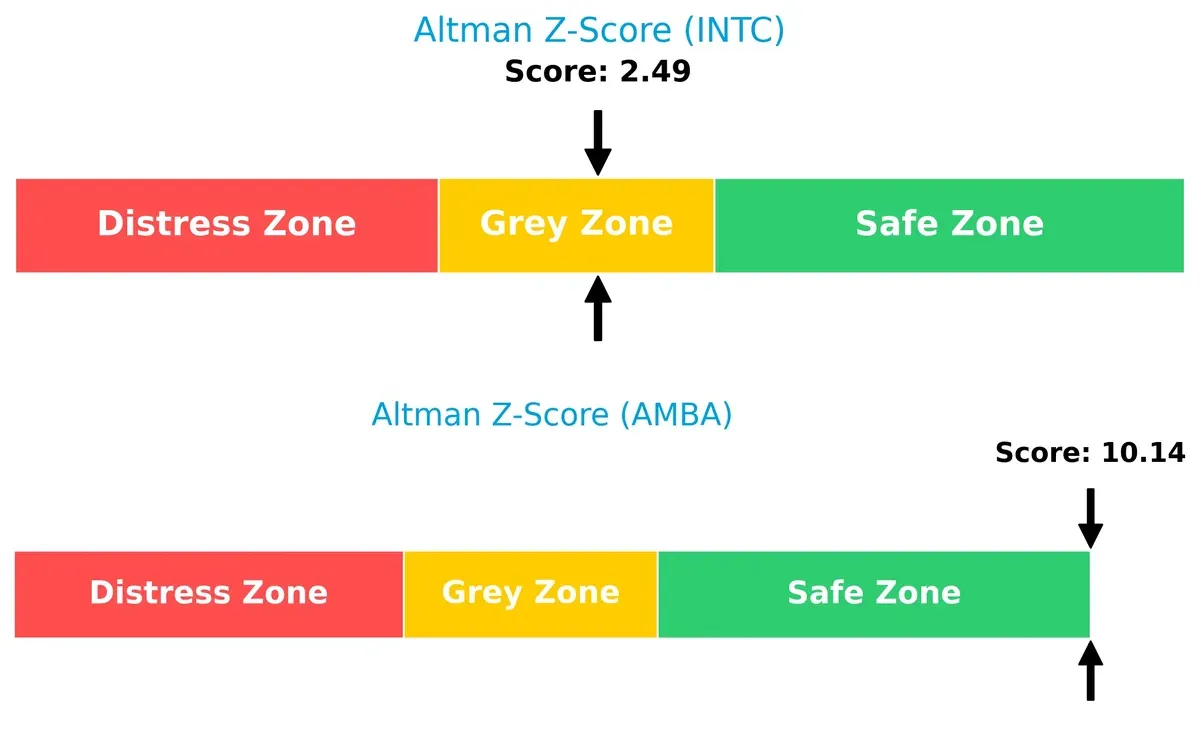
Bankruptcy Risk: Solvency Showdown
Intel’s Altman Z-Score of 2.49 places it in the grey zone, signaling moderate bankruptcy risk. Ambarella’s 10.14 score firmly situates it in the safe zone, strongly indicating long-term solvency:
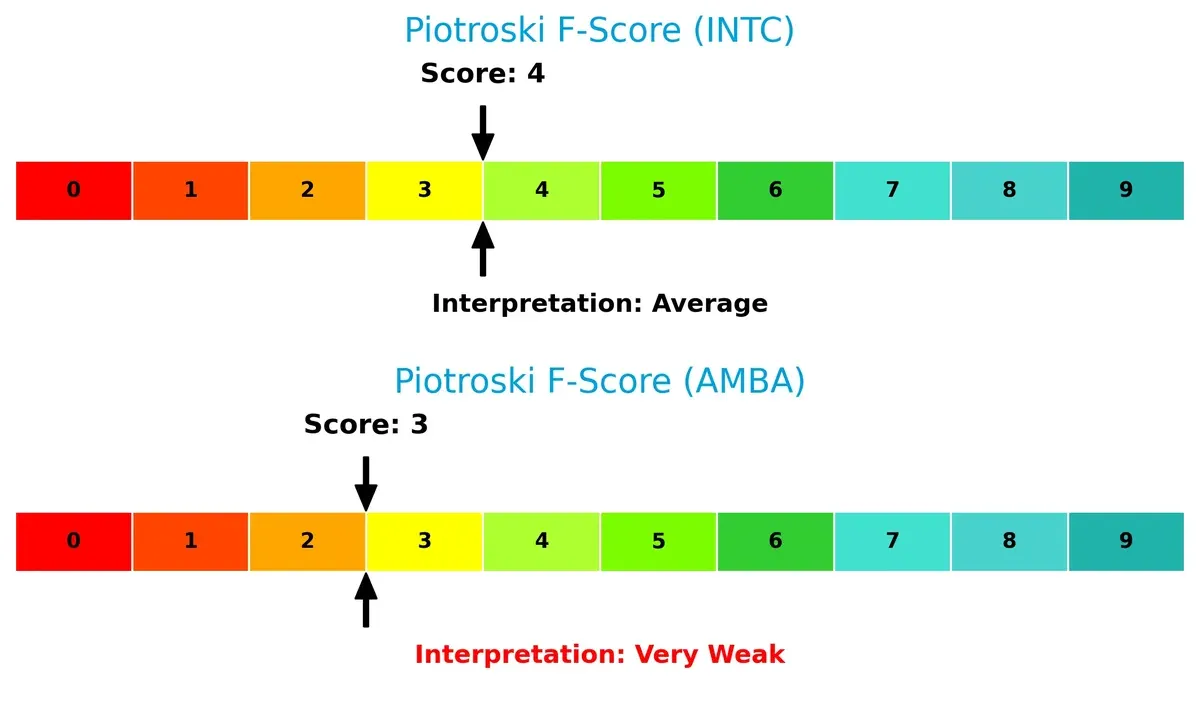
Financial Health: Quality of Operations
Intel’s Piotroski F-Score of 4 suggests average financial health, while Ambarella’s score of 3 flags potential red flags in operational metrics and cash flow quality:
How are the two companies positioned?
This section dissects Intel and Ambarella’s operational DNA by comparing their revenue distribution and internal strengths and weaknesses. The goal is to confront their economic moats and identify which model delivers the most resilient, sustainable competitive advantage today.
Revenue Segmentation: The Strategic Mix
This visual comparison dissects how Intel Corporation and Ambarella, Inc. diversify their income streams and where their primary sector bets lie:
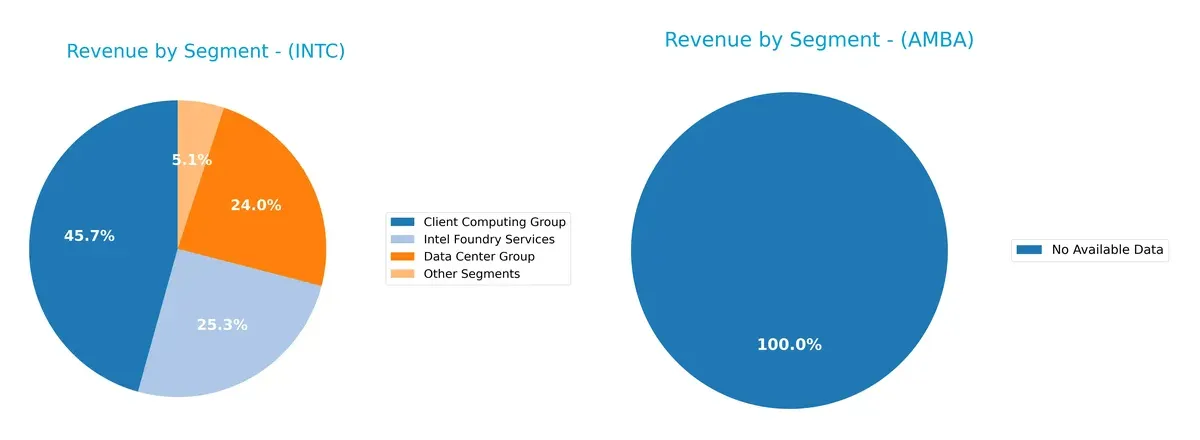
Intel Corporation anchors its revenue in three major segments: Client Computing Group at $32.2B, Intel Foundry Services at $17.8B, and Data Center Group at $16.9B. This mix shows moderate diversification with strong ecosystem lock-in through foundry capabilities. Ambarella, Inc. lacks available segment data, preventing a direct comparison. Intel’s broad segmentation reduces concentration risk, supporting resilience amid tech cycles and competitive pressures.
Strengths and Weaknesses Comparison
This table compares the Strengths and Weaknesses of Intel Corporation and Ambarella, Inc.:
Intel Strengths
- Diverse revenue streams including Client Computing, Data Center, and Foundry Services
- Strong global presence with significant sales in US, Singapore, Taiwan, China
- Favorable liquidity ratios with current ratio 2.02 and quick ratio 1.65
Ambarella Strengths
- Favorable liquidity with current ratio 2.65 and quick ratio 2.36
- Very low debt-to-equity and debt-to-assets ratios indicating strong balance sheet
- High fixed asset turnover at 19.96 showing efficient use of fixed assets
Intel Weaknesses
- Negative profitability metrics: net margin -0.51%, ROE -0.23%, ROIC -0.02%
- Unfavorable asset turnover ratios indicating lower efficiency
- No dividend yield reduces appeal for income investors
Ambarella Weaknesses
- Severely negative profitability: net margin -41.12%, ROE -20.86%, ROIC -21.96%
- Unfavorable high WACC at 12.99% and poor interest coverage ratio of 0
- High price-to-book ratio 5.64 points to possible overvaluation risk
Intel exhibits strong diversification and global footprint but struggles with profitability and asset efficiency. Ambarella maintains robust liquidity and asset utilization but faces acute profitability and cost of capital challenges. These contrasts highlight differing strategic and operational profiles in today’s market environment.
The Moat Duel: Analyzing Competitive Defensibility
A structural moat alone defends long-term profits from relentless competitive erosion. Let’s dissect how Intel and Ambarella sustain their edges:
Intel Corporation: Scale and Integration Moat
Intel’s moat stems from its vast manufacturing scale and integrated platform products. This delivers stable gross margins near 35% despite margin pressures. In 2026, its push into AI and autonomous driving could deepen this moat or face disruption from more agile rivals.
Ambarella, Inc.: Niche Innovation Moat
Ambarella relies on specialized AI-driven video processing chips, differentiating from Intel’s broad scale. It commands a premium gross margin above 60% but suffers negative EBIT margins, signaling investment to capture growth. Expansion into automotive and robotics markets may strengthen its moat if profitability improves.
The Verdict: Scale Dominance vs. Innovation Focus
Intel’s scale-based moat is broader but currently under margin and profitability stress. Ambarella’s innovation moat is narrower but promises higher gross margins with growth upside. Intel remains better positioned to defend market share due to entrenched infrastructure despite short-term value erosion.
Which stock offers better returns?
Over the past year, Intel Corporation’s stock gained 5.61%, showing accelerating bullish momentum, while Ambarella, Inc. rose 14.09% but with decelerating gains and recent weakness.
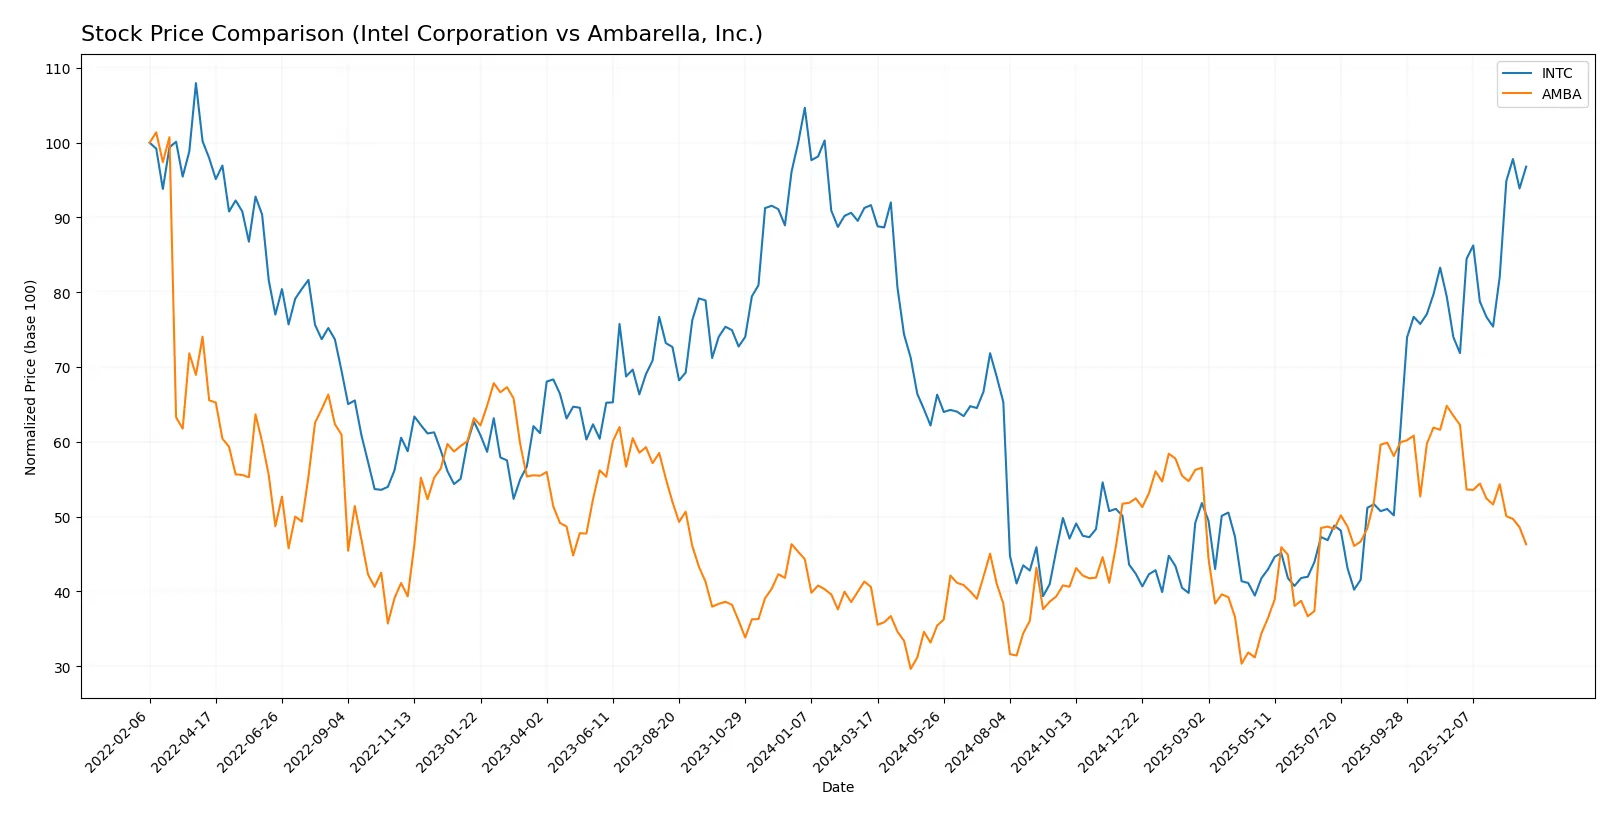
Trend Comparison
Intel’s stock shows a bullish trend with a 5.61% gain over 12 months, accelerating and supported by a moderate 8.11 volatility. The recent 30.83% surge confirms strong upward momentum.
Ambarella’s stock gained 14.09% over the year, a bullish but decelerating trend. Volatility is higher at 12.79, and recent losses of 27.09% indicate short-term weakness and negative slope.
Ambarella delivered higher annual returns, but Intel’s accelerating trend and recent strong gains suggest more consistent upward momentum through early 2026.
Target Prices
Analysts present a broad but optimistic target consensus for Intel Corporation and Ambarella, Inc.
| Company | Target Low | Target High | Consensus |
|---|---|---|---|
| Intel Corporation | 20 | 66 | 46.95 |
| Ambarella, Inc. | 80 | 115 | 97.5 |
Intel’s target consensus of 46.95 closely aligns with its current price of 46.47, indicating a balanced risk-reward profile. Ambarella’s consensus target of 97.5 suggests strong upside potential from its current 64.04 price.

Don’t Let Luck Decide Your Entry Point
Optimize your entry points with our advanced ProRealTime indicators. You’ll get efficient buy signals with precise price targets for maximum performance. Start outperforming now!
How do institutions grade them?
Intel Corporation Grades
The following table summarizes recent grades from major financial institutions for Intel Corporation:
| Grading Company | Action | New Grade | Date |
|---|---|---|---|
| RBC Capital | maintain | Sector Perform | 2026-01-23 |
| Wedbush | maintain | Neutral | 2026-01-23 |
| Stifel | maintain | Hold | 2026-01-23 |
| UBS | maintain | Neutral | 2026-01-23 |
| Keybanc | maintain | Overweight | 2026-01-23 |
| Roth Capital | maintain | Neutral | 2026-01-23 |
| Needham | maintain | Hold | 2026-01-23 |
| Morgan Stanley | maintain | Equal Weight | 2026-01-23 |
| Benchmark | maintain | Buy | 2026-01-23 |
| Evercore ISI Group | maintain | In Line | 2026-01-23 |
Ambarella, Inc. Grades
This table shows recent institutional grades for Ambarella, Inc.:
| Grading Company | Action | New Grade | Date |
|---|---|---|---|
| Stifel | maintain | Buy | 2025-11-26 |
| Needham | maintain | Buy | 2025-11-26 |
| B of A Securities | maintain | Neutral | 2025-11-26 |
| Rosenblatt | maintain | Buy | 2025-11-26 |
| Rosenblatt | maintain | Buy | 2025-11-24 |
| Oppenheimer | maintain | Perform | 2025-08-29 |
| B of A Securities | maintain | Neutral | 2025-08-29 |
| Needham | maintain | Buy | 2025-08-29 |
| Rosenblatt | maintain | Buy | 2025-08-29 |
| Morgan Stanley | maintain | Overweight | 2025-08-29 |
Which company has the best grades?
Ambarella consistently receives Buy and Overweight ratings, indicating stronger institutional confidence. Intel’s grades cluster around Neutral and Hold, suggesting more cautious outlooks. This contrast may influence investor sentiment and portfolio positioning.
Risks specific to each company
The following categories identify critical pressure points and systemic threats facing both firms in the 2026 market environment:
1. Market & Competition
Intel Corporation
- Faces intense competition from global semiconductor giants; large scale and R&D investments are barriers but pressure remains high.
Ambarella, Inc.
- Operates in niche video semiconductor markets but faces rapid technological shifts and competition from larger players expanding into AI and vision chips.
2. Capital Structure & Debt
Intel Corporation
- Moderate leverage with debt-to-assets at 22%; interest coverage ratio is low but manageable, indicating cautious capital allocation.
Ambarella, Inc.
- Minimal debt exposure with debt-to-assets below 1%; interest coverage at zero signals risk if earnings do not improve soon.
3. Stock Volatility
Intel Corporation
- Beta at 1.35 suggests moderate volatility, typical for large-cap tech firms; market cap provides stability.
Ambarella, Inc.
- High beta of 1.95 indicates elevated stock price swings; smaller market cap adds to vulnerability in turbulent markets.
4. Regulatory & Legal
Intel Corporation
- Subject to stringent global semiconductor regulations and ongoing scrutiny over competition practices.
Ambarella, Inc.
- Faces regulatory risks linked to automotive and surveillance applications, including privacy and export controls.
5. Supply Chain & Operations
Intel Corporation
- Large, complex supply chain with exposure to global disruptions but diversified manufacturing mitigates some risks.
Ambarella, Inc.
- Smaller scale supply chain; dependence on specialized suppliers could cause bottlenecks amid industry shortages.
6. ESG & Climate Transition
Intel Corporation
- Significant ESG commitments but faces challenges in reducing carbon footprint across extensive manufacturing operations.
Ambarella, Inc.
- ESG risks stem mainly from product applications and energy use; smaller scale eases transition but less public disclosure.
7. Geopolitical Exposure
Intel Corporation
- High geopolitical risk due to global manufacturing footprint and US-China tech tensions affecting supply and sales.
Ambarella, Inc.
- Limited international exposure reduces geopolitical risk but reliance on US market and partners remains a factor.
Which company shows a better risk-adjusted profile?
Intel’s principal risk lies in geopolitical exposure and operational complexity, while Ambarella’s most impactful risk is financial fragility due to negative profitability and interest coverage. Intel’s balanced capital structure and scale provide a comparatively stronger risk-adjusted profile, despite sector headwinds. Ambarella’s high volatility and weak financial scores pose greater downside risks for investors in 2026.
Final Verdict: Which stock to choose?
Intel Corporation’s superpower lies in its robust operational infrastructure and solid liquidity position, which provide a foundation for steady recovery. Its main point of vigilance is the consistent value erosion reflected in declining profitability metrics. Intel suits investors with a tolerance for cyclical turnaround plays and deep industry expertise—typically fitting an Aggressive Growth portfolio.
Ambarella, Inc. boasts a strategic moat rooted in its high-margin niche and strong R&D focus, fueling innovation-led growth. It carries a safer balance sheet relative to Intel but faces margin pressure from operational inefficiencies. Ambarella aligns with investors targeting GARP (Growth at a Reasonable Price) profiles, seeking innovation exposure tempered by manageable risk.
If you prioritize resilient operational scale and long-term cyclical recovery, Intel presents a compelling choice due to its entrenched market position despite current headwinds. However, if you seek exposure to nimble innovation with a cleaner balance sheet, Ambarella offers better stability amid growth challenges. Both require careful risk monitoring given their value destruction trends.
Disclaimer: Investment carries a risk of loss of initial capital. The past performance is not a reliable indicator of future results. Be sure to understand risks before making an investment decision.
Go Further
I encourage you to read the complete analyses of Intel Corporation and Ambarella, Inc. to enhance your investment decisions: