Ambarella, Inc. and CEVA, Inc. are two prominent players in the semiconductor industry, each driving innovation in video processing and smart sensing technologies. Ambarella focuses on AI-powered video solutions for automotive and consumer markets, while CEVA specializes in licensing wireless connectivity and AI processors for diverse applications. This comparison highlights their market approaches and growth potential, helping you identify which company offers the best investment opportunity in 2026.

Table of contents
Companies Overview
I will begin the comparison between Ambarella and CEVA by providing an overview of these two companies and their main differences.
Ambarella Overview
Ambarella, Inc. develops semiconductor solutions focused on video, enabling HD and ultra HD compression, image processing, and AI-driven computer vision globally. Its system-on-a-chip integrates video, image, and audio processing with AI, targeting applications in automotive cameras, security, robotics, and consumer devices. Founded in 2004 and headquartered in Santa Clara, Ambarella positions itself as a key player in video-centric semiconductor technology.
CEVA Overview
CEVA, Inc. is a licensor of wireless connectivity and smart sensing technologies, including DSPs, AI processors, and platforms for 5G, IoT, and imaging applications. The company licenses IP to semiconductor and OEM firms for integration into mobile, consumer, automotive, robotics, and industrial products. Founded in 1999 and based in Rockville, CEVA specializes in enabling wireless and sensing technologies through licensing models worldwide.
Key similarities and differences
Both Ambarella and CEVA operate in the semiconductor sector with a focus on advanced technologies such as AI and signal processing. Ambarella emphasizes integrated solutions for video and image processing with hardware products, while CEVA focuses on licensing digital signal and AI processors alongside software platforms for wireless and sensing applications. Their business models differ, with Ambarella engaging in product sales and CEVA relying on intellectual property licensing.
Income Statement Comparison
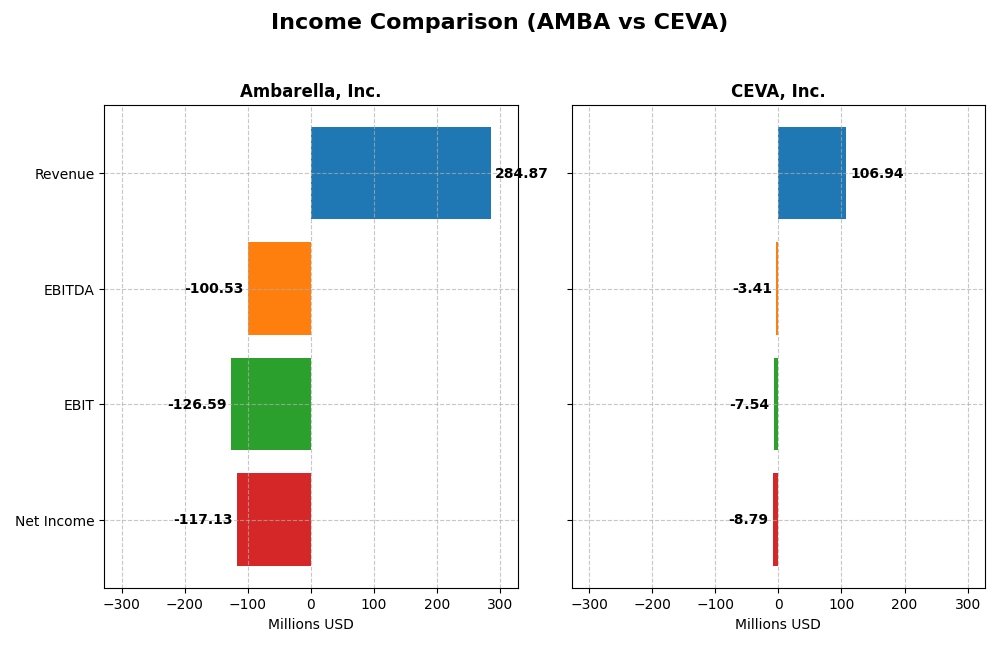
The table below presents a side-by-side comparison of key income statement metrics for Ambarella, Inc. and CEVA, Inc. for the most recent fiscal year available.
| Metric | Ambarella, Inc. (AMBA) | CEVA, Inc. (CEVA) |
|---|---|---|
| Market Cap | 2.89B | 546M |
| Revenue | 285M | 107M |
| EBITDA | -101M | -3.41M |
| EBIT | -127M | -7.55M |
| Net Income | -117M | -8.79M |
| EPS | -2.84 | -0.37 |
| Fiscal Year | 2025 | 2024 |
Income Statement Interpretations
Ambarella, Inc.
Ambarella’s revenue grew overall by 27.75% from 2021 to 2025, with a notable 25.78% increase in the most recent year. Despite this growth, net income declined sharply by 95.91% over the period, reflecting consistent net losses. Gross margins remained strong and favorable at 60.5%, but negative net margins around -41.12% indicate ongoing profitability challenges, though net margin improved by 45.04% last year.
CEVA, Inc.
CEVA showed modest revenue growth of 6.59% over 2020-2024, with a 9.77% increase in the latest fiscal year. Gross margin is very high at 88.06%, yet the company also reported net losses, with net margin at -8.22%. Despite unfavorable net income trends over the period, recent improvements are visible with a 32.62% rise in net margin and a 43.97% growth in EBIT, indicating operational gains in the latest year.
Which one has the stronger fundamentals?
Ambarella demonstrates stronger revenue growth and a robust gross margin, but struggles with deep net losses and negative EBIT margins, though showing recent improvements. CEVA benefits from a superior gross margin and improving operating results but has weaker revenue growth and persistent net losses that have worsened overall. Both companies face profitability hurdles, with Ambarella’s fundamentals slightly more favorable due to stronger growth dynamics.
Financial Ratios Comparison
This table presents key financial ratios for Ambarella, Inc. and CEVA, Inc. for their most recent fiscal years, offering a snapshot of their profitability, liquidity, leverage, and efficiency.
| Ratios | Ambarella, Inc. (2025) | CEVA, Inc. (2024) |
|---|---|---|
| ROE | -20.9% | -3.3% |
| ROIC | -21.96% | -2.68% |
| P/E | -27.1 | -84.8 |
| P/B | 5.64 | 2.79 |
| Current Ratio | 2.65 | 7.09 |
| Quick Ratio | 2.36 | 7.09 |
| D/E (Debt-to-Equity) | 0.0094 | 0.021 |
| Debt-to-Assets | 0.76% | 1.80% |
| Interest Coverage | 0 | 0 |
| Asset Turnover | 0.41 | 0.35 |
| Fixed Asset Turnover | 19.96 | 8.43 |
| Payout Ratio | 0 | 0 |
| Dividend Yield | 0 | 0 |
Interpretation of the Ratios
Ambarella, Inc.
Ambarella shows mixed ratio strength with favorable current and quick ratios at 2.65 and 2.36, respectively, indicating solid liquidity. However, profitability is weak with a -20.86% ROE and -41.12% net margin, signaling operational challenges. The company does not pay dividends, likely prioritizing reinvestment and R&D, consistent with its 79.4% R&D to revenue ratio.
CEVA, Inc.
CEVA’s ratios reflect moderate liquidity with a high quick ratio of 7.09 but a less favorable current ratio. Profitability remains weak, with a -3.3% ROE and -8.22% net margin. Like Ambarella, CEVA pays no dividends, which aligns with its focus on growth and technology investment, supported by a 67.0% R&D to revenue ratio and no dividend yield.
Which one has the best ratios?
Both Ambarella and CEVA exhibit unfavorable global ratio evaluations, with Ambarella slightly ahead due to stronger liquidity and asset turnover ratios. CEVA’s higher quick ratio and lower debt levels are positive, but both companies face profitability and coverage concerns. Neither currently returns capital via dividends, reflecting growth and reinvestment strategies.
Strategic Positioning
This section compares the strategic positioning of Ambarella, Inc. and CEVA, Inc., focusing on Market position, Key segments, and Exposure to technological disruption:
Ambarella, Inc.
- Mid-market player in semiconductors, facing strong competitive pressure.
- Focuses on HD video processing chips for automotive, security, robotics, and consumer cameras.
- Exposure to disruption through AI and computer vision integrated in system-on-chip designs.
CEVA, Inc.
- Smaller market cap with competitive pressure in licensing wireless and smart sensing IP.
- Licenses DSP, AI processors, wireless platforms, targeting 5G, IoT, imaging, and smart sensing.
- Faces disruption risk from evolving wireless standards and AI-driven smart sensing technologies.
Ambarella, Inc. vs CEVA, Inc. Positioning
Ambarella offers a diversified product portfolio centered on video processing chips across multiple end markets, while CEVA concentrates on licensing wireless and sensing IP. Ambarella’s broad application scope contrasts with CEVA’s specialized technology licensing model, reflecting differing strategic focuses.
Which has the best competitive advantage?
Both companies exhibit very unfavorable MOAT evaluations with declining ROIC trends, indicating value destruction and no clear sustainable competitive advantage based on current capital efficiency data.
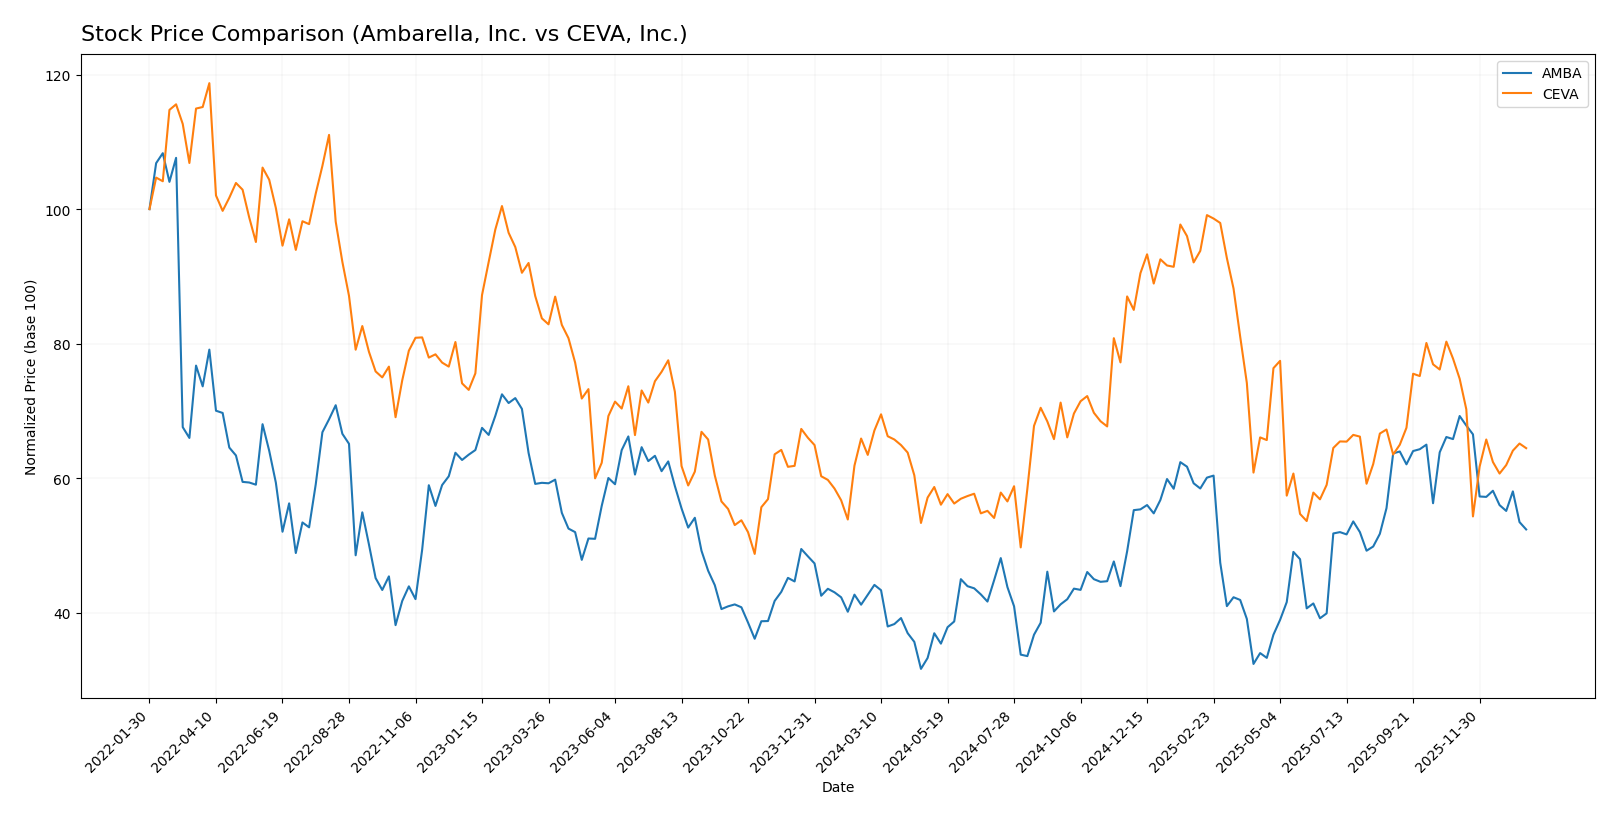
Stock Comparison
The stock price movements of Ambarella, Inc. and CEVA, Inc. over the past year reveal distinct trading dynamics, with Ambarella showing a strong overall gain despite recent declines, while CEVA’s price change remains minimal and near neutral.
Trend Analysis
Ambarella’s stock posted a bullish trend over the past 12 months with a 22.75% increase but exhibited deceleration and a recent downturn of -20.41% from November 2025 to January 2026. CEVA’s stock showed a neutral overall trend with a 1.58% increase and deceleration, followed by a recent decline of -17.13% in the same recent period. Comparing the two, Ambarella delivered the highest market performance overall, outperforming CEVA significantly despite short-term negative momentum.
Target Prices
The analyst consensus presents a clear target range and price expectations for Ambarella, Inc. and CEVA, Inc.
| Company | Target High | Target Low | Consensus |
|---|---|---|---|
| Ambarella, Inc. | 115 | 80 | 97.5 |
| CEVA, Inc. | 28 | 28 | 28 |
Analysts expect Ambarella’s stock to rise significantly from its current price of 68.24 USD, indicating strong growth potential. CEVA’s target price of 28 USD also suggests upside from its present price of 22.74 USD, reflecting moderate optimism.
Analyst Opinions Comparison
This section compares analysts’ ratings and scores for Ambarella, Inc. and CEVA, Inc.:
Rating Comparison
AMBA Rating
- Rating: C+, indicating a very favorable overall rating.
- Discounted Cash Flow Score: 3, considered moderate.
- ROE Score: 1, rated very unfavorable for profitability.
- ROA Score: 1, very unfavorable indicating weak asset use.
- Debt To Equity Score: 4, favorable, showing low financial risk.
CEVA Rating
- Rating: C+, indicating a very favorable overall rating.
- Discounted Cash Flow Score: 3, considered moderate.
- ROE Score: 1, rated very unfavorable for profitability.
- ROA Score: 1, very unfavorable indicating weak asset use.
- Debt To Equity Score: 4, favorable, showing low financial risk.
Which one is the best rated?
Both AMBA and CEVA share identical ratings and financial scores across all evaluated categories, including overall rating, DCF, ROE, ROA, and debt-to-equity, resulting in equal analyst assessments.
Scores Comparison
Here is a comparison of the Altman Z-Score and Piotroski Score for Ambarella, Inc. and CEVA, Inc.:
AMBA Scores
- Altman Z-Score: 10.69, indicating a safe zone with very low bankruptcy risk.
- Piotroski Score: 3, classified as very weak financial strength.
CEVA Scores
- Altman Z-Score: 9.99, also in the safe zone, indicating low bankruptcy risk.
- Piotroski Score: 4, representing average financial strength.
Which company has the best scores?
Both AMBA and CEVA have strong Altman Z-Scores in the safe zone, suggesting financial stability. However, CEVA’s Piotroski Score is higher (4 versus 3), indicating relatively better financial strength compared to AMBA.
Grades Comparison
Here is a detailed comparison of the recent grades assigned to Ambarella, Inc. and CEVA, Inc.:
Ambarella, Inc. Grades
The table below presents recent grades from reputable financial institutions for Ambarella, Inc.:
| Grading Company | Action | New Grade | Date |
|---|---|---|---|
| B of A Securities | Maintain | Neutral | 2025-11-26 |
| Needham | Maintain | Buy | 2025-11-26 |
| Stifel | Maintain | Buy | 2025-11-26 |
| Rosenblatt | Maintain | Buy | 2025-11-26 |
| Rosenblatt | Maintain | Buy | 2025-11-24 |
| Stifel | Maintain | Buy | 2025-08-29 |
| Needham | Maintain | Buy | 2025-08-29 |
| Northland Capital Markets | Maintain | Outperform | 2025-08-29 |
| Morgan Stanley | Maintain | Overweight | 2025-08-29 |
| Oppenheimer | Maintain | Perform | 2025-08-29 |
Ambarella’s grades consistently indicate a positive outlook, with a majority of “Buy” and “Outperform” ratings maintained recently.
CEVA, Inc. Grades
The table below presents recent grades from reputable financial institutions for CEVA, Inc.:
| Grading Company | Action | New Grade | Date |
|---|---|---|---|
| Barclays | Maintain | Overweight | 2025-11-12 |
| Rosenblatt | Maintain | Buy | 2025-11-11 |
| Rosenblatt | Maintain | Buy | 2025-08-14 |
| Oppenheimer | Maintain | Outperform | 2025-05-09 |
| Rosenblatt | Maintain | Buy | 2025-05-08 |
| Barclays | Maintain | Overweight | 2025-05-08 |
| Rosenblatt | Maintain | Buy | 2025-04-23 |
| Barclays | Maintain | Overweight | 2025-02-14 |
| Rosenblatt | Maintain | Buy | 2025-02-14 |
| Rosenblatt | Maintain | Buy | 2025-02-11 |
CEVA’s grades also show a positive consensus with multiple “Buy,” “Overweight,” and “Outperform” recommendations consistently maintained over time.
Which company has the best grades?
Both Ambarella, Inc. and CEVA, Inc. have garnered predominantly positive grades from respected financial institutions, with strong “Buy” and “Outperform” recommendations. Ambarella shows a broader mix including “Neutral” and “Perform” ratings, while CEVA’s grades lean more consistently toward “Buy” and “Overweight.” Investors may interpret CEVA’s more concentrated positive ratings as a clearer confidence signal, whereas Ambarella’s variety reflects a slightly more diverse analyst perspective.
Strengths and Weaknesses
The following table summarizes the key strengths and weaknesses of Ambarella, Inc. (AMBA) and CEVA, Inc. based on recent financial and operational data.
| Criterion | Ambarella, Inc. (AMBA) | CEVA, Inc. |
|---|---|---|
| Diversification | Limited product diversification; primarily in video processing technology | Moderately diversified with license and royalty revenues from connectivity and sensing products |
| Profitability | Negative net margin (-41.12%), ROIC -21.96%, value destroying | Negative net margin (-8.22%), ROIC -2.68%, also value destroying but less severe |
| Innovation | Declining ROIC trend suggests weakening competitive edge | Declining ROIC trend, indicating challenges in maintaining innovation advantage |
| Global presence | Moderate global footprint but struggling financially | Established global presence with steady license and royalty growth |
| Market Share | Facing pressure with unfavorable financial ratios and low asset turnover | Stable market share in niche semiconductor IP market, but profitability issues persist |
In summary, both companies exhibit significant challenges in profitability and value creation, with Ambarella showing more severe financial strain. CEVA’s more diversified revenue streams offer some resilience, but both require cautious risk management before investing.
Risk Analysis
The table below summarizes key risk factors for Ambarella, Inc. and CEVA, Inc. based on the most recent financial and market data available.
| Metric | Ambarella, Inc. (AMBA) | CEVA, Inc. (CEVA) |
|---|---|---|
| Market Risk | High beta (1.95) implies higher volatility and sensitivity to market swings. | Moderate beta (1.44) suggests moderate market volatility exposure. |
| Debt level | Very low debt-to-equity (0.01) and debt-to-assets (0.76%) indicate minimal leverage risk. | Low debt-to-equity (0.02) and debt-to-assets (1.8%) also show conservative leverage. |
| Regulatory Risk | Moderate, given semiconductor industry sensitivity to export controls and data privacy laws. | Similar regulatory exposure as AMBA with additional risks around licensing and IP protections. |
| Operational Risk | Unfavorable net margin (-41.12%) and negative ROE suggest operational inefficiencies or high costs. | Negative net margin (-8.22%) and ROE (-3.3%) indicate operational challenges but less severe than AMBA. |
| Environmental Risk | Moderate, semiconductor manufacturing carries environmental compliance costs and resource usage. | Moderate, with risks linked to R&D and manufacturing subcontractors. |
| Geopolitical Risk | Exposure due to global supply chains and US-China tech tensions impacting semiconductor sector. | Similar geopolitical risk as AMBA, with potential impact on licensing agreements and technology exports. |
Ambarella faces the most impactful risks from poor profitability and high market volatility, despite strong balance sheet health. CEVA shows operational weaknesses but with lower market risk. Both are vulnerable to geopolitical and regulatory shifts affecting the semiconductor industry. Caution is advised given current negative profitability trends.
Which Stock to Choose?
Ambarella, Inc. (AMBA) shows a favorable income evolution with a 25.78% revenue growth in 2025 and a gross margin of 60.5%, but suffers from unfavorable profitability ratios including a -41.12% net margin and negative returns on equity and capital. Its debt levels and liquidity ratios are favorable, with a current ratio of 2.65, yet the company is rated very favorably overall (C+) despite its value destruction indicated by a declining ROIC well below WACC.
CEVA, Inc. (CEVA) reports a modest 9.77% revenue growth in 2024 and a high gross margin of 88.06%, with better but still negative profitability metrics such as an -8.22% net margin and slight negative returns on equity and capital. Its liquidity ratios are mixed, with a very high current ratio of 7.09, and it holds a similar very favorable rating (C+) but also shows a declining ROIC substantially below WACC, signaling value destruction.
For investors, the choice might depend on risk tolerance and investment focus: those seeking stronger recent income growth and operational scale might find AMBA more appealing, while investors valuing higher gross margins and stronger liquidity might lean toward CEVA. Both companies exhibit unfavorable profitability and value destruction characteristics, suggesting cautious interpretation of their financials in light of their respective ratings.
Disclaimer: Investment carries a risk of loss of initial capital. The past performance is not a reliable indicator of future results. Be sure to understand risks before making an investment decision.
Go Further
I encourage you to read the complete analyses of Ambarella, Inc. and CEVA, Inc. to enhance your investment decisions: