Broadcom Inc. and Ambarella, Inc. are two prominent players in the semiconductor industry, each carving a unique niche with innovative technology solutions. Broadcom leads with a broad portfolio spanning wired and wireless infrastructure, while Ambarella specializes in advanced video processing chips. Their overlapping market segments and innovation strategies make them compelling candidates for comparison. In this article, I will help you determine which company offers the most attractive investment opportunity.

Table of contents
Companies Overview
I will begin the comparison between Broadcom Inc. and Ambarella, Inc. by providing an overview of these two companies and their main differences.
Broadcom Inc. Overview
Broadcom Inc. is a global technology firm specializing in semiconductor and infrastructure software solutions. Headquartered in San Jose, California, it operates through four segments: Wired Infrastructure, Wireless Communications, Enterprise Storage, and Industrial & Other. The company serves diverse markets, including data centers, telecommunications, smartphones, and factory automation, employing about 37,000 people.
Ambarella, Inc. Overview
Ambarella, Inc. develops semiconductor solutions focused on video processing, including HD and ultra HD compression and AI computer vision. Based in Santa Clara, California, it targets markets such as automotive cameras, security systems, robotics, and consumer electronics. The company has a workforce of approximately 941 employees and sells mainly to original design and equipment manufacturers.
Key similarities and differences
Both companies operate in the semiconductor industry and develop advanced technology solutions. Broadcom’s business model is broader, covering multiple infrastructure segments, while Ambarella specializes in video processing chips with AI capabilities. Broadcom’s scale and workforce vastly exceed Ambarella’s, reflecting their differing market reach and product diversity.
Income Statement Comparison
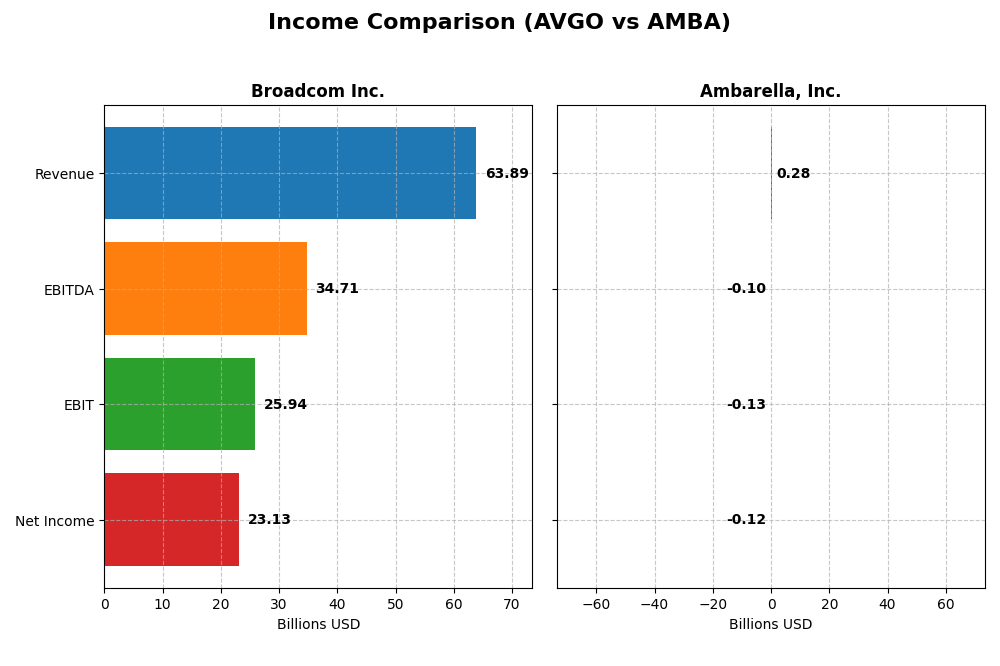
This table presents a side-by-side comparison of the most recent fiscal year income statement figures for Broadcom Inc. and Ambarella, Inc., highlighting key financial metrics.
| Metric | Broadcom Inc. (AVGO) | Ambarella, Inc. (AMBA) |
|---|---|---|
| Market Cap | 1.6T | 2.7B |
| Revenue | 63.9B | 285M |
| EBITDA | 34.7B | -101M |
| EBIT | 25.9B | -127M |
| Net Income | 23.1B | -117M |
| EPS | 4.91 | -2.84 |
| Fiscal Year | 2025 | 2025 |
Income Statement Interpretations
Broadcom Inc.
Broadcom’s revenue and net income have shown strong growth from 2021 to 2025, with revenue increasing from $27.45B to $63.89B and net income rising from $6.44B to $23.13B. Margins have generally improved, with a gross margin of 67.77% and net margin of 36.2% in 2025. The latest year saw a 23.87% revenue growth and a significant margin expansion, reflecting enhanced profitability.
Ambarella, Inc.
Ambarella’s revenue grew steadily from $223M in 2021 to $285M in 2025, but net income remained negative, with a loss of $117M in 2025 despite some improvement from prior years. The gross margin is favorable at 60.5%, yet EBIT and net margins remain negative at -44.44% and -41.12%, respectively. The recent year showed 25.78% revenue growth but continued net losses, indicating ongoing profitability challenges.
Which one has the stronger fundamentals?
Broadcom exhibits stronger fundamentals with substantial revenue and net income growth, favorable and expanding margins, and consistent profitability enhancements. Ambarella shows revenue growth but persistent net losses and unfavorable profitability margins, limiting its fundamental strength. Broadcom’s overall financial health and margin improvements provide a more robust income statement profile compared to Ambarella.
Financial Ratios Comparison
The table below presents a side-by-side comparison of key financial ratios for Broadcom Inc. and Ambarella, Inc. based on their most recent fiscal year data.
| Ratios | Broadcom Inc. (2025) | Ambarella, Inc. (2025) |
|---|---|---|
| ROE | 28.4% | -20.9% |
| ROIC | 16.4% | -21.9% |
| P/E | 73.9 | -27.1 |
| P/B | 21.0 | 5.64 |
| Current Ratio | 1.71 | 2.65 |
| Quick Ratio | 1.58 | 2.36 |
| D/E | 0.80 | 0.009 |
| Debt-to-Assets | 38.1% | 0.76% |
| Interest Coverage | 7.94 | 0 |
| Asset Turnover | 0.37 | 0.41 |
| Fixed Asset Turnover | 25.3 | 20.0 |
| Payout Ratio | 48.2% | 0% |
| Dividend Yield | 0.65% | 0% |
Interpretation of the Ratios
Broadcom Inc.
Broadcom exhibits generally strong financial ratios with favorable net margin (36.2%), ROE (28.45%), and ROIC (16.36%), indicating solid profitability and capital efficiency. However, high valuation multiples such as a PE of 73.87 and PB of 21.01 raise concerns about price levels. The company pays dividends with a low yield of 0.65%, suggesting modest shareholder returns despite consistent payouts.
Ambarella, Inc.
Ambarella shows weak financial ratios with negative net margin (-41.12%), ROE (-20.86%), and ROIC (-21.96%), reflecting poor profitability and capital returns. Although the balance sheet is strong with low debt levels and favorable liquidity ratios, the absence of dividends aligns with ongoing losses and a focus on reinvestment. The high R&D expense supports a growth strategy amid operational challenges.
Which one has the best ratios?
Broadcom clearly has the best ratio profile, demonstrating consistent profitability, capital efficiency, and dividend payments. Ambarella faces significant profitability deficits and negative returns, despite sound liquidity and low leverage. Overall, Broadcom’s ratios are slightly favorable compared to Ambarella’s unfavorable metrics.
Strategic Positioning
This section compares the strategic positioning of Broadcom Inc. and Ambarella, Inc., covering market position, key segments, and exposure to technological disruption:
Broadcom Inc.
- Large market cap of 1.6T USD with diversified competitive pressures across multiple technology segments.
- Operates in four segments: Infrastructure Software and Semiconductor Solutions are primary revenue drivers.
- Exposure involves semiconductor and software integration with firmware for analog-digital interfacing.
Ambarella, Inc.
- Smaller market cap of 2.7B USD facing high competitive pressure in semiconductor video solutions.
- Focused on semiconductor solutions for video processing, AI vision, and automotive cameras.
- Faces disruption risks from advancements in AI and video processing technologies in specialized niches.
Broadcom Inc. vs Ambarella, Inc. Positioning
Broadcom’s diversified segments across infrastructure and semiconductors provide broad market exposure, while Ambarella concentrates on video and AI-driven semiconductor solutions. Broadcom’s scale offers stability; Ambarella’s narrow focus entails higher specialization but greater vulnerability.
Which has the best competitive advantage?
Broadcom demonstrates a very favorable economic moat with growing ROIC and value creation, indicating durable competitive advantage. Ambarella shows a very unfavorable moat with declining ROIC, reflecting value destruction and weaker competitive positioning.
Stock Comparison
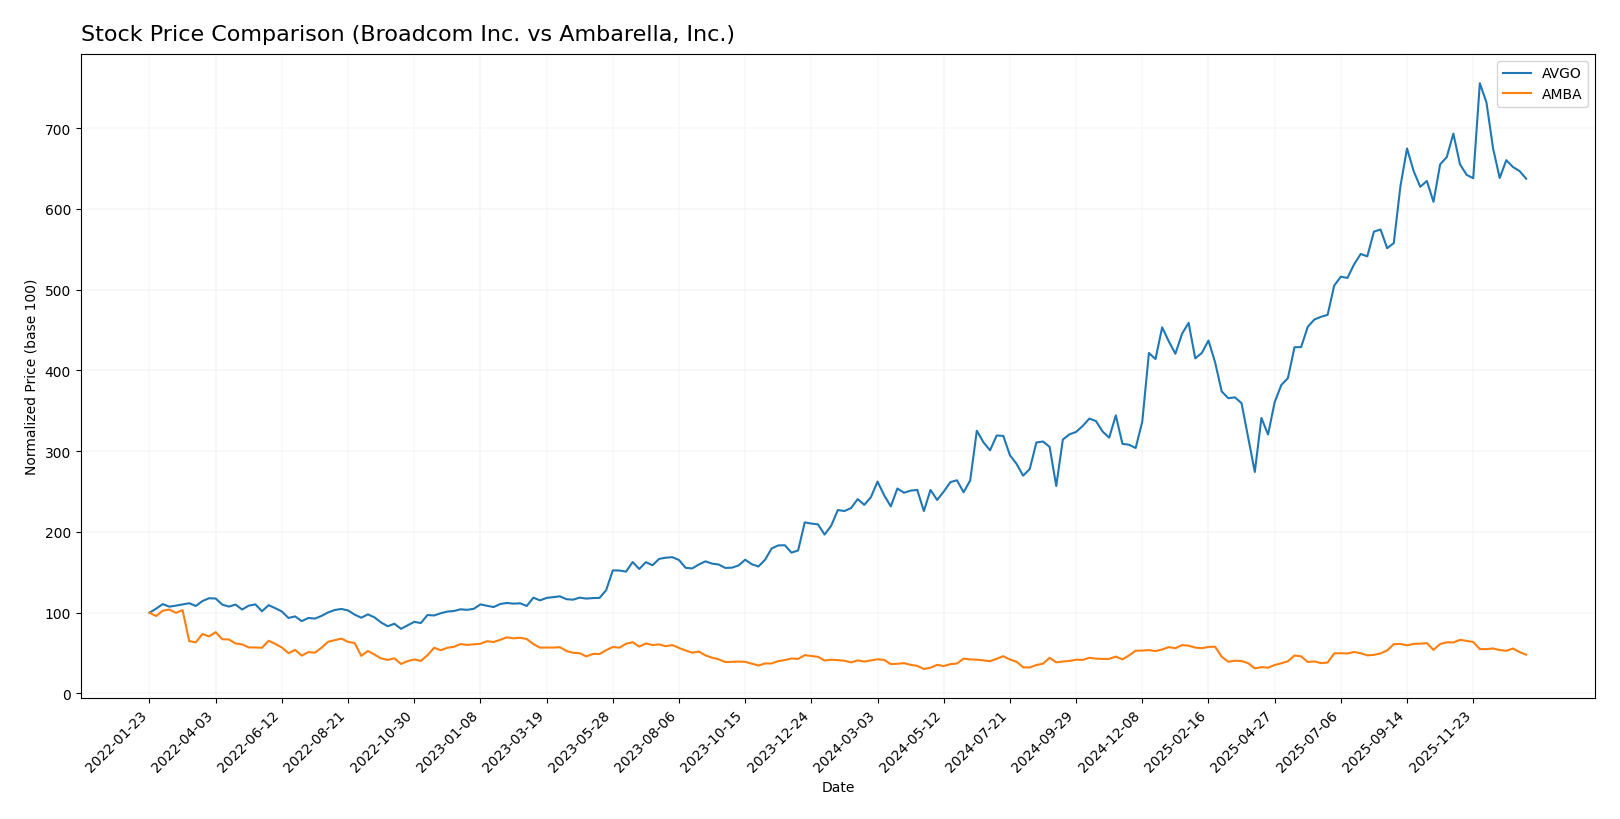
The stock price dynamics over the past 12 months reveal significant bullish trends for both Broadcom Inc. and Ambarella, Inc., with notable deceleration and recent downward pressure in price movements.
Trend Analysis
Broadcom Inc. (AVGO) showed a strong bullish trend over the past year with a 162.18% price increase, though the trend experienced deceleration. The stock reached a high of 402.96 and a low of 120.47, with high volatility reflected in a standard deviation of 78.56.
Ambarella, Inc. (AMBA) also posted a bullish trend with a 17.26% price rise over the same period, but the upward momentum slowed. Its price fluctuated between 40.99 and 89.67, and the volatility was lower at a standard deviation of 12.81.
Comparing both stocks, Broadcom delivered the highest market performance with a significantly larger percentage gain and higher price volatility than Ambarella during the past year.
Target Prices
The current analyst consensus reflects moderate upside potential for these semiconductor companies.
| Company | Target High | Target Low | Consensus |
|---|---|---|---|
| Broadcom Inc. | 510 | 370 | 454.8 |
| Ambarella, Inc. | 115 | 80 | 97.5 |
Analysts expect Broadcom’s stock to rise significantly from its current price of $339.89, while Ambarella’s consensus target suggests a near 50% potential increase from $64.80.
Analyst Opinions Comparison
This section compares analysts’ ratings and grades for Broadcom Inc. and Ambarella, Inc.:
Rating Comparison
Broadcom Inc. Rating
- Rating: B, classified as Very Favorable overall.
- Discounted Cash Flow Score: 3, assessed as Moderate valuation accuracy.
- ROE Score: 5, indicating very favorable efficiency in generating profit from equity.
- ROA Score: 5, showing very favorable asset utilization for earnings.
- Debt To Equity Score: 1, considered very unfavorable due to higher financial risk.
- Overall Score: 3, reflecting a moderate overall financial standing.
Ambarella, Inc. Rating
- Rating: C+, also classified as Very Favorable overall.
- Discounted Cash Flow Score: 3, similarly Moderate valuation accuracy.
- ROE Score: 1, indicating very unfavorable efficiency in generating profit from equity.
- ROA Score: 1, showing very unfavorable asset utilization for earnings.
- Debt To Equity Score: 4, considered favorable with lower financial risk.
- Overall Score: 2, reflecting a moderate but lower overall financial standing.
Which one is the best rated?
Broadcom holds a higher overall rating (B vs. C+) and scores better on ROE and ROA, indicating stronger profitability and asset use. Ambarella scores better on debt management but has a lower overall score.
Scores Comparison
Here is a comparison of the Altman Z-Score and Piotroski Score for Broadcom Inc. and Ambarella, Inc.:
Broadcom Inc. Scores
- Altman Z-Score: 12.13, indicating a safe zone with very low bankruptcy risk.
- Piotroski Score: 8, classified as very strong financial health.
Ambarella, Inc. Scores
- Altman Z-Score: 10.69, also in the safe zone with low bankruptcy risk.
- Piotroski Score: 3, categorized as very weak financial health.
Which company has the best scores?
Broadcom Inc. shows a higher Piotroski Score indicating stronger financial health, while both companies have Altman Z-Scores in the safe zone. Based strictly on these scores, Broadcom Inc. has a more favorable overall score profile.
Grades Comparison
Here is a detailed comparison of the grades assigned to Broadcom Inc. and Ambarella, Inc.:
Broadcom Inc. Grades
The table below shows recent reliable grades from well-known financial institutions for Broadcom Inc.:
| Grading Company | Action | New Grade | Date |
|---|---|---|---|
| Mizuho | Maintain | Outperform | 2026-01-09 |
| Truist Securities | Maintain | Buy | 2025-12-19 |
| UBS | Maintain | Buy | 2025-12-15 |
| Benchmark | Maintain | Buy | 2025-12-12 |
| Rosenblatt | Maintain | Buy | 2025-12-12 |
| Piper Sandler | Maintain | Overweight | 2025-12-12 |
| TD Cowen | Maintain | Buy | 2025-12-12 |
| B of A Securities | Maintain | Buy | 2025-12-12 |
| JP Morgan | Maintain | Overweight | 2025-12-12 |
| Mizuho | Maintain | Outperform | 2025-12-12 |
The grades for Broadcom Inc. consistently show a strong buy and outperform consensus with no downgrades.
Ambarella, Inc. Grades
Below is a summary of recent reliable grades for Ambarella, Inc. from established grading firms:
| Grading Company | Action | New Grade | Date |
|---|---|---|---|
| B of A Securities | Maintain | Neutral | 2025-11-26 |
| Needham | Maintain | Buy | 2025-11-26 |
| Stifel | Maintain | Buy | 2025-11-26 |
| Rosenblatt | Maintain | Buy | 2025-11-26 |
| Rosenblatt | Maintain | Buy | 2025-11-24 |
| Stifel | Maintain | Buy | 2025-08-29 |
| Needham | Maintain | Buy | 2025-08-29 |
| Northland Capital Markets | Maintain | Outperform | 2025-08-29 |
| Morgan Stanley | Maintain | Overweight | 2025-08-29 |
| Oppenheimer | Maintain | Perform | 2025-08-29 |
Ambarella’s grades are mostly positive, with a mix of buy, outperform, and overweight ratings, alongside a few neutral and perform grades.
Which company has the best grades?
Broadcom Inc. has received more unanimous buy and outperform ratings compared to Ambarella, Inc., whose grades include some neutral and hold positions. This suggests Broadcom is viewed more favorably, which may affect investor confidence and portfolio decisions.
Strengths and Weaknesses
Below is a comparison of key strengths and weaknesses of Broadcom Inc. (AVGO) and Ambarella, Inc. (AMBA) based on their recent financial and operational data:
| Criterion | Broadcom Inc. (AVGO) | Ambarella, Inc. (AMBA) |
|---|---|---|
| Diversification | Strong diversification with two main segments: Infrastructure Software ($27B) and Semiconductor Solutions ($36.9B) in 2025 | Limited diversification, primarily focused on specialized semiconductor markets |
| Profitability | High profitability: net margin 36.2%, ROIC 16.36%, and ROE 28.45% (2025) | Negative profitability: net margin -41.12%, ROIC -21.96%, and ROE -20.86% (2025) |
| Innovation | Demonstrates durable competitive advantage with growing ROIC (+34.4% over 2021-2025) | Declining ROIC (-81.3%) and value destruction indicate challenges in sustaining innovation |
| Global presence | Large global footprint supported by extensive product portfolio and strong market presence | More niche market presence with limited scale and global reach |
| Market Share | Significant market share in semiconductor solutions and software infrastructure | Smaller market share, struggling with profitability and growth |
Key takeaways: Broadcom exhibits strong diversification, profitability, and a durable competitive moat, making it a more stable and value-creating investment. Ambarella faces significant challenges with declining profitability and value destruction, suggesting higher risk and caution for investors.
Risk Analysis
Below is a comparative table of key risks facing Broadcom Inc. (AVGO) and Ambarella, Inc. (AMBA) based on their most recent financial and operational data for 2025.
| Metric | Broadcom Inc. (AVGO) | Ambarella, Inc. (AMBA) |
|---|---|---|
| Market Risk | Moderate (Beta 1.22) | High (Beta 1.95) |
| Debt level | Moderate (Debt/Equity 0.8) | Very Low (Debt/Equity 0.01) |
| Regulatory Risk | Moderate (Global tech sector) | Moderate (Automotive & AI sector) |
| Operational Risk | Low (Strong ROE 28.45%) | High (Negative ROE -20.86%) |
| Environmental Risk | Moderate (Industry standard) | Moderate (Industry standard) |
| Geopolitical Risk | Moderate (Global supply chains) | Moderate (Global supply chains) |
Broadcom shows moderate market and debt risks but benefits from strong profitability and financial stability, indicating resilience despite valuation concerns. Ambarella faces higher market volatility and operational risk due to sustained losses and weaker financial health, despite low leverage. Investors should weigh Ambarella’s growth potential against its financial challenges and Broadcom’s stability against its high valuation.
Which Stock to Choose?
Broadcom Inc. (AVGO) shows strong income growth with revenue up 23.87% and net margin at 36.2%, supported by favorable profitability ratios including ROE of 28.45% and ROIC of 16.36%. Its debt profile is moderate with a net debt to EBITDA of 1.41 and a solid current ratio of 1.71. The company holds a very favorable B rating reflecting robust financial health, despite some valuation concerns.
Ambarella, Inc. (AMBA) experiences mixed income trends, with revenue growth of 25.78% but a negative net margin of -41.12% and declining profitability ratios including a ROE of -20.86% and ROIC below WACC. It maintains a strong liquidity position with a current ratio of 2.65 and low debt levels. The firm carries a very favorable C+ rating, although financial performance and value creation remain unfavorable.
Investors with a tolerance for risk and interest in growth potential might find Broadcom’s consistent value creation and robust income statement more appealing. Conversely, those prioritizing liquidity and lower leverage could see Ambarella’s financial stability as a mitigating factor despite its weak profitability. Overall, Broadcom’s stronger rating and durable competitive advantage could indicate greater financial resilience.
Disclaimer: Investment carries a risk of loss of initial capital. The past performance is not a reliable indicator of future results. Be sure to understand risks before making an investment decision.
Go Further
I encourage you to read the complete analyses of Broadcom Inc. and Ambarella, Inc. to enhance your investment decisions: