Astera Labs, Inc. (ALAB) and Ambarella, Inc. (AMBA) are two innovative players in the semiconductor industry, both headquartered in Santa Clara and focusing on cutting-edge technology solutions. While Astera Labs specializes in connectivity solutions for cloud and AI infrastructure, Ambarella excels in video processing and AI-driven vision systems. This article will compare their market positions and innovation strategies to help you identify the more compelling investment opportunity.

Table of contents
Companies Overview
I will begin the comparison between Astera Labs, Inc. Common Stock and Ambarella, Inc. by providing an overview of these two companies and their main differences.
Astera Labs Overview
Astera Labs designs, manufactures, and sells semiconductor-based connectivity solutions tailored for cloud and AI infrastructure. Its Intelligent Connectivity Platform includes data, network, and memory connectivity products built on a software-defined architecture. Founded in 2017, Astera Labs is positioned to support high-performance cloud and AI infrastructure deployment at scale, with a market cap of 29.5B USD and headquartered in Santa Clara, California.
Ambarella Overview
Ambarella develops semiconductor solutions focused on high-definition and ultra HD video compression, image processing, and AI computer vision processing. Its system-on-a-chip designs serve automotive cameras, robotics, security cameras, and consumer video applications. Established in 2004, Ambarella is headquartered in Santa Clara, California, employs 941 people, and has a market cap of 2.7B USD, with a strong presence in video and AI technology sectors.
Key similarities and differences
Both companies operate in the semiconductor industry and are based in Santa Clara, focusing on advanced technology integration. Astera Labs specializes in connectivity solutions for cloud and AI infrastructure, while Ambarella concentrates on video processing and AI-driven camera applications. Astera Labs is younger with a significantly larger market capitalization, whereas Ambarella has a longer history and a broader product application in video and imaging markets.
Income Statement Comparison
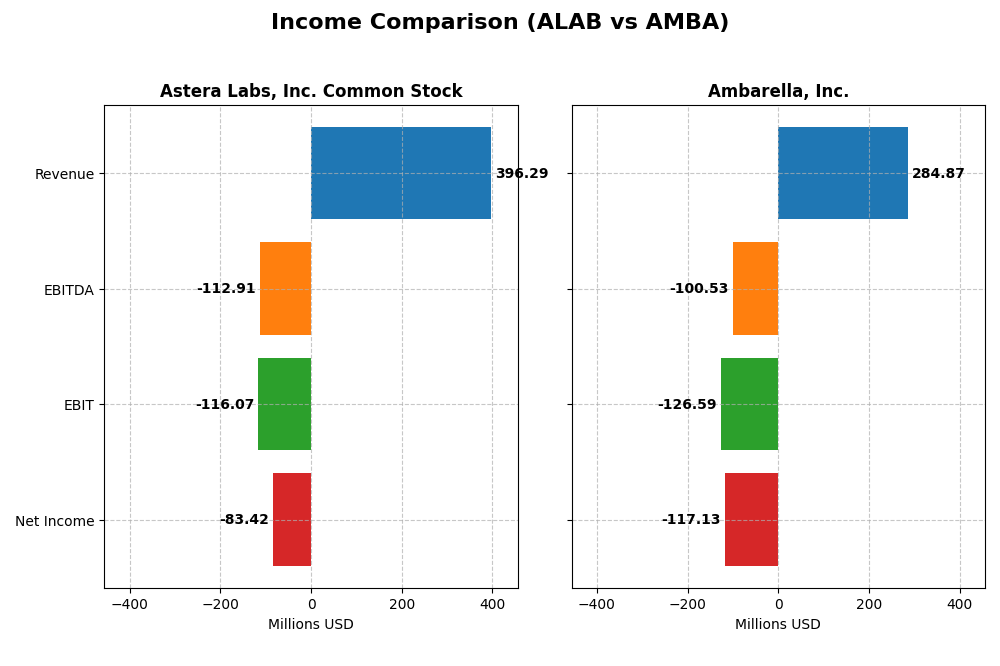
The table below compares the most recent fiscal year income statement metrics for Astera Labs, Inc. and Ambarella, Inc., providing a snapshot of their financial performance.
| Metric | Astera Labs, Inc. Common Stock | Ambarella, Inc. |
|---|---|---|
| Market Cap | 29.5B | 2.7B |
| Revenue | 396M | 285M |
| EBITDA | -113M | -101M |
| EBIT | -116M | -127M |
| Net Income | -83M | -117M |
| EPS | -0.64 | -2.84 |
| Fiscal Year | 2024 | 2025 |
Income Statement Interpretations
Astera Labs, Inc. Common Stock
Astera Labs demonstrated strong revenue growth from $79.9M in 2022 to $396.3M in 2024, a 396% increase overall. Despite this, net income remained negative, with a loss of $83.4M in 2024. The gross margin stayed favorable at 76.38%, but EBIT and net margins were negative, reflecting ongoing operating challenges. Recent growth slowed but margins slightly improved.
Ambarella, Inc.
Ambarella’s revenue rose from $223M in 2021 to $285M in 2025, a more modest 27.75% increase. Net losses deepened to $117.1M in 2025, although the company showed improvements in EBIT and net margin growth over the past year. Gross margin held steady at 60.5%, but negative EBIT and net margins indicate persistent profitability concerns.
Which one has the stronger fundamentals?
Astera Labs exhibits exceptional top-line growth and a very strong gross margin, yet struggles with large negative EBIT and net margins. Ambarella shows more moderate revenue growth but better recent margin improvements and a favorable overall income statement evaluation. While both face profitability challenges, Ambarella’s improving margins and more balanced income statement suggest relatively stronger fundamentals.
Financial Ratios Comparison
Below is a comparison of key financial ratios for Astera Labs, Inc. (ALAB) and Ambarella, Inc. (AMBA) based on their most recent fiscal year data.
| Ratios | Astera Labs, Inc. (2024) | Ambarella, Inc. (2025) |
|---|---|---|
| ROE | -8.65% | -20.86% |
| ROIC | -11.97% | -21.96% |
| P/E | -208.41 | -27.05 |
| P/B | 18.02 | 5.64 |
| Current Ratio | 11.71 | 2.65 |
| Quick Ratio | 11.21 | 2.36 |
| D/E (Debt-to-Equity) | 0.0013 | 0.0094 |
| Debt-to-Assets | 0.0012 | 0.0076 |
| Interest Coverage | 0 | 0 |
| Asset Turnover | 0.38 | 0.41 |
| Fixed Asset Turnover | 11.12 | 19.96 |
| Payout Ratio | 0 | 0 |
| Dividend Yield | 0 | 0 |
Interpretation of the Ratios
Astera Labs, Inc. Common Stock
Astera Labs shows a majority of unfavorable financial ratios, including negative net margin (-21.05%), return on equity (-8.65%), and return on invested capital (-11.97%). Its current ratio is high at 11.71 but considered unfavorable, while the quick ratio is favorable at 11.21. The company does not pay dividends, indicating a possible reinvestment strategy or growth phase.
Ambarella, Inc.
Ambarella reports several unfavorable ratios such as net margin (-41.12%), return on equity (-20.86%), and return on invested capital (-21.96%). It maintains a favorable current ratio of 2.65 and quick ratio of 2.36, reflecting adequate liquidity. Like Astera Labs, Ambarella does not pay dividends, potentially due to ongoing reinvestment or strategic priorities.
Which one has the best ratios?
Ambarella exhibits a slightly higher proportion of favorable ratios (42.86%) compared to Astera Labs (35.71%), with better liquidity metrics and fixed asset turnover. However, both companies present significant challenges, especially in profitability and coverage ratios, resulting in an overall unfavorable evaluation for each.
Strategic Positioning
This section compares the strategic positioning of Astera Labs and Ambarella, including market position, key segments, and exposure to technological disruption:
Astera Labs
- Market position and competitive pressure
- Key segments and business drivers
- Exposure to technological disruption
Ambarella
- Larger market cap of 29.5B USD, operating in cloud and AI connectivity segments
- Focuses on semiconductor connectivity for cloud and AI infrastructure
- Software-defined architecture enables flexible, scalable infrastructure deployment
Astera Labs vs Ambarella Positioning
Astera Labs pursues a concentrated strategy focused on cloud and AI infrastructure connectivity, benefiting from high scalability. Ambarella targets a diversified portfolio across video processing and automotive sectors, exposing it to broader but varied market demands and innovation cycles.
Which has the best competitive advantage?
Both companies are currently shedding value, but Astera Labs shows a slightly unfavorable MOAT with improving ROIC, while Ambarella faces a very unfavorable MOAT with declining profitability, indicating Astera Labs holds a marginally stronger competitive advantage.
Stock Comparison
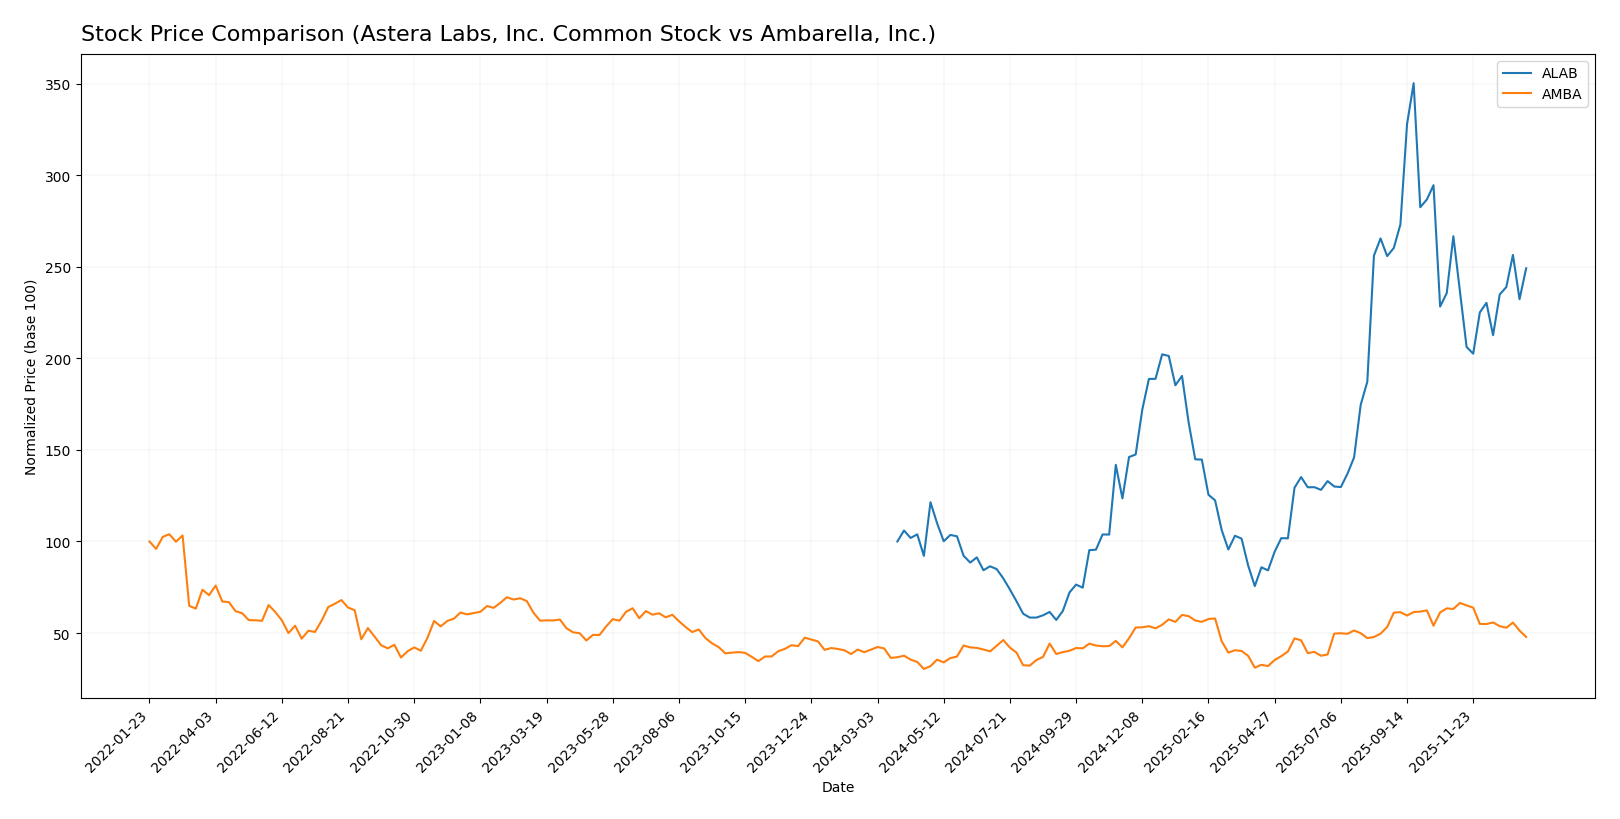
The stock price movements of Astera Labs, Inc. (ALAB) and Ambarella, Inc. (AMBA) over the past 12 months reveal distinct bullish trends with decelerating momentum, accompanied by notable price volatility and shifting buyer-seller dynamics.
Trend Analysis
Astera Labs, Inc. (ALAB) has experienced a strong bullish trend over the past year with a 149.21% price increase, though this momentum is decelerating. The stock showed a high volatility level with a 50.14 standard deviation, reaching a peak at 245.2 and a low of 40.0.
Ambarella, Inc. (AMBA) posted a more moderate bullish trend with a 16.9% price rise over the last 12 months, also showing deceleration. Price volatility was lower than ALAB’s, with a standard deviation of 12.81, and prices ranged between 40.99 and 89.67.
Comparing both, ALAB delivered the highest market performance with a significantly larger percentage gain and greater price amplitude than AMBA over the analyzed period.
Target Prices
The current analyst consensus presents optimistic target prices for both Astera Labs, Inc. and Ambarella, Inc.
| Company | Target High | Target Low | Consensus |
|---|---|---|---|
| Astera Labs, Inc. Common Stock | 225 | 165 | 202.14 |
| Ambarella, Inc. | 115 | 80 | 97.5 |
Astera Labs’ consensus target of 202.14 USD suggests a potential upside from its current price of 174.45 USD. Ambarella’s consensus target of 97.5 USD also indicates significant growth potential above its current price of 64.6 USD.
Analyst Opinions Comparison
This section compares analysts’ ratings and grades for Astera Labs, Inc. Common Stock (ALAB) and Ambarella, Inc. (AMBA):
Rating Comparison
ALAB Rating
- Rating: B, considered Very Favorable.
- Discounted Cash Flow Score: 1, classified as Very Unfavorable, indicating potential overvaluation.
- ROE Score: 4, Favorable, showing efficient profit generation from shareholders’ equity.
- ROA Score: 5, Very Favorable, reflecting excellent asset utilization to generate earnings.
- Debt To Equity Score: 4, Favorable, implying manageable financial risk from leverage.
- Overall Score: 3, Moderate, providing a balanced financial standing summary.
AMBA Rating
- Rating: C+, also considered Very Favorable.
- Discounted Cash Flow Score: 3, Moderate, suggesting a fair valuation on projected cash flows.
- ROE Score: 1, Very Unfavorable, indicating weak profit generation efficiency.
- ROA Score: 1, Very Unfavorable, showing poor asset utilization.
- Debt To Equity Score: 4, Favorable, similarly indicating sound financial stability.
- Overall Score: 2, Moderate, indicating a somewhat lower overall financial rating.
Which one is the best rated?
Based on the provided data, ALAB holds a higher overall rating and stronger scores in ROE and ROA, indicating better profitability and asset use. AMBA shows a higher discounted cash flow score but lower returns, making ALAB the better-rated company overall.
Scores Comparison
The scores comparison between Astera Labs (ALAB) and Ambarella (AMBA) is as follows:
ALAB Scores
- Altman Z-Score: 137, indicating a very strong safe zone status.
- Piotroski Score: 6, representing an average financial strength.
AMBA Scores
- Altman Z-Score: 10.7, indicating a safe zone status.
- Piotroski Score: 3, indicating very weak financial strength.
Which company has the best scores?
Based on the provided data, ALAB has a significantly higher Altman Z-Score and a better Piotroski Score than AMBA. This suggests ALAB currently demonstrates stronger financial stability and average financial health compared to AMBA’s very weak Piotroski rating.
Grades Comparison
Here is a comparison of the recent grades assigned by reputable grading companies for the two companies:
Astera Labs, Inc. Common Stock Grades
This table summarizes recent grades and actions from established grading firms for Astera Labs, Inc. Common Stock.
| Grading Company | Action | New Grade | Date |
|---|---|---|---|
| Northland Capital Markets | Maintain | Outperform | 2025-12-09 |
| Northland Capital Markets | Upgrade | Outperform | 2025-11-17 |
| Stifel | Maintain | Buy | 2025-11-05 |
| Morgan Stanley | Maintain | Overweight | 2025-11-05 |
| Roth Capital | Maintain | Buy | 2025-11-05 |
| Needham | Maintain | Buy | 2025-11-05 |
| JP Morgan | Maintain | Overweight | 2025-11-05 |
| TD Cowen | Maintain | Hold | 2025-11-05 |
| Barclays | Downgrade | Equal Weight | 2025-10-20 |
| Stifel | Maintain | Buy | 2025-10-17 |
Astera Labs has predominantly maintained buy or outperform ratings, with a single downgrade to equal weight, indicating generally positive analyst sentiment.
Ambarella, Inc. Grades
This table summarizes recent grades and actions from established grading firms for Ambarella, Inc.
| Grading Company | Action | New Grade | Date |
|---|---|---|---|
| B of A Securities | Maintain | Neutral | 2025-11-26 |
| Needham | Maintain | Buy | 2025-11-26 |
| Stifel | Maintain | Buy | 2025-11-26 |
| Rosenblatt | Maintain | Buy | 2025-11-26 |
| Rosenblatt | Maintain | Buy | 2025-11-24 |
| Stifel | Maintain | Buy | 2025-08-29 |
| Needham | Maintain | Buy | 2025-08-29 |
| Northland Capital Markets | Maintain | Outperform | 2025-08-29 |
| Morgan Stanley | Maintain | Overweight | 2025-08-29 |
| Oppenheimer | Maintain | Perform | 2025-08-29 |
Ambarella shows a majority of buy ratings with some neutral and perform grades, reflecting moderately positive analyst views.
Which company has the best grades?
Both companies have a consensus “Buy” rating, but Astera Labs exhibits a higher concentration of outperform and buy ratings with fewer hold recommendations. This suggests slightly stronger analyst confidence in Astera Labs, potentially influencing investors toward a more optimistic outlook on its near-term prospects.
Strengths and Weaknesses
The table below summarizes the key strengths and weaknesses of Astera Labs, Inc. (ALAB) and Ambarella, Inc. (AMBA) based on recent financial and strategic data.
| Criterion | Astera Labs, Inc. (ALAB) | Ambarella, Inc. (AMBA) |
|---|---|---|
| Diversification | Moderate, mainly in product and tech services with $393M in products and $3.2M in tech services | Limited disclosed diversification, primarily product-focused |
| Profitability | Negative margins (-21%), ROIC -12%, shedding value but with improving ROIC trend | Negative margins (-41%), ROIC -22%, shedding value with declining ROIC |
| Innovation | Strong asset turnover (11.12), indicating efficient use of fixed assets | Very strong fixed asset turnover (19.96), but declining profitability raises concerns |
| Global presence | Not explicitly detailed; moderate liquidity with strong quick ratio (11.21) | Moderate global presence; decent liquidity ratios (current 2.65, quick 2.36) |
| Market Share | No explicit data but struggling financially with high P/B (18) | Market share unclear; high P/B (5.64) but unfavorable earnings |
In summary, both companies currently face financial challenges with negative profitability and value destruction. Astera Labs shows a promising improvement in ROIC, suggesting potential recovery, while Ambarella’s declining profitability and ROIC trend indicate higher risk. Investors should be cautious and monitor future performance closely before committing capital.
Risk Analysis
Below is a comparative table of key risks for Astera Labs, Inc. (ALAB) and Ambarella, Inc. (AMBA) based on the most recent data from 2025–2026:
| Metric | Astera Labs, Inc. (ALAB) | Ambarella, Inc. (AMBA) |
|---|---|---|
| Market Risk | Beta 1.51, volatile stock range 47.13–262.9 USD | Beta 1.95, higher volatility, range 38.86–96.69 USD |
| Debt Level | Very low debt (D/E 0.0), debt to assets 0.12% | Low debt (D/E 0.01), debt to assets 0.76% |
| Regulatory Risk | Moderate, semiconductor industry exposure in US | Moderate, semiconductor and AI-related regulations |
| Operational Risk | High, negative margins and ROE, start-up phase | High, larger workforce but negative profitability |
| Environmental Risk | Moderate, typical semiconductor manufacturing impacts | Moderate, semiconductor and hardware production effects |
| Geopolitical Risk | US-based, exposed to trade tensions and supply chain risks | US-based, similarly exposed to geopolitical tensions |
In synthesis, both companies face significant operational risks due to ongoing unprofitability and negative returns on equity, with Ambarella showing higher market volatility and slightly greater debt exposure. Astera Labs benefits from almost no debt but has a very high stock price range, indicating market uncertainty. Geopolitical and regulatory risks remain relevant but manageable. Investors should weigh the high operational risks against potential growth in the AI and semiconductor sectors.
Which Stock to Choose?
Astera Labs, Inc. Common Stock (ALAB) shows a strong revenue growth of 242% in one year and a favorable gross margin of 76.38%, but profitability remains negative with a net margin of -21.05%. Financial ratios reveal mostly unfavorable metrics except for low debt levels and a high quick ratio. The company’s rating is very favorable (B), despite a moderate overall score and signs of value destruction with improving ROIC trends.
Ambarella, Inc. (AMBA) has a more moderate revenue growth of 25.78% in one year and a lower gross margin of 60.5%, with a significantly negative net margin of -41.12%. Financial ratios are mixed, featuring a better debt position than ALAB but weaker profitability and asset efficiency. AMBA holds a very favorable rating (C+) but a low overall score, with a declining ROIC indicating ongoing value destruction.
For investors, ALAB might appear more attractive for those seeking growth potential given its strong revenue expansion and improving profitability trends. Conversely, AMBA’s profile may be seen as more suitable for those preferring a company with steadier financial ratios and lower volatility, despite declining returns. The choice could depend on the investor’s risk tolerance and focus on growth versus stability.
Disclaimer: Investment carries a risk of loss of initial capital. The past performance is not a reliable indicator of future results. Be sure to understand risks before making an investment decision.
Go Further
I encourage you to read the complete analyses of Astera Labs, Inc. Common Stock and Ambarella, Inc. to enhance your investment decisions: