In the fast-evolving semiconductor industry, Arm Holdings plc and Ambarella, Inc. stand out as influential players shaping future technology. Arm focuses on designing versatile microprocessors widely used across automotive, computing, and IoT markets, while Ambarella specializes in advanced video processing chips powering cameras and AI vision systems. Their overlapping innovation strategies and market segments make this comparison crucial. Join me as we uncover which company offers the most compelling investment opportunity today.

Table of contents
Companies Overview
I will begin the comparison between Arm Holdings plc and Ambarella, Inc. by providing an overview of these two companies and their main differences.
Arm Holdings plc Overview
Arm Holdings plc architects, develops, and licenses central processing unit products and related technologies. Its portfolio includes microprocessors, systems IPs, graphics processing units, and software, serving semiconductor companies and OEMs. Operating globally, Arm’s products target markets such as automotive, computing infrastructure, consumer technologies, and the Internet of Things. Founded in 1990 and headquartered in Cambridge, UK, Arm is a subsidiary of Kronos II LLC with a market cap of approximately 111B USD.
Ambarella, Inc. Overview
Ambarella, Inc. develops semiconductor solutions focused on video processing, including HD and ultra HD compression, AI computer vision, and image processing. Its system-on-a-chip designs serve automotive cameras, security systems, robotics, and consumer electronics like drones and wearable cameras. Founded in 2004 and based in Santa Clara, California, Ambarella has a market cap near 2.7B USD and sells primarily to OEMs and ODMs through direct and distributor channels.
Key similarities and differences
Both Arm and Ambarella operate in the semiconductor industry and provide technology essential to various electronics and automotive markets. Arm primarily licenses CPU and system IP technologies globally, while Ambarella focuses on integrated video and AI processing chips. Arm’s scale and market reach are significantly larger, reflecting its broad licensing model, whereas Ambarella targets more specialized video and vision applications with a smaller workforce and market cap.
Income Statement Comparison
The table below presents a side-by-side comparison of the most recent fiscal year income statement metrics for Arm Holdings plc American Depositary Shares and Ambarella, Inc.

| Metric | Arm Holdings plc American Depositary Shares | Ambarella, Inc. |
|---|---|---|
| Market Cap | 111B | 2.7B |
| Revenue | 4.01B | 285M |
| EBITDA | 903M | -101M |
| EBIT | 720M | -127M |
| Net Income | 792M | -117M |
| EPS | 0.75 | -2.84 |
| Fiscal Year | 2025 | 2025 |
Income Statement Interpretations
Arm Holdings plc American Depositary Shares
Arm Holdings demonstrated strong revenue growth from $2.03B in 2021 to $4.01B in 2025, nearly doubling over five years. Net income increased from $388M to $792M, with gross margins consistently high near 95%. The 2025 fiscal year showed significant improvement in EBIT and net margins, reflecting enhanced profitability and operational efficiency.
Ambarella, Inc.
Ambarella’s revenue rose from $223M in 2021 to $285M in 2025, exhibiting moderate growth. However, net income remained negative, widening to a loss of $117M in 2025. Despite a stable gross margin around 60%, EBIT and net margins were unfavorable, though there was some margin improvement and reduced losses in the latest year compared to prior periods.
Which one has the stronger fundamentals?
Arm Holdings displays stronger fundamentals with sustained revenue and net income growth, high and stable gross margins, and improving profitability ratios. Ambarella shows positive revenue growth but persistent net losses and unfavorable EBIT margins, indicating ongoing operational challenges despite some recent margin improvements. Overall, Arm’s income statement trends appear more robust and favorable.
Financial Ratios Comparison
The table below compares the most recent financial ratios for Arm Holdings plc (ARM) and Ambarella, Inc. (AMBA), reflecting their fiscal year 2025 data where available.
| Ratios | Arm Holdings plc (ARM) | Ambarella, Inc. (AMBA) |
|---|---|---|
| ROE | 11.58% | -20.86% |
| ROIC | 10.28% | -21.96% |
| P/E | 141.58 | -27.05 |
| P/B | 16.40 | 5.64 |
| Current Ratio | 5.20 | 2.65 |
| Quick Ratio | 5.20 | 2.36 |
| D/E | 0.05 | 0.01 |
| Debt-to-Assets | 3.99% | 0.76% |
| Interest Coverage | 0 | 0 |
| Asset Turnover | 0.45 | 0.41 |
| Fixed Asset Turnover | 5.61 | 19.96 |
| Payout ratio | 0 | 0 |
| Dividend yield | 0 | 0 |
Interpretation of the Ratios
Arm Holdings plc American Depositary Shares
Arm Holdings shows a mixed ratio profile with strong net margin at 19.77% and favorable debt metrics, including a low debt-to-equity of 0.05 and interest coverage rated as infinite, indicating solid financial stability. However, valuation ratios such as PE at 141.58 and PB at 16.4 are unfavorable, suggesting a high market premium. The company does not pay dividends, likely reflecting a focus on reinvestment and growth.
Ambarella, Inc.
Ambarella’s ratios indicate financial stress, with a deeply negative net margin of -41.12% and negative returns on equity and invested capital, signaling operational challenges. While liquidity ratios like the current ratio at 2.65 and debt metrics appear favorable, the interest coverage ratio at zero raises concerns about debt servicing. Ambarella also does not distribute dividends, possibly prioritizing R&D and acquisitions during its growth phase.
Which one has the best ratios?
Arm Holdings presents a slightly unfavorable overall ratio picture but benefits from positive profitability and strong debt management, whereas Ambarella faces an unfavorable outlook with multiple negative profitability ratios and weak interest coverage. Given this, Arm Holdings holds a relatively more stable financial profile compared to Ambarella.
Strategic Positioning
This section compares the strategic positioning of Arm Holdings plc and Ambarella, Inc., including Market position, Key segments, and exposure to technological disruption:
Arm Holdings plc American Depositary Shares
- Market position and competitive pressure
- Key segments and business drivers
- Exposure to technological disruption
Ambarella, Inc.
- Market cap of 111B USD; operates globally with high beta indicating volatility.
- Licenses CPU designs and IP for various markets: automotive, computing, IoT, consumer tech.
- Licenses widely used semiconductor IP, relying on ongoing tech innovation globally.
Arm Holdings plc vs Ambarella, Inc. Positioning
Arm exhibits a diversified model, licensing semiconductor IP across multiple industries worldwide, while Ambarella concentrates on specialized video and AI chip markets. Arm’s scale and broader application offer wider market exposure; Ambarella’s focus targets niche innovation but with narrower scope.
Which has the best competitive advantage?
Both companies currently shed value with ROIC below WACC; Arm shows stable profitability but no value creation, Ambarella faces declining returns and worsening profitability, indicating weaker competitive advantage.
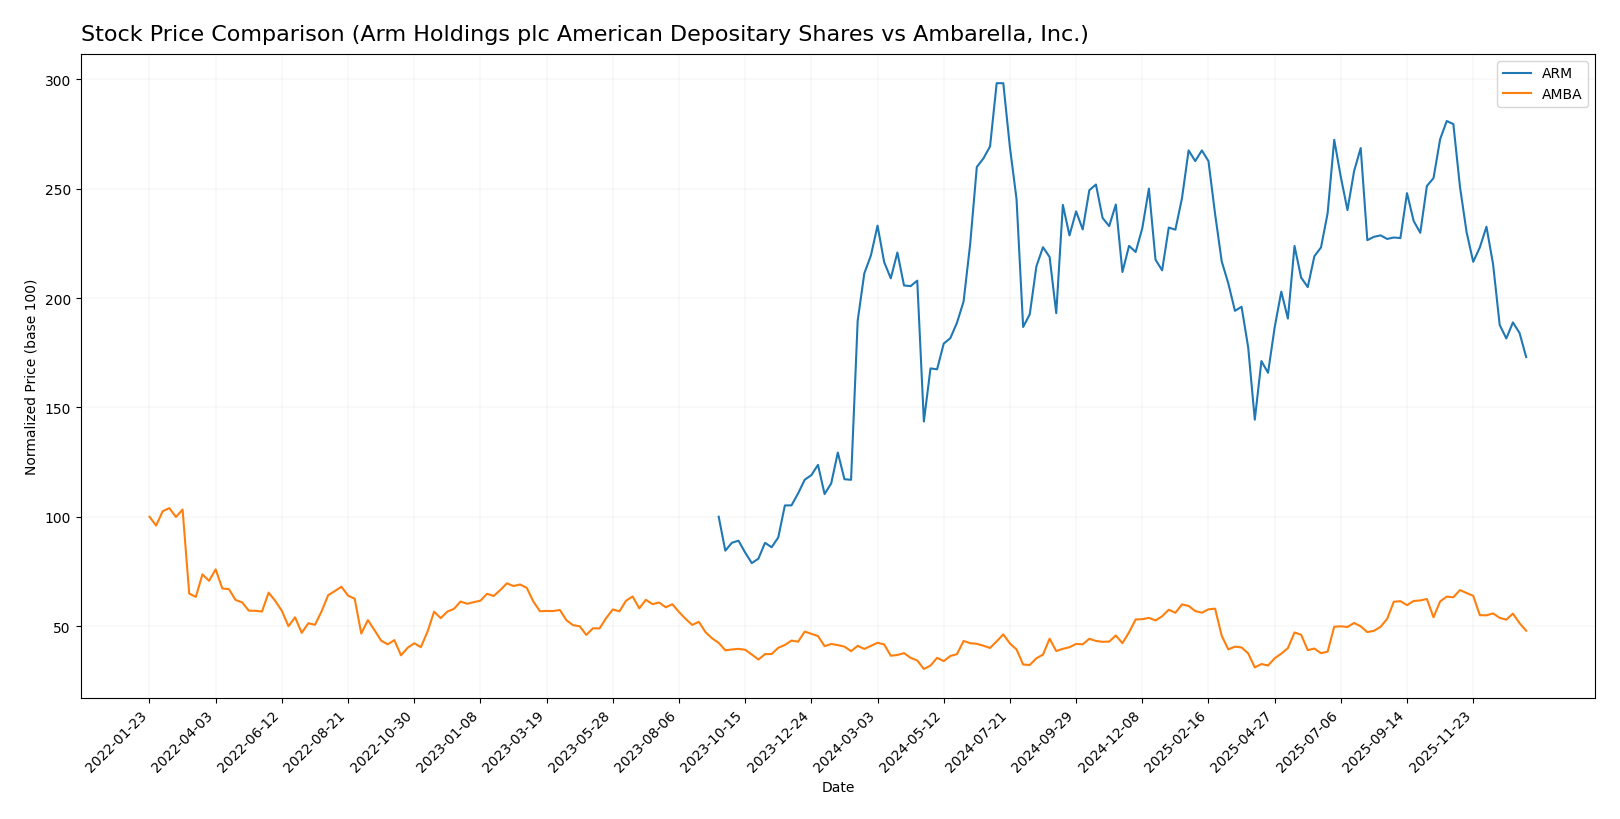
Stock Comparison
The stock price movements over the past 12 months show contrasting trends for Arm Holdings plc American Depositary Shares and Ambarella, Inc., with notable shifts in price levels and trading volumes reflecting differing market dynamics.
Trend Analysis
Arm Holdings plc experienced a bearish trend over the past year with a price decline of 21.17%, showing deceleration and a high volatility level (std deviation 19.31). The stock ranged between a high of 181.19 and a low of 87.19.
Ambarella, Inc. displayed a bullish trend with a 16.9% price increase over the same period, despite deceleration and lower volatility (std deviation 12.81). Its price fluctuated between 89.67 at the high and 40.99 at the low.
Comparing both, Ambarella outperformed Arm Holdings with positive market performance, while Arm’s stock declined significantly, indicating a stronger position for Ambarella in the last 12 months.
Target Prices
The current target price consensus indicates moderate upside potential for both Arm Holdings plc and Ambarella, Inc.
| Company | Target High | Target Low | Consensus |
|---|---|---|---|
| Arm Holdings plc American Depositary Shares | 210 | 120 | 166 |
| Ambarella, Inc. | 115 | 80 | 97.5 |
Analysts expect Arm Holdings to rise significantly from its current price of 105.11 USD, while Ambarella’s target consensus at 97.5 USD suggests a solid potential increase above its current 64.6 USD price.
Analyst Opinions Comparison
This section compares analysts’ ratings and grades for Arm Holdings plc American Depositary Shares (ARM) and Ambarella, Inc. (AMBA):
Rating Comparison
ARM Rating
- Rating: B, considered Very Favorable overall by analysts.
- Discounted Cash Flow Score: 3, reflecting a moderate valuation outlook.
- ROE Score: 3, showing moderate efficiency in generating profit from equity.
- ROA Score: 4, indicating favorable asset utilization efficiency.
- Debt To Equity Score: 4, showing favorable financial stability and low risk.
- Overall Score: 3, a moderate overall financial standing.
AMBA Rating
- Rating: C+, also considered Very Favorable overall by analysts.
- Discounted Cash Flow Score: 3, also indicating a moderate valuation outlook.
- ROE Score: 1, indicating very unfavorable efficiency in generating equity returns.
- ROA Score: 1, indicating very unfavorable asset utilization efficiency.
- Debt To Equity Score: 4, also showing favorable financial stability and low risk.
- Overall Score: 2, reflecting a moderate but lower overall financial standing.
Which one is the best rated?
Based on the data, ARM holds a stronger position with a higher overall score (3 vs. 2) and better returns on equity and assets. Both have favorable debt-to-equity scores, but ARM’s profitability metrics are superior, making it the better-rated company.
Scores Comparison
The comparison of Arm and Ambarella scores highlights their financial health and bankruptcy risk:
Arm Scores
- Altman Z-Score: 32.4, in the safe zone, very low bankruptcy risk.
- Piotroski Score: 7, strong financial health rating.
Ambarella Scores
- Altman Z-Score: 10.7, in the safe zone, low bankruptcy risk.
- Piotroski Score: 3, very weak financial health rating.
Which company has the best scores?
Arm has a significantly higher Altman Z-Score and a much stronger Piotroski Score compared to Ambarella. Based strictly on these scores, Arm demonstrates better financial stability and strength.
Grades Comparison
Here is a comparison of the recent reliable grades assigned to Arm Holdings plc American Depositary Shares and Ambarella, Inc.:
Arm Holdings plc American Depositary Shares Grades
The table below summarizes recent grades from reputable grading companies for Arm Holdings plc:
| Grading Company | Action | New Grade | Date |
|---|---|---|---|
| B of A Securities | Downgrade | Neutral | 2026-01-13 |
| B of A Securities | Maintain | Buy | 2025-12-16 |
| Goldman Sachs | Downgrade | Sell | 2025-12-15 |
| Loop Capital | Maintain | Buy | 2025-11-12 |
| TD Cowen | Maintain | Buy | 2025-11-06 |
| Rosenblatt | Maintain | Buy | 2025-11-06 |
| Wells Fargo | Maintain | Overweight | 2025-11-06 |
| Mizuho | Maintain | Outperform | 2025-11-06 |
| Barclays | Maintain | Overweight | 2025-11-06 |
| UBS | Maintain | Buy | 2025-11-06 |
Arm Holdings plc shows a mixed but mostly positive grading trend with multiple buy and outperform ratings, although recent downgrades from B of A Securities and Goldman Sachs introduce some caution.
Ambarella, Inc. Grades
The following table shows the recent grades from established grading companies for Ambarella, Inc.:
| Grading Company | Action | New Grade | Date |
|---|---|---|---|
| B of A Securities | Maintain | Neutral | 2025-11-26 |
| Needham | Maintain | Buy | 2025-11-26 |
| Stifel | Maintain | Buy | 2025-11-26 |
| Rosenblatt | Maintain | Buy | 2025-11-26 |
| Rosenblatt | Maintain | Buy | 2025-11-24 |
| Stifel | Maintain | Buy | 2025-08-29 |
| Needham | Maintain | Buy | 2025-08-29 |
| Northland Capital Markets | Maintain | Outperform | 2025-08-29 |
| Morgan Stanley | Maintain | Overweight | 2025-08-29 |
| Oppenheimer | Maintain | Perform | 2025-08-29 |
Ambarella, Inc. maintains a consistent positive outlook with many buy and outperform ratings, and no recent downgrades.
Which company has the best grades?
Both Arm Holdings plc and Ambarella, Inc. hold a consensus “Buy” rating, but Ambarella exhibits more stable and uniformly positive grades without recent downgrades. This steadiness may suggest a lower risk perception by analysts compared to Arm, which has recent mixed signals affecting its outlook. Investors might interpret these differences as varying confidence levels from the grading firms.
Strengths and Weaknesses
Below is a comparative overview of Arm Holdings plc (ARM) and Ambarella, Inc. (AMBA) based on their latest financial and strategic metrics.
| Criterion | Arm Holdings plc (ARM) | Ambarella, Inc. (AMBA) |
|---|---|---|
| Diversification | Moderate: Revenue split between licenses (1.84B) and royalties (2.17B) | Limited data; narrower product focus |
| Profitability | Positive net margin (19.8%), but ROIC below WACC, indicating value destruction | Negative net margin (-41.1%), declining profitability |
| Innovation | Strong fixed asset turnover (5.61), indicating efficient asset use | Very high fixed asset turnover (19.96), but declining ROIC suggests innovation struggles |
| Global presence | Established global player with diversified revenue streams | Smaller global footprint, less diversified |
| Market Share | Strong licensing model supports leading position in chip designs | Niche market presence, smaller share |
Key takeaways: ARM maintains a leading market position with solid revenue streams but faces challenges in capital efficiency and value creation. AMBA shows weaker profitability and declining returns, signaling caution for investors despite operational efficiency in asset use. Risk management favors ARM for portfolio inclusion, but both require careful monitoring.
Risk Analysis
The table below summarizes key risks for Arm Holdings plc (ARM) and Ambarella, Inc. (AMBA) based on their latest 2025 financial and market data.
| Metric | Arm Holdings plc (ARM) | Ambarella, Inc. (AMBA) |
|---|---|---|
| Market Risk | High beta (4.36) implies high volatility | Moderate beta (1.95), moderate volatility |
| Debt level | Low debt-to-equity (0.05), low leverage | Very low debt-to-equity (0.01), minimal leverage |
| Regulatory Risk | Exposure to multinational regulations, including US and China | US-based, regulatory risks mainly domestic and tech-specific |
| Operational Risk | Large global operations, supply chain complexity | Smaller scale, focused on semiconductor video tech |
| Environmental Risk | Industry subject to environmental regulations for manufacturing | Similar sector risks but smaller footprint |
| Geopolitical Risk | Operations in China, Taiwan, South Korea; geopolitical tensions possible | Primarily US-based, lower geopolitical exposure |
Risk synthesis: ARM faces significant market risk due to very high beta and geopolitical risks tied to its global footprint, especially in Asia. Its strong balance sheet mitigates debt risk. AMBA has weaker profitability and financial strength, with operational risks linked to its niche market and weaker financial scores. Both firms must navigate semiconductor industry volatility, but ARM’s global exposure makes geopolitical and regulatory risks more impactful.
Which Stock to Choose?
Arm Holdings plc shows strong income growth with a 23.94% revenue increase in 2025 and favorable net margin of 19.77%. Financial ratios are mixed, with solid debt control but some unfavorable valuation metrics. Profitability remains stable, and the rating is very favorable.
Ambarella, Inc. reports positive revenue growth of 25.78% in 2025 but suffers from negative net margin at -41.12%. Financial ratios largely indicate challenges, including unfavorable profitability and interest coverage, despite a very favorable rating status.
For investors prioritizing stable profitability and value creation, Arm’s favorable income statement and moderate rating might appear more suitable. Conversely, those with a higher risk tolerance focusing on potential turnaround scenarios could find Ambarella’s profile worth monitoring, given its revenue growth but weaker profitability metrics.
Disclaimer: Investment carries a risk of loss of initial capital. The past performance is not a reliable indicator of future results. Be sure to understand risks before making an investment decision.
Go Further
I encourage you to read the complete analyses of Arm Holdings plc American Depositary Shares and Ambarella, Inc. to enhance your investment decisions: