In the fast-evolving semiconductor industry, Applied Materials, Inc. (AMAT) and Ambarella, Inc. (AMBA) stand out as innovators driving technological progress. AMAT specializes in manufacturing equipment and software critical for chip fabrication, while AMBA focuses on advanced semiconductor solutions for video processing and AI applications. This comparison highlights their market strategies and growth potential, helping you decide which company better fits your investment portfolio. Let’s explore their prospects together.

Table of contents
Companies Overview
I will begin the comparison between Applied Materials, Inc. and Ambarella, Inc. by providing an overview of these two companies and their main differences.
Applied Materials, Inc. Overview
Applied Materials, Inc. provides manufacturing equipment, services, and software primarily to the semiconductor and display industries. Operating through three segments—Semiconductor Systems, Applied Global Services, and Display and Adjacent Markets—the company supports the fabrication of semiconductor chips and display technologies globally. Founded in 1967 and headquartered in Santa Clara, CA, Applied Materials is a major player with a market cap of approximately 259B USD.
Ambarella, Inc. Overview
Ambarella, Inc. focuses on semiconductor solutions for video processing, including HD and ultra HD compression and AI-driven computer vision. Its products are used in automotive cameras, security cameras, robotics, and consumer electronics. Founded in 2004 and also based in Santa Clara, CA, Ambarella operates with a market cap near 2.8B USD and a smaller workforce compared to Applied Materials.
Key similarities and differences
Both companies operate in the semiconductor industry and are headquartered in Santa Clara, California, serving technology markets globally. Applied Materials mainly provides semiconductor manufacturing equipment and related services, while Ambarella specializes in video-processing semiconductor solutions with AI integration. Their market capitalizations and employee counts differ significantly, reflecting their varied scale and focus within the industry.
Income Statement Comparison
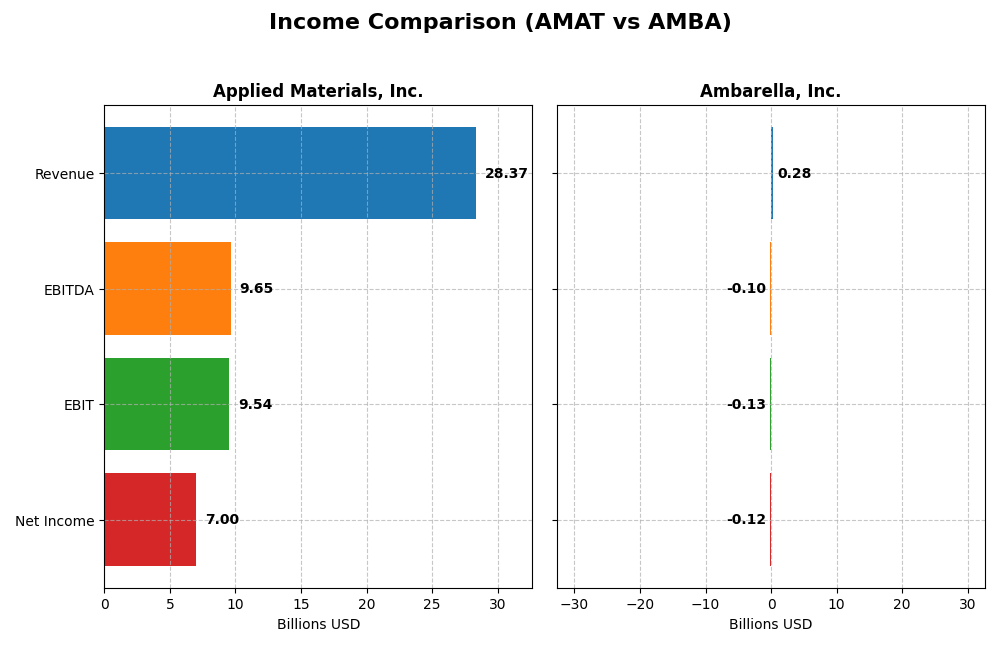
The table below compares the key income statement metrics for Applied Materials, Inc. and Ambarella, Inc. for the most recent fiscal year available.
| Metric | Applied Materials, Inc. (AMAT) | Ambarella, Inc. (AMBA) |
|---|---|---|
| Market Cap | 259B | 2.8B |
| Revenue | 28.4B | 285M |
| EBITDA | 9.65B | -101M |
| EBIT | 9.54B | -127M |
| Net Income | 7.0B | -117M |
| EPS | 8.71 | -2.84 |
| Fiscal Year | 2025 | 2025 |
Income Statement Interpretations
Applied Materials, Inc.
Applied Materials showed steady revenue growth from $23.1B in 2021 to $28.4B in 2025, with net income rising from $5.9B to $7.0B over the same period. Gross and EBIT margins remained favorable, around 48.7% and 33.6% respectively. In 2025, revenue growth slowed to 4.4%, while EBIT grew 13.6%, but net margin declined slightly, reflecting mixed operational efficiency.
Ambarella, Inc.
Ambarella experienced revenue growth from $223M in 2021 to $285M in 2025, though net income remained negative, worsening from -$60M to -$117M. Gross margin was strong at 60.5%, but EBIT and net margins were significantly negative, at -44.4% and -41.1% respectively. The 2025 year saw a 25.8% revenue increase and improving margins, but ongoing losses persist.
Which one has the stronger fundamentals?
Applied Materials demonstrates stronger fundamentals with consistent profitability, positive net income growth, and stable margins, despite a slight net margin dip. Ambarella, while growing revenue and gross profit substantially, continues to face significant net losses and unfavorable EBIT margins. Overall, Applied Materials presents a more robust and stable income statement profile.
Financial Ratios Comparison
The table below presents a side-by-side comparison of the most recent key financial ratios for Applied Materials, Inc. (AMAT) and Ambarella, Inc. (AMBA) based on their latest fiscal year data.
| Ratios | Applied Materials, Inc. (AMAT) | Ambarella, Inc. (AMBA) |
|---|---|---|
| ROE | 34.3% | -20.9% |
| ROIC | 21.96% | -21.96% |
| P/E | 26.58 | -27.05 |
| P/B | 9.11 | 5.64 |
| Current Ratio | 2.61 | 2.65 |
| Quick Ratio | 1.87 | 2.36 |
| D/E (Debt-to-Equity) | 0.35 | 0.0094 |
| Debt-to-Assets | 19.4% | 0.76% |
| Interest Coverage | 30.8 | 0 |
| Asset Turnover | 0.78 | 0.41 |
| Fixed Asset Turnover | 5.54 | 19.96 |
| Payout Ratio | 19.8% | 0% |
| Dividend Yield | 0.74% | 0% |
Interpretation of the Ratios
Applied Materials, Inc.
Applied Materials shows predominantly strong financial ratios with favorable net margin (24.67%), ROE (34.28%), and ROIC (21.96%), indicating efficient profitability and capital use. Some valuation metrics like P/E (26.58) and P/B (9.11) are less attractive. The company pays dividends, but with a modest yield of 0.74%, suggesting a conservative payout supported by solid free cash flow, reducing risk of unsustainable distributions.
Ambarella, Inc.
Ambarella exhibits weak profitability ratios, including a negative net margin (-41.12%), ROE (-20.86%), and ROIC (-21.96%), reflecting operational challenges. Liquidity ratios are healthy, and leverage is low. The company does not pay dividends, likely due to negative earnings and a focus on reinvestment in R&D, consistent with high research and development expenses and no share buyback program.
Which one has the best ratios?
Applied Materials presents a more favorable overall ratio profile, with a majority of ratios positive and indicating strong operational and financial health. Ambarella’s unfavorable profitability and coverage ratios, combined with a lack of dividends, suggest higher risk and less financial stability. Thus, Applied Materials currently demonstrates stronger financial ratio metrics.
Strategic Positioning
This section compares the strategic positioning of Applied Materials, Inc. and Ambarella, Inc. regarding market position, key segments, and exposure to technological disruption:
Applied Materials, Inc.
- Leading semiconductor equipment supplier with significant market cap and global presence facing competitive pressure.
- Diversified revenue from Semiconductor Systems, Global Services, and Display segments driving business growth.
- Moderate exposure to disruption via advanced semiconductor manufacturing technologies and fab performance solutions.
Ambarella, Inc.
- Smaller semiconductor solutions provider focused on video processing, facing high competition and volatility.
- Concentrated on semiconductor video solutions for automotive, security, and consumer cameras.
- High exposure to disruption through AI, computer vision, and evolving video compression technologies.
Applied Materials, Inc. vs Ambarella, Inc. Positioning
Applied Materials operates with a diversified portfolio across semiconductor equipment and services, offering stability but facing broad industry challenges. Ambarella’s concentrated focus on video semiconductors offers specialization advantages but entails higher risk and volatility from market shifts.
Which has the best competitive advantage?
Applied Materials shows a slightly favorable moat with value creation despite declining profitability, while Ambarella displays a very unfavorable moat with value destruction and steeply declining returns, indicating a weaker competitive advantage.
Stock Comparison
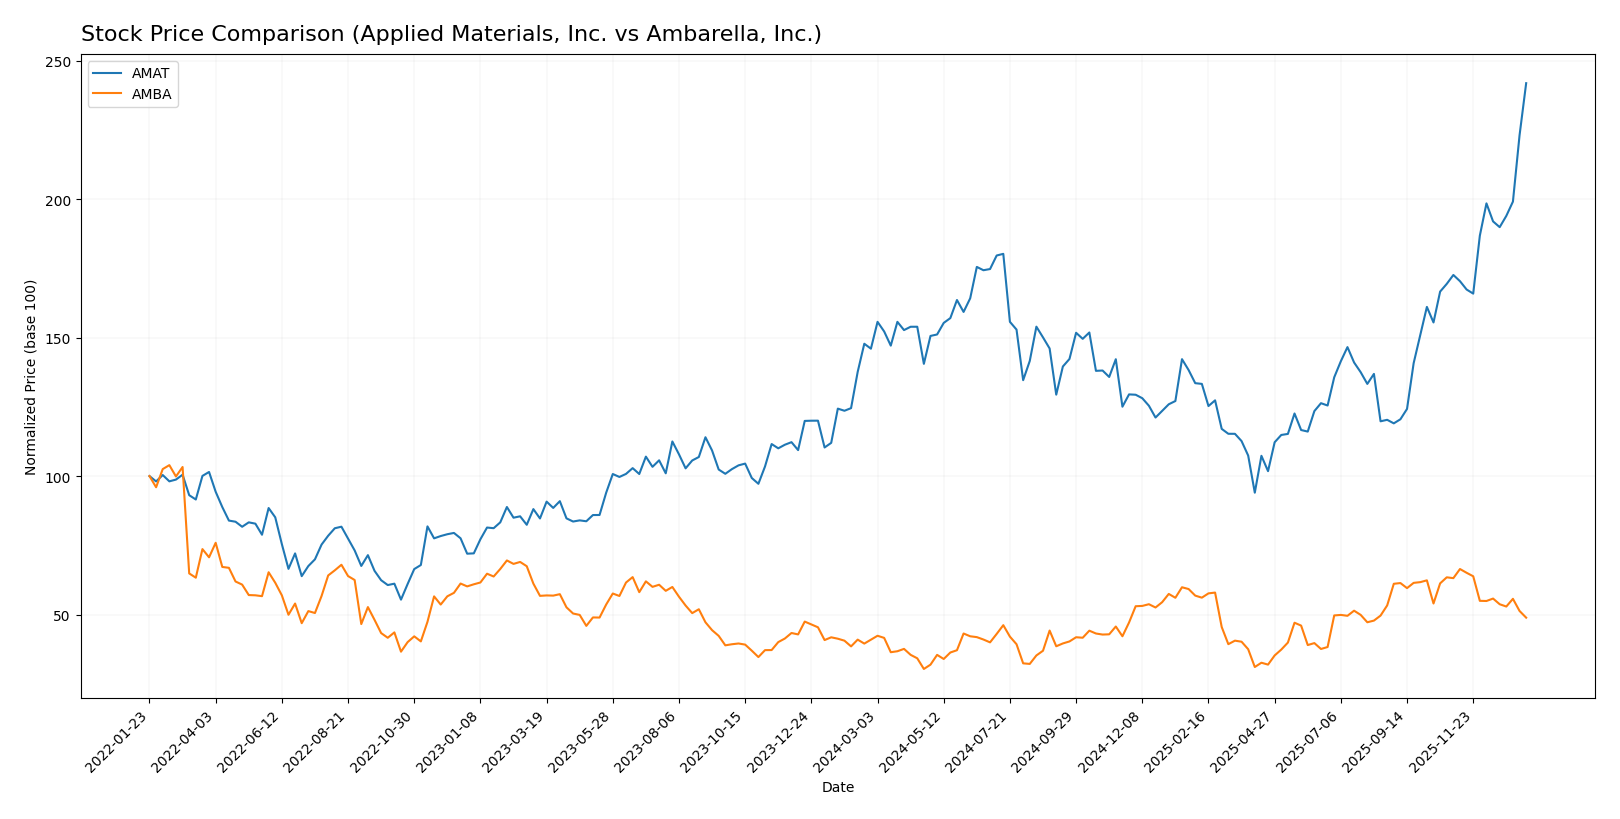
The stock price chart highlights significant bullish momentum for Applied Materials, Inc. with a 65.65% rise over the past year, while Ambarella, Inc. posted a smaller 19.39% increase despite recent deceleration and volatility shifts.
Trend Analysis
Applied Materials, Inc. (AMAT) exhibited a strong bullish trend with a 65.65% price increase over the past 12 months, showing acceleration and high volatility with a standard deviation of 34.7. The stock reached a high of 326.6 and a low of 126.95.
Ambarella, Inc. (AMBA) also showed a bullish trend with a 19.39% gain over the same period but experienced deceleration. The stock’s volatility was lower, with a standard deviation of 12.81, and prices ranged between 40.99 and 89.67.
Comparatively, Applied Materials delivered the highest market performance with a much larger price increase and accelerating momentum, whereas Ambarella posted a moderate gain with recent bearish movement.
Target Prices
Analysts present a solid target price consensus for both Applied Materials, Inc. and Ambarella, Inc.
| Company | Target High | Target Low | Consensus |
|---|---|---|---|
| Applied Materials, Inc. | 400 | 273 | 327.71 |
| Ambarella, Inc. | 115 | 80 | 97.5 |
The consensus target prices suggest moderate upside potential for Applied Materials, slightly above its current price of 324.64 USD, while Ambarella shows a significantly higher upside compared to its current 65.87 USD, reflecting stronger growth expectations.
Analyst Opinions Comparison
This section compares analysts’ ratings and grades for Applied Materials, Inc. (AMAT) and Ambarella, Inc. (AMBA):
Rating Comparison
AMAT Rating
- Rating: B+ indicating a very favorable overall assessment.
- Discounted Cash Flow Score: Moderate score of 3, reflecting balanced valuation.
- ROE Score: Very favorable high score of 5, showing strong profit efficiency.
- ROA Score: Very favorable high score of 5, demonstrating effective asset use.
- Debt To Equity Score: Moderate score of 2, suggesting manageable financial risk.
- Overall Score: Moderate score of 3 summarizing balanced company performance.
AMBA Rating
- Rating: C+ with a very favorable overall assessment.
- Discounted Cash Flow Score: Moderate score of 3, indicating balanced valuation.
- ROE Score: Very unfavorable low score of 1, indicating weak profit efficiency.
- ROA Score: Very unfavorable low score of 1, indicating poor asset utilization.
- Debt To Equity Score: Favorable score of 4, indicating low financial risk.
- Overall Score: Moderate score of 2 summarizing below-average company performance.
Which one is the best rated?
Based on the provided data, AMAT holds a better rating with a B+ versus AMBA’s C+. AMAT shows notably stronger ROE and ROA scores, while AMBA has a better debt-to-equity score but a lower overall score.
Scores Comparison
The comparison of Applied Materials, Inc. (AMAT) and Ambarella, Inc. (AMBA) scores is as follows:
AMAT Scores
- Altman Z-Score: 13.45, indicating a safe zone.
- Piotroski Score: 7, categorized as strong.
AMBA Scores
- Altman Z-Score: 10.69, indicating a safe zone.
- Piotroski Score: 3, categorized as very weak.
Which company has the best scores?
Based on the provided data, AMAT has higher Altman Z-Score and Piotroski Score values, reflecting stronger financial health compared to AMBA, which has a lower Piotroski Score despite a safe Altman Z-Score.
Grades Comparison
Here is the grades comparison for Applied Materials, Inc. and Ambarella, Inc.:
Applied Materials, Inc. Grades
The table below shows recent grades from leading grading companies for Applied Materials, Inc.
| Grading Company | Action | New Grade | Date |
|---|---|---|---|
| B of A Securities | Maintain | Buy | 2026-01-13 |
| Susquehanna | Upgrade | Positive | 2026-01-12 |
| Cantor Fitzgerald | Maintain | Overweight | 2026-01-08 |
| B. Riley Securities | Maintain | Buy | 2025-12-18 |
| Mizuho | Maintain | Neutral | 2025-12-17 |
| Wells Fargo | Maintain | Overweight | 2025-12-15 |
| Jefferies | Maintain | Buy | 2025-12-15 |
| Keybanc | Maintain | Overweight | 2025-12-02 |
| UBS | Upgrade | Buy | 2025-11-25 |
| B. Riley Securities | Maintain | Buy | 2025-11-14 |
Applied Materials shows a consistently positive trend with multiple “Buy” and “Overweight” ratings, and recent upgrades indicating growing confidence.
Ambarella, Inc. Grades
The table below shows recent grades from leading grading companies for Ambarella, Inc.
| Grading Company | Action | New Grade | Date |
|---|---|---|---|
| B of A Securities | Maintain | Neutral | 2025-11-26 |
| Needham | Maintain | Buy | 2025-11-26 |
| Stifel | Maintain | Buy | 2025-11-26 |
| Rosenblatt | Maintain | Buy | 2025-11-26 |
| Rosenblatt | Maintain | Buy | 2025-11-24 |
| Stifel | Maintain | Buy | 2025-08-29 |
| Needham | Maintain | Buy | 2025-08-29 |
| Northland Capital Markets | Maintain | Outperform | 2025-08-29 |
| Morgan Stanley | Maintain | Overweight | 2025-08-29 |
| Oppenheimer | Maintain | Perform | 2025-08-29 |
Ambarella’s grades are mostly “Buy” or equivalent, with a few neutral and perform ratings, reflecting a stable but less frequently upgraded outlook.
Which company has the best grades?
Applied Materials, Inc. has received more frequent upgrades and consistently strong “Buy” and “Overweight” ratings compared to Ambarella’s mostly stable “Buy” and “Neutral” grades. This suggests a stronger analyst confidence trend in Applied Materials, which may influence investor sentiment and risk assessments.
Strengths and Weaknesses
Below is a comparative overview of the strengths and weaknesses of Applied Materials, Inc. (AMAT) and Ambarella, Inc. (AMBA) based on their recent financial performance and market positioning.
| Criterion | Applied Materials, Inc. (AMAT) | Ambarella, Inc. (AMBA) |
|---|---|---|
| Diversification | Highly diversified with strong revenue streams across Semiconductor Systems (19.9B), Applied Global Services (6.2B), and Display and Adjacent Markets (885M) | Limited diversification, focused mainly on video processing chips, which exposes it to higher market risk |
| Profitability | Strong profitability: net margin 24.67%, ROE 34.28%, ROIC 21.96%, consistently creating value | Negative profitability: net margin -41.12%, ROE -20.86%, ROIC -21.96%, value destroying over recent years |
| Innovation | Continuous innovation in semiconductor equipment, which supports its global leadership and high fixed asset turnover (5.54) | Innovation challenges evident due to declining ROIC and deteriorating profitability metrics |
| Global presence | Strong global presence supported by large, diversified product segments and services | Smaller global footprint with limited product range and market penetration |
| Market Share | Leading market share in semiconductor systems with 19.9B revenue segment | Smaller market share and declining financial health limit competitive positioning |
Key takeaways: Applied Materials demonstrates robust diversification, high profitability, and a strong global presence, making it a relatively safer investment despite a slight decline in ROIC. Ambarella, however, struggles with significant profitability challenges and a narrow business focus, which raises caution for investors.
Risk Analysis
Below is a comparative risk table for Applied Materials, Inc. (AMAT) and Ambarella, Inc. (AMBA) based on the most recent data from 2025.
| Metric | Applied Materials, Inc. (AMAT) | Ambarella, Inc. (AMBA) |
|---|---|---|
| Market Risk | Beta 1.67; moderate volatility | Beta 1.95; higher volatility |
| Debt level | Low (D/E 0.35; debt/assets 19.42%) | Very low (D/E 0.01; debt/assets 0.76%) |
| Regulatory Risk | Moderate; global semiconductor regulations | Moderate; AI and video tech regulations |
| Operational Risk | Moderate; complex manufacturing processes | Elevated; smaller scale, reliance on niche markets |
| Environmental Risk | Moderate; manufacturing emissions managed | Low; less intensive production footprint |
| Geopolitical Risk | High; significant exposure in Asia | Moderate; diversified global sales |
The most impactful risks are AMAT’s geopolitical exposure given its extensive operations in Asia, and AMBA’s operational challenges as a smaller, less diversified player with negative margins. Both face regulatory risks typical in advanced semiconductor and AI-driven sectors. Caution is warranted especially with AMBA’s financial instability.
Which Stock to Choose?
Applied Materials, Inc. (AMAT) shows steadily growing income with a favorable net margin of 24.67% and strong profitability ratios including ROE at 34.28% and ROIC at 21.96%. Its debt levels and liquidity ratios are well managed, supported by a B+ rating and a generally favorable financial profile.
Ambarella, Inc. (AMBA) exhibits a mixed income trend with a high gross margin but negative net margin of -41.12%, reflecting profitability challenges. While it maintains low debt ratios and a C+ rating, its financial ratios largely indicate unfavorable profitability and operational efficiency, with a very unfavorable moat status.
For investors, AMAT might appear more suitable for those valuing consistent profitability and financial strength, while AMBA could be considered by those willing to tolerate higher risk for potential turnaround opportunities. The choice may depend on the investor’s risk tolerance and focus on value creation versus recovery potential.
Disclaimer: Investment carries a risk of loss of initial capital. The past performance is not a reliable indicator of future results. Be sure to understand risks before making an investment decision.
Go Further
I encourage you to read the complete analyses of Applied Materials, Inc. and Ambarella, Inc. to enhance your investment decisions: