Home > Comparison > Technology > ADI vs AMBA
The strategic rivalry between Analog Devices, Inc. and Ambarella, Inc. shapes the semiconductor industry’s evolution. Analog Devices operates as a capital-intensive technology powerhouse, focusing on analog, mixed-signal, and digital signal processing integrated circuits. Ambarella, by contrast, pursues a niche in high-margin video processing SoCs with AI integration. This analysis evaluates which company’s operational model offers superior risk-adjusted returns for diversified portfolios amid shifting market dynamics.

Table of contents
Companies Overview
Analog Devices and Ambarella stand as influential players in the semiconductor sector, each shaping distinct technological niches.
Analog Devices, Inc.: Pioneer in Signal Processing Solutions
Analog Devices dominates the analog and mixed-signal integrated circuits market. It generates revenue by designing and marketing ICs that convert, condition, and process analog and digital signals across automotive, industrial, and communications sectors. In 2026, the company concentrates on expanding its power management and sensor technologies to solidify its competitive edge in high-performance applications.
Ambarella, Inc.: Innovator in Video Semiconductor Systems
Ambarella excels in video semiconductor system-on-a-chip (SoC) solutions, integrating HD video processing, AI vision algorithms, and low power consumption on single chips. Its core revenue stems from supplying automotive cameras and security imaging devices. The 2026 strategy targets advancing AI-driven video compression and autonomous vehicle camera systems to capture growing demand in automotive safety and surveillance.
Strategic Collision: Similarities & Divergences
Analog Devices pursues a broad, diversified product portfolio with a focus on analog precision, while Ambarella bets on highly integrated, AI-powered video SoCs. Their primary battleground lies in automotive sensor and imaging technologies. Analog Devices offers stability through scale and variety, whereas Ambarella presents a sharper growth profile driven by innovation in AI video processing.
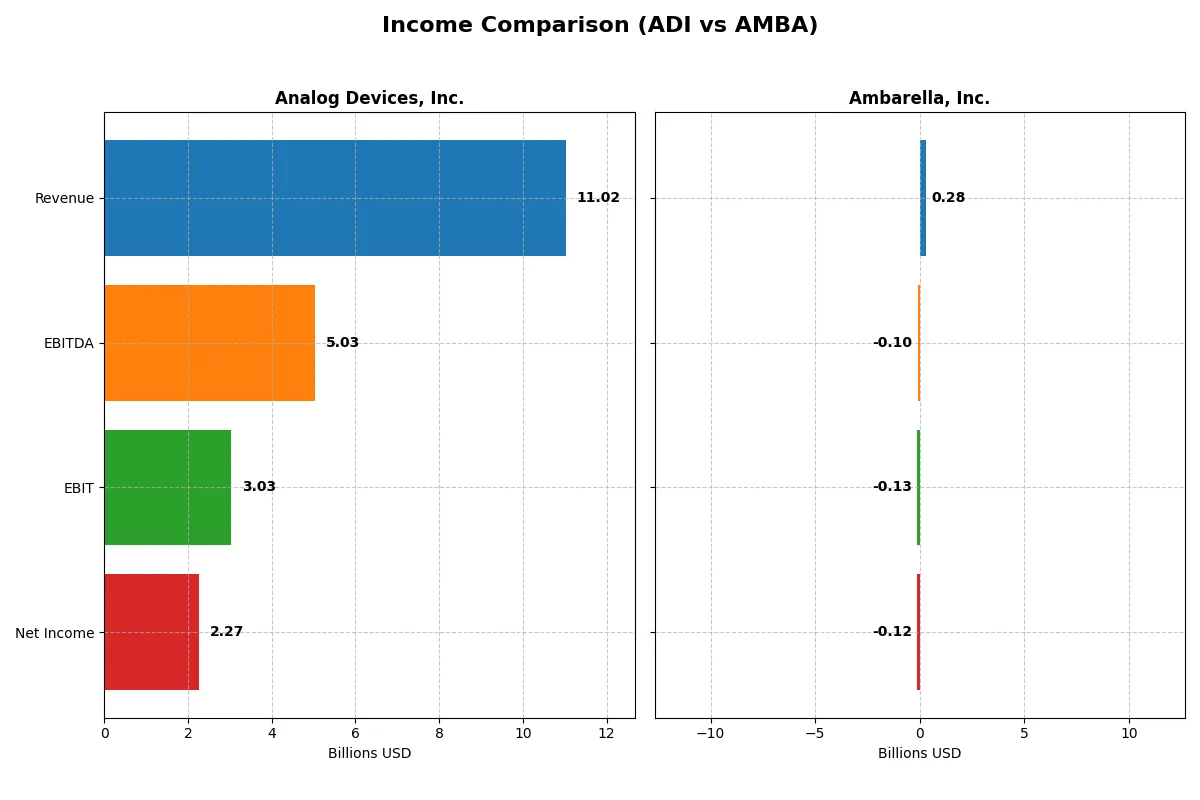
Income Statement Comparison
This data dissects the core profitability and scalability of both corporate engines to reveal who dominates the bottom line:
| Metric | Analog Devices, Inc. (ADI) | Ambarella, Inc. (AMBA) |
|---|---|---|
| Revenue | 11.0B | 285M |
| Cost of Revenue | 5.0B | 113M |
| Operating Expenses | 3.0B | 299M |
| Gross Profit | 6.0B | 172M |
| EBITDA | 5.0B | -101M |
| EBIT | 3.0B | -127M |
| Interest Expense | 318M | 0 |
| Net Income | 2.3B | -117M |
| EPS | 4.59 | -2.84 |
| Fiscal Year | 2025 | 2025 |
Income Statement Analysis: The Bottom-Line Duel
This income statement comparison exposes which company delivers superior operational efficiency and profitability across their financial engines.
Analog Devices, Inc. Analysis
ADI’s revenue climbed steadily from $7.3B in 2021 to $11B in 2025, with net income rising from $1.39B to $2.27B. Gross and net margins remain strong at 54.7% and 20.6%, respectively, signaling sustained cost control and pricing power. The 2025 fiscal year saw EBITDA surge 44%, reflecting robust operational momentum.
Ambarella, Inc. Analysis
AMBA’s revenue increased from $223M in 2021 to $285M in 2025, yet net losses persisted, with a net margin of -41.1% in 2025. Despite a favorable gross margin of 60.5%, the company struggles with negative EBIT margins at -44.4%, indicating high operating expenses eroding profitability. Recent years show improving revenue growth but continued bottom-line challenges.
Margin Strength vs. Profitability Scale
ADI clearly outperforms with healthy margins and consistent net income growth, while AMBA battles mounting losses despite revenue gains. ADI’s profile suits investors seeking stable profitability and margin resilience. AMBA’s trajectory suggests a higher-risk growth story lacking current profitability.
Financial Ratios Comparison
These vital ratios act as a diagnostic tool to expose the underlying fiscal health, valuation premiums, and capital efficiency of the companies compared below:
| Ratios | Analog Devices, Inc. (ADI) | Ambarella, Inc. (AMBA) |
|---|---|---|
| ROE | 6.7% | -20.9% |
| ROIC | 5.5% | -21.9% |
| P/E | 51.1 | -27.1 |
| P/B | 3.42 | 5.64 |
| Current Ratio | 2.19 | 2.65 |
| Quick Ratio | 1.68 | 2.36 |
| D/E (Debt/Equity) | 0.26 | 0.009 |
| Debt-to-Assets | 18.1% | 0.76% |
| Interest Coverage | 9.45 | 0 |
| Asset Turnover | 0.23 | 0.41 |
| Fixed Asset Turnover | 3.32 | 19.96 |
| Payout Ratio | 84.9% | 0% |
| Dividend Yield | 1.66% | 0% |
| Fiscal Year | 2025 | 2025 |
Efficiency & Valuation Duel: The Vital Signs
Ratios serve as a company’s DNA, uncovering hidden risks and operational strengths that raw numbers often mask.
Analog Devices, Inc.
Analog Devices shows solid operational efficiency with a favorable 20.58% net margin but a low 6.7% ROE, signaling moderate profitability. Its valuation appears stretched, with a high P/E of 51.05 and P/B of 3.42. The company maintains a healthy 2.19 current ratio and returns 1.66% in dividends, balancing growth with shareholder rewards.
Ambarella, Inc.
Ambarella struggles with profitability, posting a negative net margin of -41.12% and a deeply negative ROE of -20.86%. Its P/E ratio is negative, reflecting losses, while P/B at 5.64 suggests overvaluation. Strong liquidity ratios above 2.3 contrast with zero dividend yield, as Ambarella heavily invests in R&D (nearly 79%) to fuel future growth.
Profitability vs. Growth: Risk and Reward in Contrast
Analog Devices offers a more balanced risk-reward profile, pairing operational profitability with reasonable liquidity and shareholder returns. Ambarella’s metrics reveal significant risk due to losses and high valuation but highlight aggressive reinvestment for growth. Investors seeking stability may prefer Analog Devices, while those with higher risk tolerance might consider Ambarella’s growth focus.
Which one offers the Superior Shareholder Reward?
I compare Analog Devices, Inc. (ADI) and Ambarella, Inc. (AMBA) on shareholder returns. ADI delivers a 1.66% dividend yield with an 85% payout ratio, supported by strong free cash flow of 8.65/share. ADI also runs robust buybacks, enhancing returns sustainably. AMBA pays no dividend and posts negative margins but reinvests in growth, with limited buyback activity. Given AMBA’s losses and weak cash flow, ADI’s balanced dividend and buybacks offer a superior, more sustainable total return profile for 2026 investors.
Comparative Score Analysis: The Strategic Profile
The radar chart reveals the fundamental DNA and trade-offs of Analog Devices, Inc. and Ambarella, Inc., highlighting their distinct financial strengths and vulnerabilities:
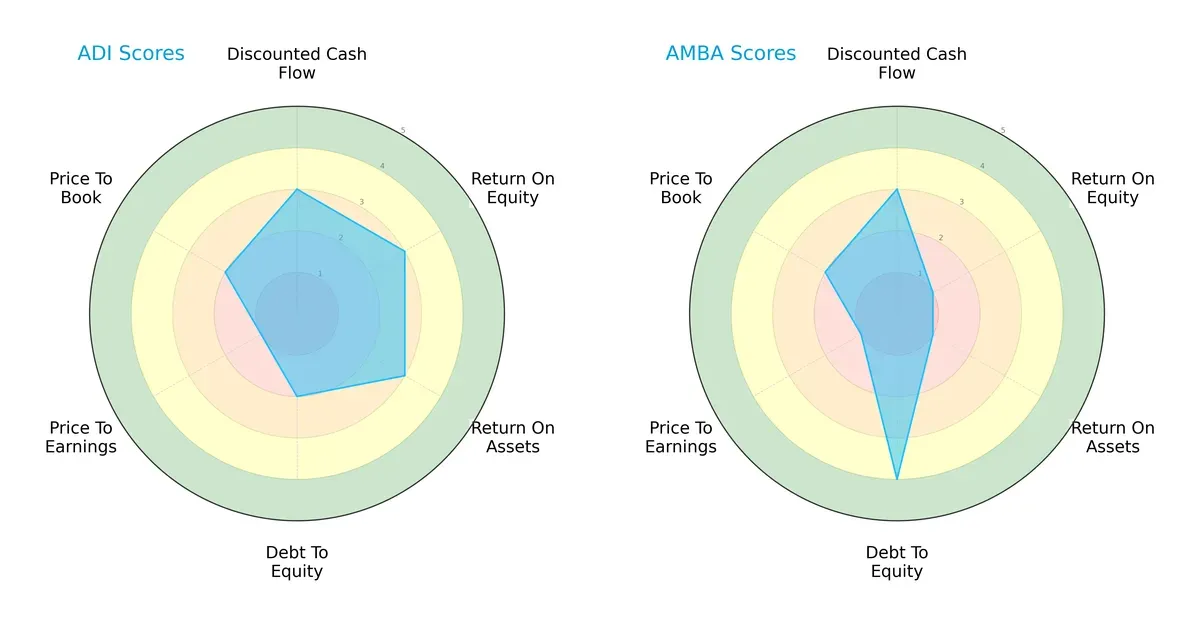
Analog Devices displays a balanced profile with moderate scores across DCF, ROE, ROA, and debt-to-equity, though it struggles with valuation metrics. Ambarella relies heavily on a strong debt-to-equity score but suffers from weak returns (ROE and ROA) and equally poor valuation scores. ADI’s diversified strengths suggest a more stable footing, while AMBA depends on financial leverage advantages.
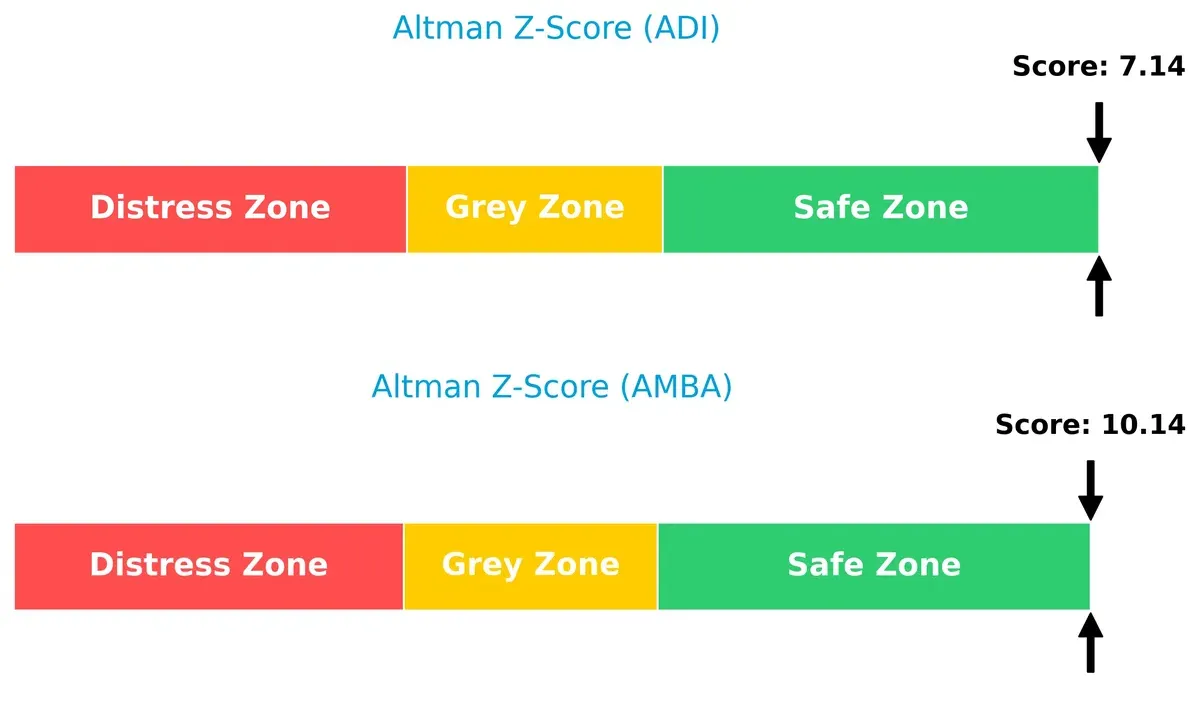
Bankruptcy Risk: Solvency Showdown
The Altman Z-Score gap shows both companies in the safe zone, but Ambarella’s higher score signals a stronger buffer against bankruptcy risks in this cycle:
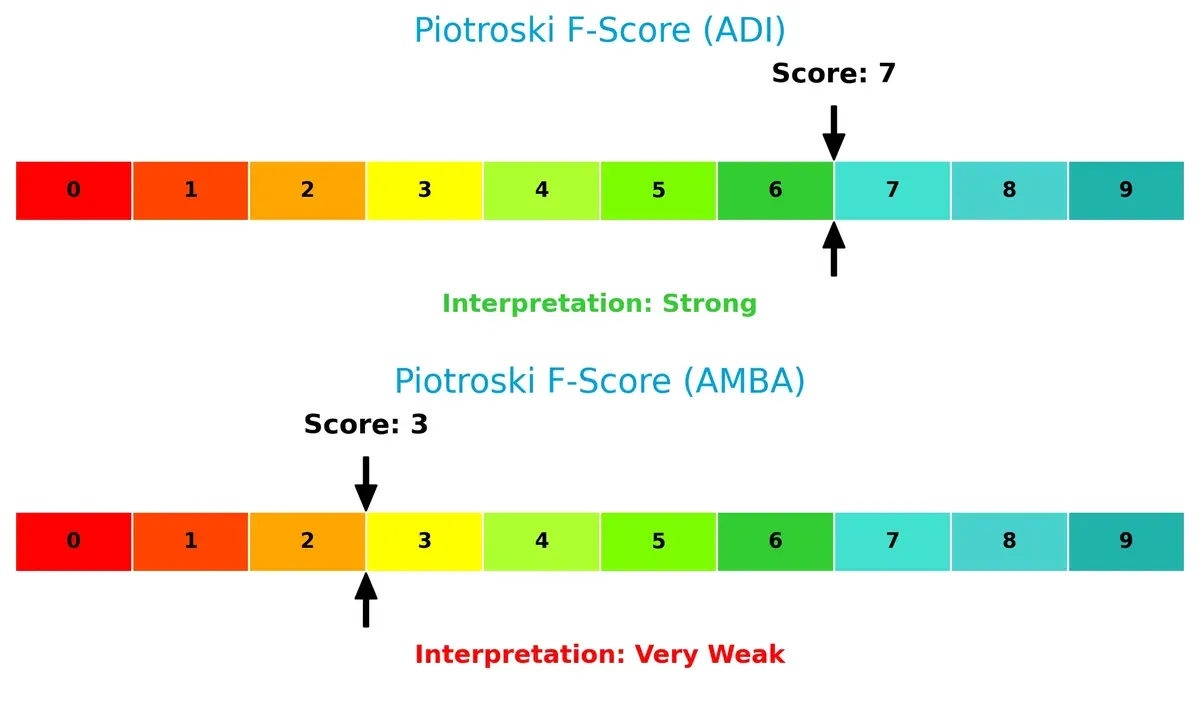
Financial Health: Quality of Operations
Analog Devices scores 7 on the Piotroski F-Score, indicating robust financial health and operational quality. Ambarella’s low score of 3 raises significant red flags about its internal metrics and long-term sustainability:
How are the two companies positioned?
This section dissects ADI and AMBA’s operational DNA by comparing their revenue distribution and internal strengths and weaknesses. The goal is to confront their economic moats and reveal which company’s model offers the most resilient competitive advantage today.
Revenue Segmentation: The Strategic Mix
This visual comparison dissects how Analog Devices, Inc. and Ambarella, Inc. diversify their income streams and where their primary sector bets lie:
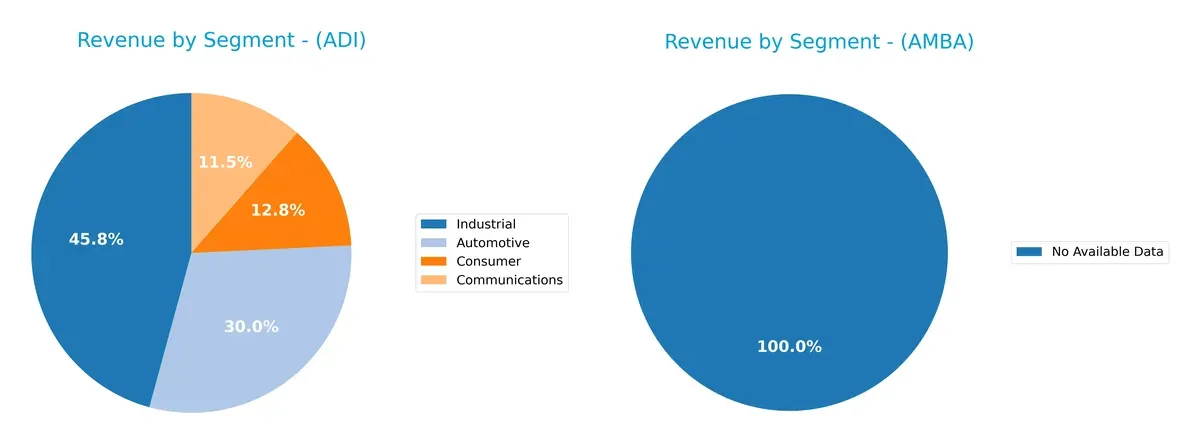
Analog Devices anchors its revenue in Industrial ($4.3B) and Automotive ($2.8B), with Communications ($1.1B) and Consumer ($1.2B) segments providing solid diversification. Ambarella lacks available segment data, preventing direct comparison. ADI’s broad mix reduces concentration risk and leverages infrastructure dominance, while Ambarella’s undisclosed breakdown raises transparency concerns. Historically, ADI’s diverse portfolio supports resilience across market cycles.
Strengths and Weaknesses Comparison
This table compares the Strengths and Weaknesses of Analog Devices, Inc. and Ambarella, Inc.:
ADI Strengths
- Diversified revenue across Automotive, Communications, Consumer, Industrial sectors
- Favorable net margin at 20.58%
- Strong liquidity ratios with current ratio of 2.19
- Low debt-to-equity at 0.26 supports financial stability
- Significant global presence with major sales in US, China, Europe
- Favorable fixed asset turnover at 3.32 indicates operational efficiency
AMBA Strengths
- Favorable price-to-earnings ratio despite losses
- Strong liquidity with current ratio of 2.65 and quick ratio of 2.36
- Minimal debt with debt-to-assets at 0.76%
- High fixed asset turnover at 19.96 suggests efficient asset use
- Geographic sales focused in Taiwan and Asia Pacific shows regional strength
ADI Weaknesses
- Return on equity at 6.7% is below industry benchmarks
- Price-to-book ratio at 3.42 is relatively high
- Asset turnover at 0.23 is low, indicating slower revenue generation from assets
- PE ratio at 51.05 may reflect overvaluation concerns
- Neutral ROIC vs WACC suggests limited value creation
AMBA Weaknesses
- Negative net margin at -41.12% signals unprofitability
- Negative ROE and ROIC indicate poor capital returns
- Unfavorable weighted average cost of capital at 12.99%
- Interest coverage of zero raises solvency concerns
- No dividend yield and unfavorable asset turnover at 0.41 point to operational challenges
Overall, ADI demonstrates solid diversification, profitability, and financial health with some valuation and efficiency concerns. AMBA shows strong liquidity and asset efficiency but faces significant profitability and capital return weaknesses. These factors highlight contrasting strategic challenges for each company.
The Moat Duel: Analyzing Competitive Defensibility
A structural moat alone protects long-term profits from relentless competitive erosion. Let’s dissect the moats of two semiconductor players:
Analog Devices, Inc. (ADI): Intangible Assets and Broad Market Reach
ADI’s competitive edge stems from deep intangible assets and diversified product lines serving industrial to automotive sectors. Its slightly unfavorable ROIC vs. WACC signals value erosion but rising profitability suggests potential moat strengthening in 2026.
Ambarella, Inc. (AMBA): Niche Innovation with High Gross Margins
AMBA relies on specialized video-processing chips, contrasting ADI’s broad analog portfolio. Despite a very unfavorable ROIC trend, its 60.5% gross margin reflects strong cost structure. Expansion into autonomous vehicle domains could disrupt its moat dynamic.
Moat Resilience: Diversification vs. Niche Innovation
ADI’s broader market footprint and improving ROIC trend hint at a deeper, more durable moat. AMBA’s niche focus drives gross margin but declining profitability weakens its competitive shield. ADI stands better poised to defend market share in 2026.
Which stock offers better returns?
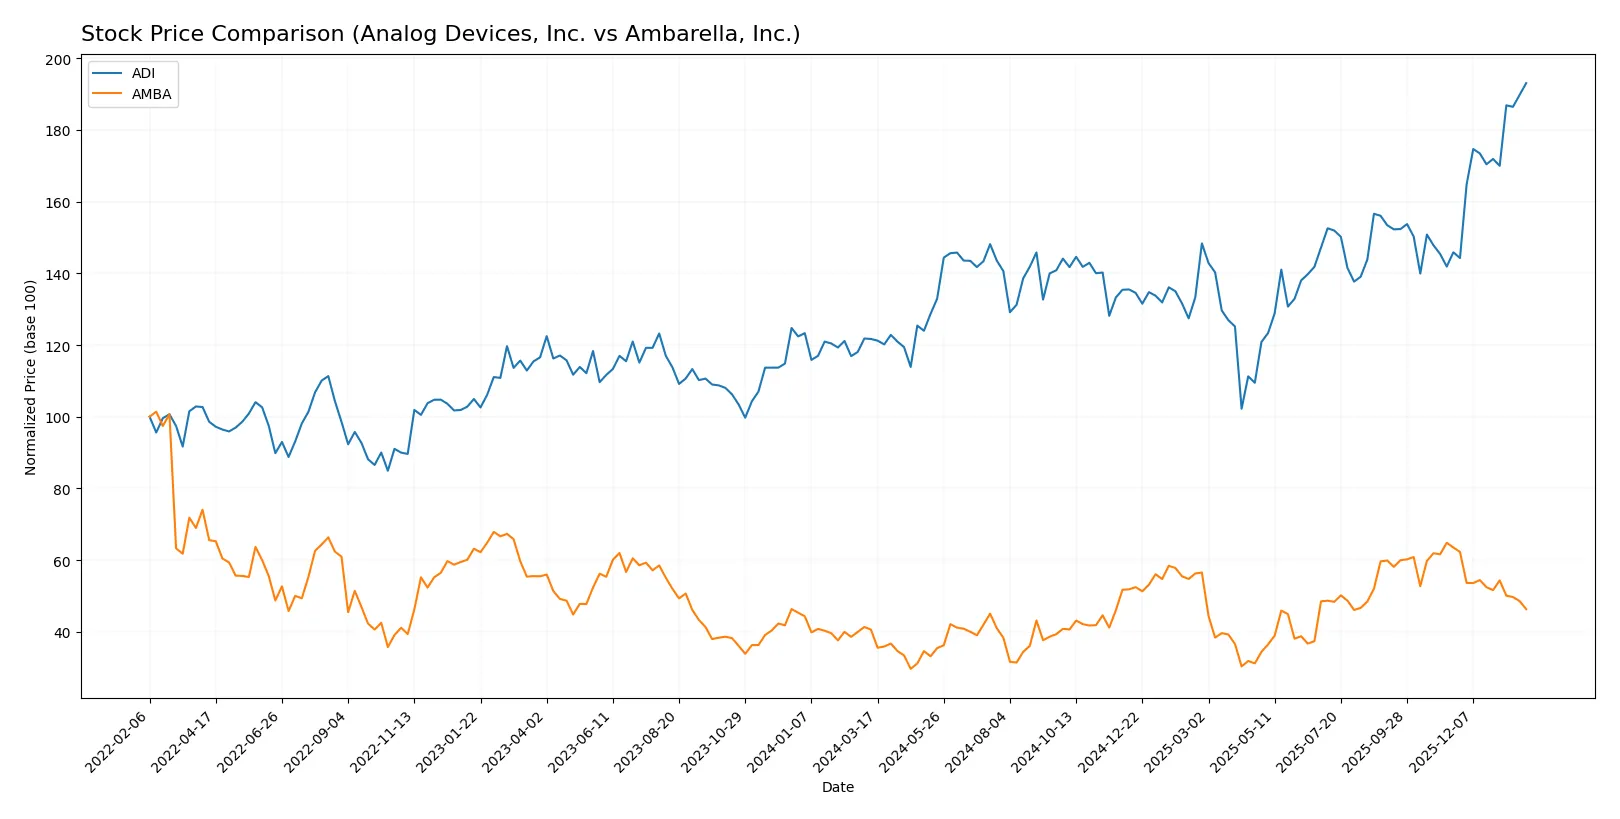
Over the past 12 months, Analog Devices, Inc. surged 58.66%, displaying accelerating bullish momentum. Ambarella, Inc. rose 14.09% but with decelerating gains, reflecting more moderated trading dynamics.
Trend Comparison
Analog Devices, Inc. shows a strong bullish trend with a 58.66% price increase over 12 months and accelerating momentum. Price volatility is elevated at a 26.38 std deviation, with a high of 310.88 and low of 164.6.
Ambarella, Inc. also exhibits a bullish trend over 12 months, rising 14.09%, though momentum decelerates. Volatility is lower at 12.79 std deviation, with a high of 89.67 and low of 40.99.
Analog Devices, Inc. outperformed Ambarella, Inc. significantly, delivering the highest market return in the past year.
Target Prices
Analysts present a clear target price consensus for Analog Devices, Inc. and Ambarella, Inc.
| Company | Target Low | Target High | Consensus |
|---|---|---|---|
| Analog Devices, Inc. | 270 | 375 | 316 |
| Ambarella, Inc. | 80 | 115 | 97.5 |
The consensus targets for both stocks suggest moderate upside potential. Analog Devices trades near its consensus price, while Ambarella shows room for appreciation versus its current 64.04 USD price.

Don’t Let Luck Decide Your Entry Point
Optimize your entry points with our advanced ProRealTime indicators. You’ll get efficient buy signals with precise price targets for maximum performance. Start outperforming now!
How do institutions grade them?
The following tables summarize recent institutional grades for Analog Devices, Inc. and Ambarella, Inc.:
Analog Devices, Inc. Grades
This table displays the latest grades and actions from key financial institutions for Analog Devices, Inc.
| Grading Company | Action | New Grade | Date |
|---|---|---|---|
| Susquehanna | maintain | Positive | 2026-01-22 |
| B of A Securities | maintain | Buy | 2026-01-21 |
| Stifel | maintain | Buy | 2026-01-16 |
| Oppenheimer | maintain | Outperform | 2026-01-16 |
| Wells Fargo | upgrade | Overweight | 2026-01-15 |
| Citigroup | maintain | Buy | 2026-01-15 |
| Keybanc | maintain | Overweight | 2026-01-13 |
| Truist Securities | maintain | Hold | 2025-12-19 |
| UBS | maintain | Buy | 2025-12-08 |
| Truist Securities | maintain | Hold | 2025-11-26 |
Ambarella, Inc. Grades
The following grades represent recent evaluations from financial firms for Ambarella, Inc.
| Grading Company | Action | New Grade | Date |
|---|---|---|---|
| Stifel | maintain | Buy | 2025-11-26 |
| Needham | maintain | Buy | 2025-11-26 |
| B of A Securities | maintain | Neutral | 2025-11-26 |
| Rosenblatt | maintain | Buy | 2025-11-26 |
| Rosenblatt | maintain | Buy | 2025-11-24 |
| Oppenheimer | maintain | Perform | 2025-08-29 |
| B of A Securities | maintain | Neutral | 2025-08-29 |
| Needham | maintain | Buy | 2025-08-29 |
| Rosenblatt | maintain | Buy | 2025-08-29 |
| Morgan Stanley | maintain | Overweight | 2025-08-29 |
Which company has the best grades?
Analog Devices, Inc. holds stronger and more consistent buy and outperform ratings than Ambarella, Inc. This suggests higher institutional confidence in Analog Devices, potentially leading to greater investor interest and support.
Risks specific to each company
In 2026’s dynamic market, these categories identify critical pressure points and systemic threats facing Analog Devices, Inc. and Ambarella, Inc.:
1. Market & Competition
Analog Devices, Inc.
- Large market cap and diversified products buffer competitive pressure.
Ambarella, Inc.
- Smaller scale and niche focus increase vulnerability to market shifts and competitors.
2. Capital Structure & Debt
Analog Devices, Inc.
- Conservative debt ratio (0.26 D/E) supports financial stability and interest coverage.
Ambarella, Inc.
- Minimal debt (0.01 D/E) reduces leverage risk but zero interest coverage signals cash flow challenges.
3. Stock Volatility
Analog Devices, Inc.
- Beta near 1.03 indicates market-like volatility, manageable for institutional investors.
Ambarella, Inc.
- High beta 1.95 suggests greater price swings and higher risk for traders.
4. Regulatory & Legal
Analog Devices, Inc.
- Established compliance frameworks in semiconductor industry reduce regulatory surprises.
Ambarella, Inc.
- Emerging compliance risks due to rapid AI and automotive tech expansion.
5. Supply Chain & Operations
Analog Devices, Inc.
- Global footprint and scale improve supply chain resilience amid disruptions.
Ambarella, Inc.
- Smaller operations may face higher supply chain fragility and operational bottlenecks.
6. ESG & Climate Transition
Analog Devices, Inc.
- Mature ESG policies likely in place given size and industry scrutiny.
Ambarella, Inc.
- ESG efforts less transparent, posing potential reputational and regulatory risks.
7. Geopolitical Exposure
Analog Devices, Inc.
- Broad international presence exposes ADI to trade tensions but spreads risk.
Ambarella, Inc.
- Concentrated markets increase susceptibility to localized geopolitical disruptions.
Which company shows a better risk-adjusted profile?
Analog Devices’ most impactful risk is its high valuation multiples, which increase downside risk if growth slows. Ambarella’s key risk is persistent negative profitability and weak financial metrics, signaling distress. I observe Analog Devices maintains a safer balance sheet and more stable operations. Its Altman Z-Score above 7 and strong Piotroski score confirm financial strength. Ambarella’s very weak Piotroski score highlights operational weakness despite a strong Altman Z-Score. Overall, Analog Devices offers a better risk-adjusted profile thanks to scale, diversification, and financial resilience.
Final Verdict: Which stock to choose?
Analog Devices, Inc. (ADI) excels as a cash-generating powerhouse with robust operating margins and a prudent balance sheet. Its growing profitability amidst a slightly unfavorable moat signals improving efficiency. A point of vigilance is its premium valuation, which might temper near-term upside. ADI suits portfolios targeting steady, long-term growth with moderate risk tolerance.
Ambarella, Inc. (AMBA) offers a strategic moat rooted in its cutting-edge R&D, fueling top-line growth despite ongoing profitability challenges. Its low leverage and strong liquidity provide a cushion against volatility, presenting a safer profile relative to its financial struggles. AMBA fits investors seeking GARP exposure with a focus on innovation-driven recovery potential.
If you prioritize consistent value creation and improving profitability, ADI is the compelling choice due to its operational strength and financial stability. However, if you seek growth fueled by innovation and can tolerate elevated risk, AMBA offers superior upside potential through its strategic R&D investments. Both scenarios demand careful monitoring of valuation and execution risks.
Disclaimer: Investment carries a risk of loss of initial capital. The past performance is not a reliable indicator of future results. Be sure to understand risks before making an investment decision.
Go Further
I encourage you to read the complete analyses of Analog Devices, Inc. and Ambarella, Inc. to enhance your investment decisions: