Home > Comparison > Consumer Cyclical > AMZN vs WSM
The strategic rivalry between Amazon.com, Inc. and Williams-Sonoma, Inc. shapes the Consumer Cyclical sector’s evolution. Amazon dominates as a capital-intensive global specialty retailer with a diversified digital ecosystem, while Williams-Sonoma operates a high-margin, omni-channel specialty retail model focused on home products. This head-to-head contrasts scale and innovation against focused brand strength. This analysis will reveal which trajectory offers superior risk-adjusted returns for a diversified portfolio in today’s complex market environment.

Table of contents
Companies Overview
Amazon.com, Inc. and Williams-Sonoma, Inc. both dominate specialty retail but target vastly different consumer needs and experiences.
Amazon.com, Inc.: Global E-Commerce & Cloud Powerhouse
Amazon leads as a global specialty retailer with a vast ecosystem spanning online and physical stores. Its core revenue derives from product sales, third-party seller services, and the high-margin Amazon Web Services (AWS) cloud platform. In 2026, Amazon focuses on expanding AWS capabilities and strengthening its Prime membership to deepen customer engagement and drive recurring revenue.
Williams-Sonoma, Inc.: Premium Home Lifestyle Retailer
Williams-Sonoma excels in omni-channel specialty retail focused on home furnishings and kitchenware. It generates revenue through branded products sold online and in 544 stores worldwide, emphasizing premium customer experience. For 2026, the company prioritizes expanding its digital footprint and leveraging augmented reality to enhance product visualization and customer engagement.
Strategic Collision: Similarities & Divergences
Both companies operate in specialty retail but diverge sharply in strategy. Amazon builds a closed ecosystem integrating e-commerce and cloud services, while Williams-Sonoma offers a curated, tactile shopping experience with an open product portfolio. They primarily compete for discretionary consumer spending, yet their investment profiles differ—Amazon’s scale and tech innovation contrast with Williams-Sonoma’s niche premium brand focus.
Income Statement Comparison
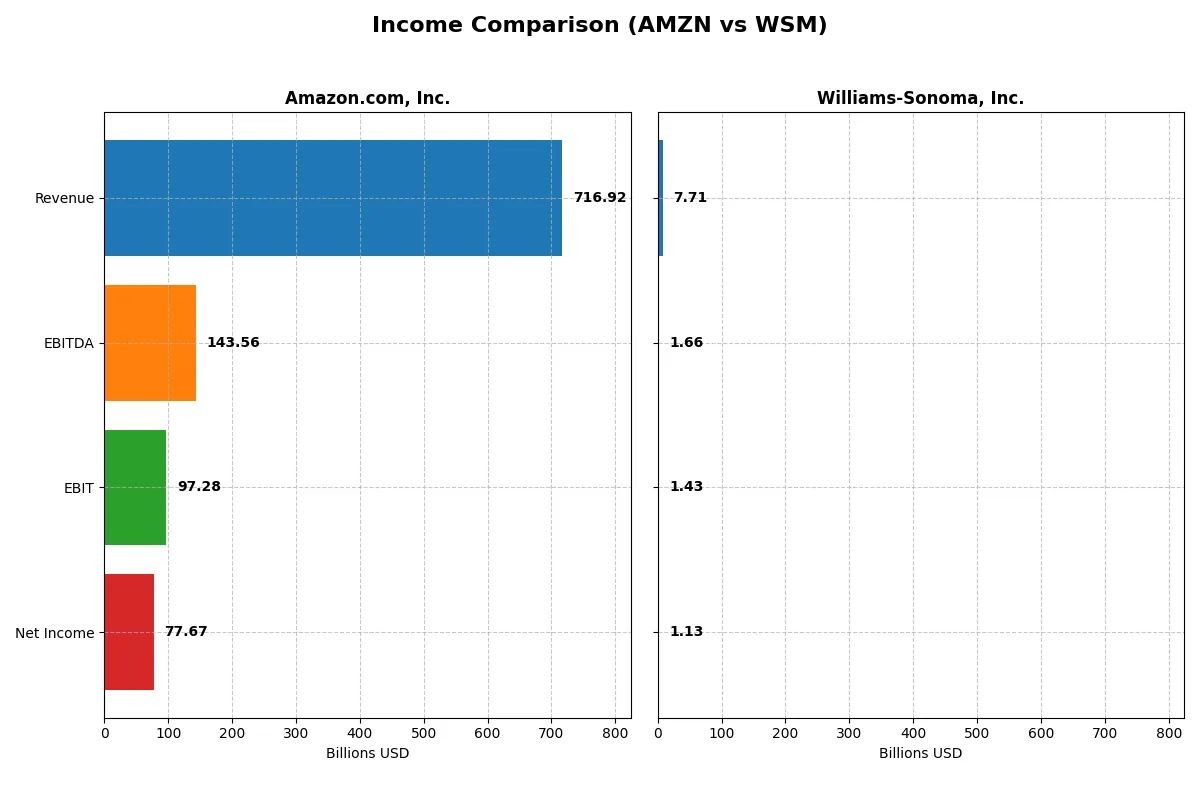
This data dissects the core profitability and scalability of both corporate engines to reveal who dominates the bottom line:
| Metric | Amazon.com, Inc. (AMZN) | Williams-Sonoma, Inc. (WSM) |
|---|---|---|
| Revenue | 717B | 7.7B |
| Cost of Revenue | 356B | 4.1B |
| Operating Expenses | 281B | 2.2B |
| Gross Profit | 361B | 3.6B |
| EBITDA | 144B | 1.7B |
| EBIT | 97.3B | 1.4B |
| Interest Expense | 2.3B | 0 |
| Net Income | 77.7B | 1.1B |
| EPS | 7.29 | 8.91 |
| Fiscal Year | 2025 | 2024 |
Income Statement Analysis: The Bottom-Line Duel
This income statement comparison reveals the true efficiency and profitability trajectory of Amazon.com, Inc. and Williams-Sonoma, Inc.
Amazon.com, Inc. Analysis
Amazon’s revenue surged from 470B in 2021 to 717B in 2025, reflecting robust growth. Net income jumped impressively, from 33B in 2021 to 77.7B in 2025, more than doubling. Gross margin consistently held above 50%, and net margin improved to 10.8%, signaling strong operational leverage and margin expansion in the latest year.
Williams-Sonoma, Inc. Analysis
Williams-Sonoma’s revenue rose steadily from 6.8B in 2020 to 7.7B in 2024 but showed slight contraction in the latest year. Net income rose from 681M in 2020 to 1.13B in 2024, with net margin at a healthy 14.6%. The company improved EBIT margin to 18.5%, reflecting disciplined cost control and solid profitability despite modest revenue pressure.
Verdict: Scale and Growth vs. Margin Discipline
Amazon dominates with massive scale and exceptional revenue and net income growth, doubling profits in five years. Williams-Sonoma delivers stronger margin percentages and steady profit gains but lacks Amazon’s explosive top-line momentum. Investors seeking aggressive expansion may prefer Amazon’s profile, while those favoring stable margins and consistent profits may lean toward Williams-Sonoma.
Financial Ratios Comparison
These vital ratios act as a diagnostic tool to expose the underlying fiscal health, valuation premiums, and capital efficiency of the companies analyzed:
| Ratios | Amazon.com, Inc. (AMZN) | Williams-Sonoma, Inc. (WSM) |
|---|---|---|
| ROE | 18.9% | 52.5% |
| ROIC | 10.7% | 29.9% |
| P/E | 31.8 | 23.7 |
| P/B | 6.0 | 12.5 |
| Current Ratio | 1.05 | 1.44 |
| Quick Ratio | 0.88 | 0.74 |
| D/E (Debt-to-Equity) | 0.37 | 0.63 |
| Debt-to-Assets | 18.7% | 25.4% |
| Interest Coverage | 35.2 | N/A |
| Asset Turnover | 0.88 | 1.45 |
| Fixed Asset Turnover | 2.01 | 3.49 |
| Payout Ratio | 0% | 24.9% |
| Dividend Yield | 0% | 1.05% |
| Fiscal Year | 2025 | 2024 |
Efficiency & Valuation Duel: The Vital Signs
Ratios serve as a company’s DNA, revealing hidden risks and operational excellence that raw numbers alone cannot expose.
Amazon.com, Inc.
Amazon posts a solid 18.9% ROE and 10.8% net margin, signaling reliable profitability. Its P/E of 31.8 marks the stock as relatively expensive compared to sector norms. Amazon does not pay dividends but reinvests heavily in R&D, fueling innovation and long-term growth potential despite stretched valuation metrics.
Williams-Sonoma, Inc.
Williams-Sonoma boasts a remarkable 52.5% ROE and a 14.6% net margin, showcasing superior operational efficiency. Its P/E at 23.7 appears more reasonable, though the P/B ratio at 12.5 flags valuation risk. The company balances shareholder returns with a modest 1.05% dividend yield and steady cash flow generation.
Premium Valuation vs. Operational Excellence
Williams-Sonoma delivers superior profitability and operational efficiency at a more attractive P/E ratio but with a higher P/B risk. Amazon’s innovation-driven reinvestment comes with a pricier valuation and no dividend cushion. Growth-focused investors may lean Amazon, while income and efficiency seekers might prefer Williams-Sonoma.
Which one offers the Superior Shareholder Reward?
Amazon.com, Inc. (AMZN) opts for zero dividends but reinvests heavily in growth, yielding minimal free cash flow per share (~0.7 in 2025). Williams-Sonoma, Inc. (WSM) pays a steady dividend (~1.05% yield) with a sustainable 25% payout ratio and robust free cash flow (~9B). WSM also executes significant buybacks, enhancing shareholder value. AMZN’s reinvestment suits growth investors, but WSM’s balanced dividends and buybacks offer a superior, more reliable total return profile for 2026 investors. I favor Williams-Sonoma for its consistent income and capital return strategy.
Comparative Score Analysis: The Strategic Profile
The radar chart reveals the fundamental DNA and trade-offs of Amazon.com, Inc. and Williams-Sonoma, Inc. across key financial metrics:
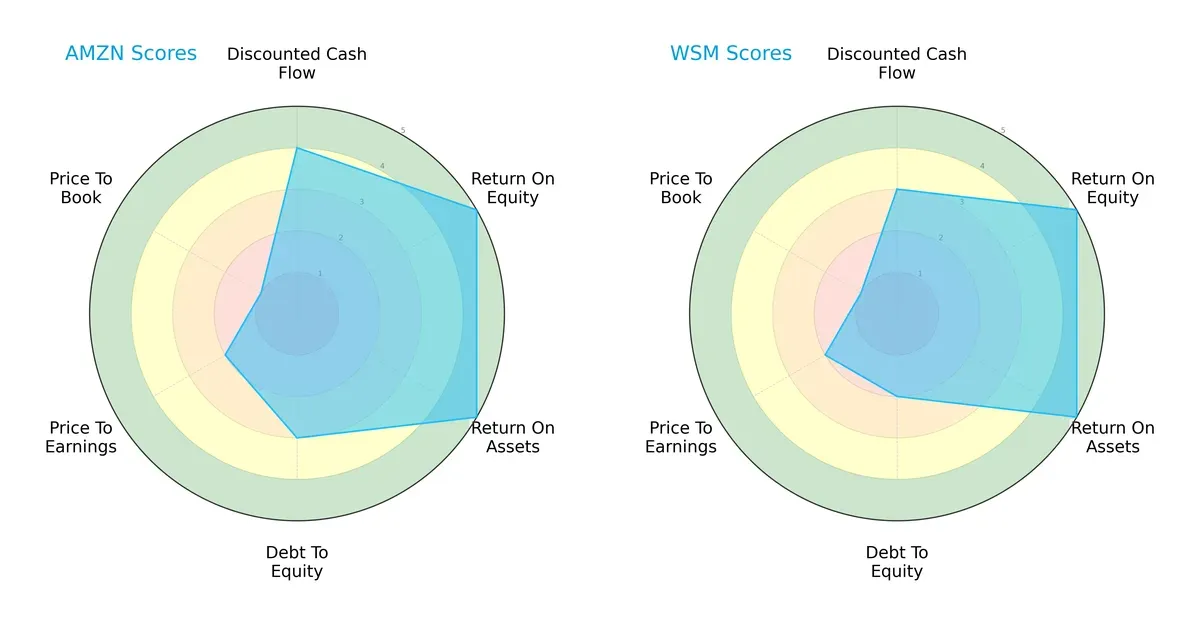
Amazon shows a more balanced profile with strong DCF (4) and profitability scores (ROE 5, ROA 5), but moderate debt control (3) and weak valuation scores (PE 2, PB 1). Williams-Sonoma matches Amazon’s profitability but carries higher financial risk with a weaker debt-to-equity score (2) and similar valuation challenges. Amazon leans on diversified strengths; Williams-Sonoma relies more heavily on operational efficiency.
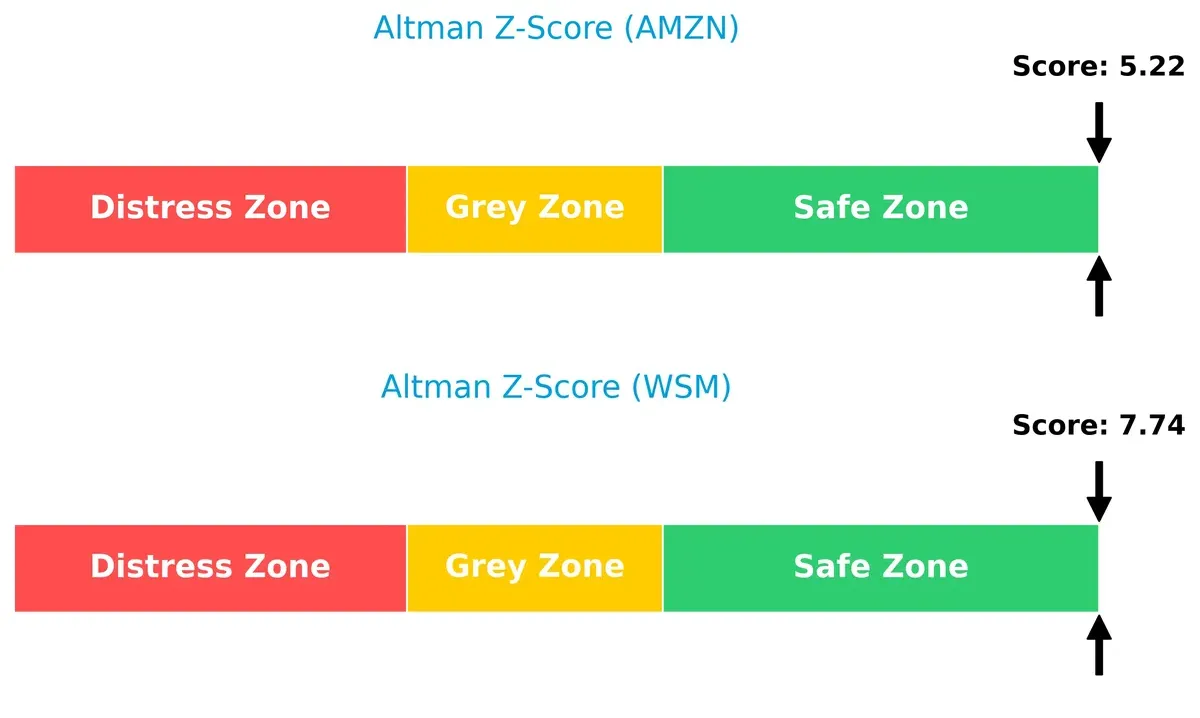
Bankruptcy Risk: Solvency Showdown
Amazon’s Altman Z-Score of 5.22 versus Williams-Sonoma’s 7.74 signals both firms are in the safe zone, but Williams-Sonoma exhibits greater insolvency resilience in this cycle:
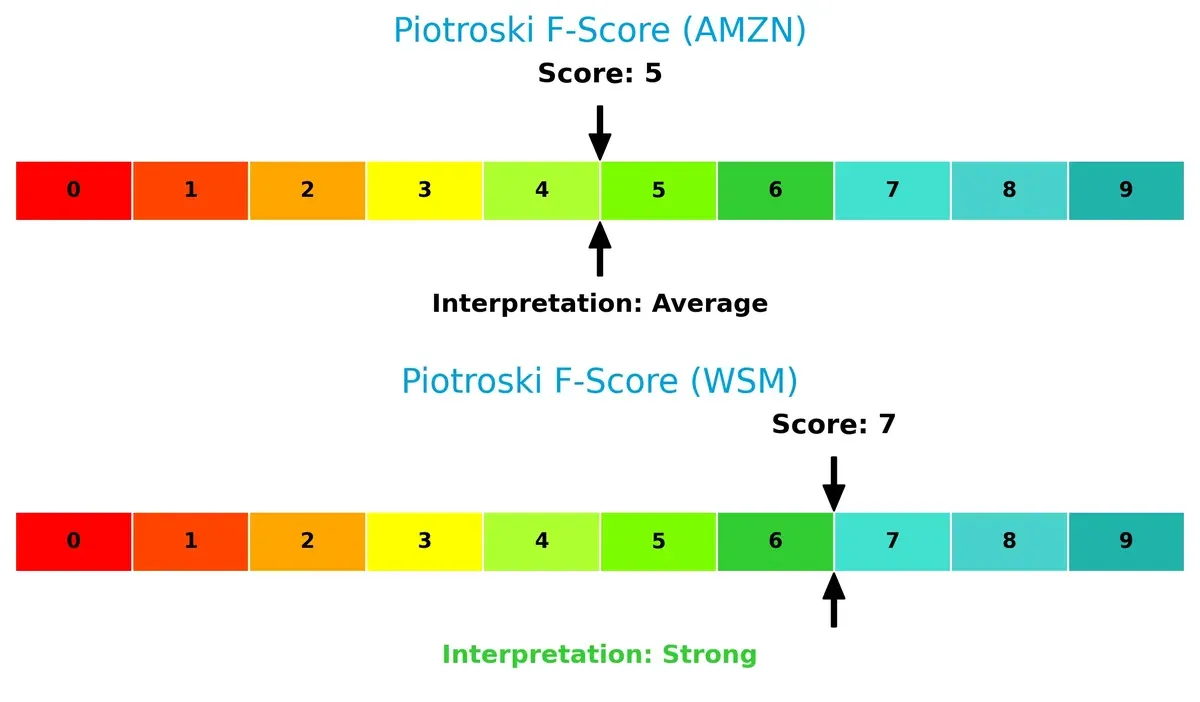
Financial Health: Quality of Operations
Williams-Sonoma’s Piotroski F-Score of 7 surpasses Amazon’s 5, indicating stronger financial health and fewer internal red flags in operational metrics:
How are the two companies positioned?
This section dissects the operational DNA of Amazon and Williams-Sonoma by comparing their revenue distribution and internal dynamics. The goal is to confront their economic moats to reveal which model offers a more resilient competitive advantage today.
Revenue Segmentation: The Strategic Mix
This comparison dissects how Amazon.com, Inc. and Williams-Sonoma, Inc. diversify their income streams and highlights their primary sector bets:
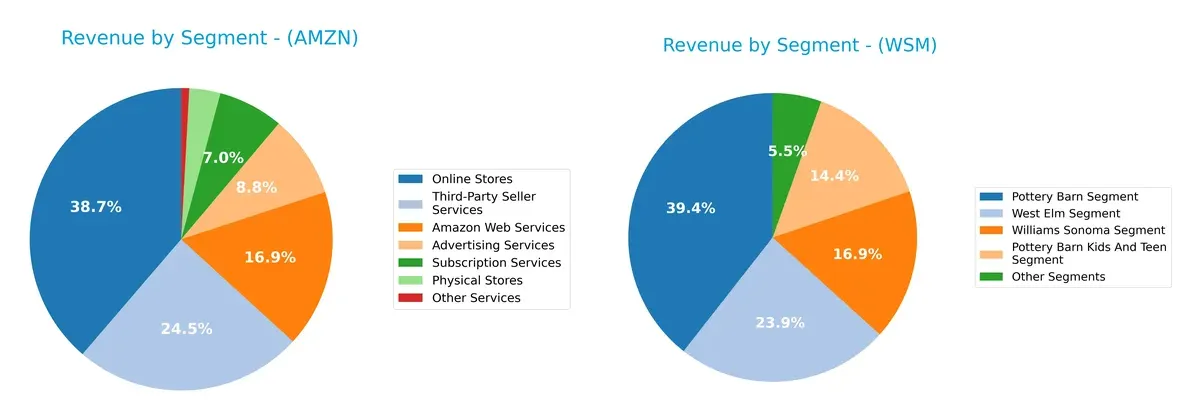
Amazon anchors its revenue in Online Stores ($247B) and Third-Party Seller Services ($156B), with significant contributions from AWS ($108B) and Advertising ($56B). Williams-Sonoma displays a more balanced mix among Pottery Barn ($3B), West Elm ($1.8B), and Williams Sonoma segments ($1.3B). Amazon’s concentration in e-commerce and cloud services drives ecosystem lock-in, while Williams-Sonoma’s varied home furnishing brands reduce dependency on any single segment.
Strengths and Weaknesses Comparison
This table compares the Strengths and Weaknesses of Amazon.com, Inc. and Williams-Sonoma, Inc.:
Amazon.com, Inc. Strengths
- Highly diversified revenue streams across multiple segments
- Strong global presence with significant sales in North America and Europe
- Favorable profitability metrics including net margin and ROIC
- Conservative leverage with low debt-to-assets and strong interest coverage
- Large market share in cloud services via AWS
Williams-Sonoma, Inc. Strengths
- High profitability with exceptional ROE and ROIC metrics
- Strong asset efficiency with above-average asset turnover
- Favorable leverage management with solid interest coverage
- Strong market position in home furnishings segments
- Consistent revenue growth in multiple brand segments
Amazon.com, Inc. Weaknesses
- Elevated valuation multiples with unfavorable P/E and P/B ratios
- Low dividend yield provides no income to investors
- Neutral liquidity ratios may limit short-term flexibility
- Asset turnover is only average for retail sector
Williams-Sonoma, Inc. Weaknesses
- Unfavorable WACC indicating higher capital costs
- Elevated P/B ratio may signal overvaluation
- Quick ratio below 1 suggests weaker liquidity
- Moderate debt-to-equity ratio could increase financial risk
Amazon shows a robust global footprint and diversified business model, supporting steady profitability despite some valuation concerns. Williams-Sonoma excels in profitability and asset efficiency but faces higher capital costs and liquidity constraints. These factors reflect contrasting strategic priorities and risk profiles.
The Moat Duel: Analyzing Competitive Defensibility
A structural moat is the only barrier safeguarding long-term profits from relentless competition erosion. Let’s dissect the competitive moats of Amazon and Williams-Sonoma:
Amazon.com, Inc.: Scale-Driven Network Effects
Amazon’s primary moat is its expansive network effects and ecosystem scale, reflected in its massive $2.25T market cap and growing ROIC trend. Despite a ROIC slightly below WACC, its AWS segment and global reach could deepen this advantage by 2026.
Williams-Sonoma, Inc.: Premium Brand & Operational Efficiency
Williams-Sonoma’s moat lies in its strong brand loyalty and operational efficiency, evidenced by an ROIC far exceeding WACC by nearly 19%. Its focused specialty retail niche supports margin expansion and sustained value creation, with room to grow through digital innovation.
Verdict: Scale Network Effects vs. Brand Premium Efficiency
Williams-Sonoma boasts a deeper moat with ROIC significantly above WACC, signaling robust value creation. Amazon’s scale offers broader reach but less immediate value protection. Williams-Sonoma is better poised to defend its market share amid competitive pressures.
Which stock offers better returns?
Over the past 12 months, Amazon and Williams-Sonoma exhibited strong price growth with divergent recent trading dynamics highlighting contrasting momentum shifts.
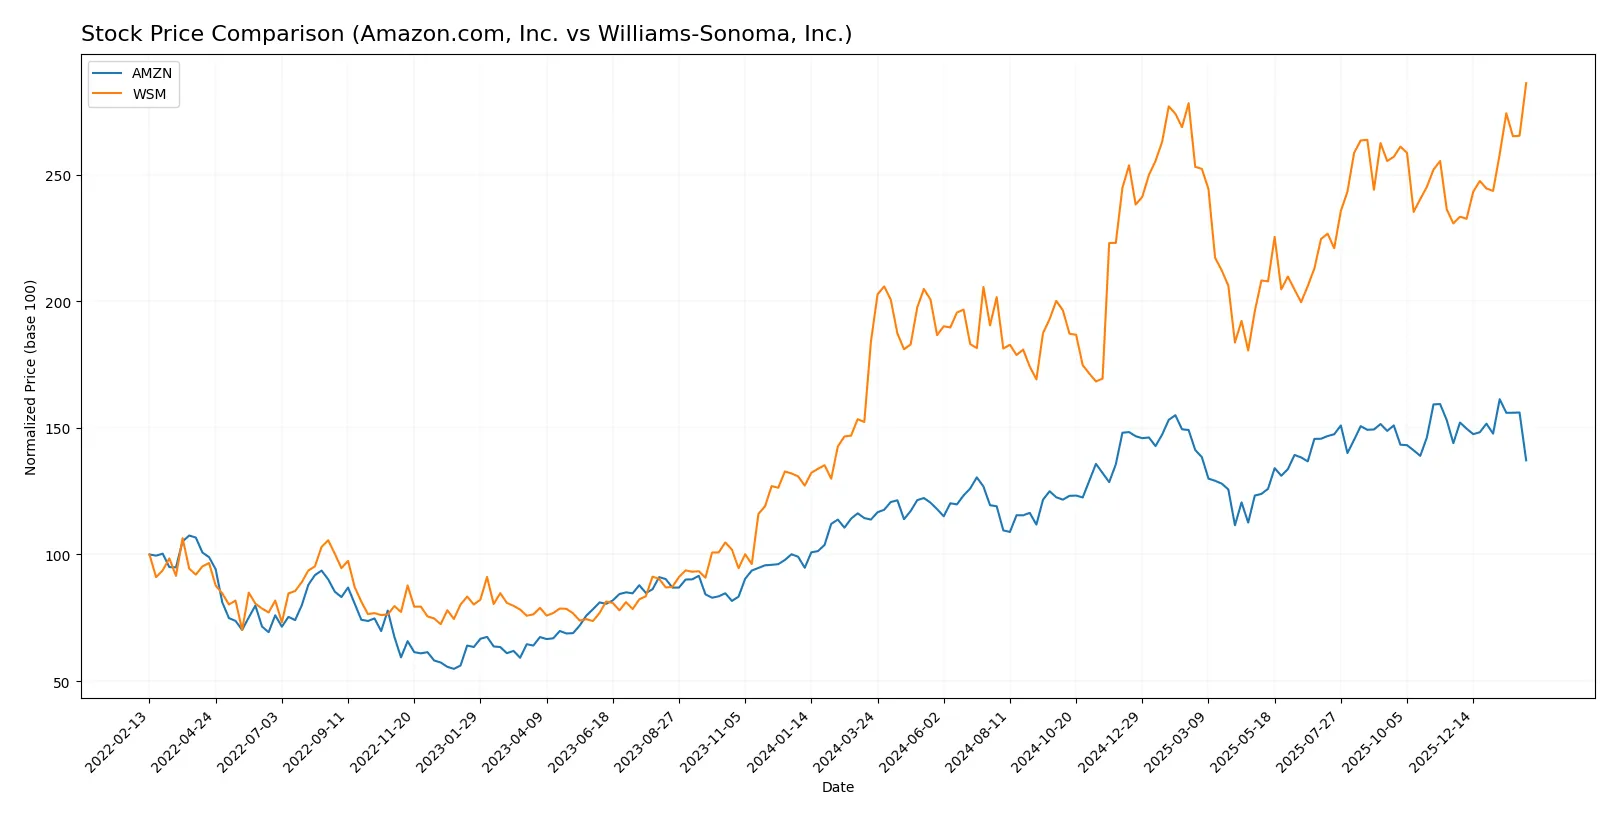
Trend Comparison
Amazon’s stock rose 20.58% over the past year, showing a bullish trend with decelerating momentum. The price ranged between 167 and 247, reflecting moderate volatility.
Williams-Sonoma gained 55.52% in the same period, accelerating its bullish trend. The stock’s price fluctuated between 130 and 221, accompanied by higher volatility than Amazon.
Williams-Sonoma outperformed Amazon with a stronger return and accelerating trend, delivering the highest market performance over the last 12 months.
Target Prices
Analysts present a balanced target price consensus for Amazon.com, Inc. and Williams-Sonoma, Inc., reflecting cautious optimism.
| Company | Target Low | Target High | Consensus |
|---|---|---|---|
| Amazon.com, Inc. | 175 | 315 | 283.86 |
| Williams-Sonoma, Inc. | 175 | 230 | 206.6 |
Amazon’s target consensus at $283.86 suggests upside from the current $210.32 price, indicating room for growth. Williams-Sonoma’s $206.6 consensus aligns closely with its $220.67 price, signaling moderate appreciation potential.

Don’t Let Luck Decide Your Entry Point
Optimize your entry points with our advanced ProRealTime indicators. You’ll get efficient buy signals with precise price targets for maximum performance. Start outperforming now!
How do institutions grade them?
The following tables summarize recent grades from leading financial institutions for both companies:
Amazon.com, Inc. Grades
This table shows current grades from reputable firms covering Amazon.com, Inc.:
| Grading Company | Action | New Grade | Date |
|---|---|---|---|
| BMO Capital | Maintain | Outperform | 2026-02-06 |
| Oppenheimer | Maintain | Outperform | 2026-02-06 |
| Wedbush | Maintain | Outperform | 2026-02-06 |
| Evercore ISI Group | Maintain | Outperform | 2026-02-06 |
| Argus Research | Maintain | Buy | 2026-02-06 |
| Telsey Advisory Group | Maintain | Outperform | 2026-02-06 |
| Piper Sandler | Maintain | Overweight | 2026-02-06 |
| Citizens | Maintain | Market Outperform | 2026-02-06 |
| RBC Capital | Maintain | Outperform | 2026-02-06 |
| Wells Fargo | Maintain | Overweight | 2026-02-06 |
Williams-Sonoma, Inc. Grades
This table lists recent grades from trusted analysts for Williams-Sonoma, Inc.:
| Grading Company | Action | New Grade | Date |
|---|---|---|---|
| Evercore ISI Group | Maintain | In Line | 2026-02-03 |
| Zelman & Assoc | Upgrade | Neutral | 2026-01-29 |
| TD Cowen | Maintain | Buy | 2026-01-20 |
| Evercore ISI Group | Maintain | In Line | 2025-12-23 |
| RBC Capital | Maintain | Outperform | 2025-11-21 |
| UBS | Maintain | Neutral | 2025-11-20 |
| TD Cowen | Maintain | Buy | 2025-11-20 |
| Telsey Advisory Group | Maintain | Outperform | 2025-11-20 |
| Citigroup | Maintain | Neutral | 2025-11-20 |
| Telsey Advisory Group | Maintain | Outperform | 2025-11-19 |
Which company has the best grades?
Amazon.com, Inc. consistently earns top-tier grades like “Outperform” and “Buy” from multiple reputable firms. Williams-Sonoma, Inc. shows more mixed ratings, including “In Line” and “Neutral,” with fewer “Buy” or “Outperform” endorsements. This suggests investors may view Amazon as the stronger growth candidate, while Williams-Sonoma carries more moderate expectations.
Risks specific to each company
The following categories identify critical pressure points and systemic threats facing both firms in the 2026 market environment:
1. Market & Competition
Amazon.com, Inc.
- Dominates e-commerce and cloud markets but faces intense tech and retail competition.
Williams-Sonoma, Inc.
- Strong niche in specialty home retail but competes with larger omnichannel retailers and online platforms.
2. Capital Structure & Debt
Amazon.com, Inc.
- Low debt-to-equity at 0.37 signals prudent leverage. Interest coverage very strong at 42.78x.
Williams-Sonoma, Inc.
- Higher debt-to-equity ratio at 0.63 raises moderate risk; interest coverage infinite, indicating solid ability to service debt.
3. Stock Volatility
Amazon.com, Inc.
- Beta of 1.39 suggests above-market volatility, increasing trading risk.
Williams-Sonoma, Inc.
- Beta of 1.64 indicates higher risk and susceptibility to market swings than Amazon.
4. Regulatory & Legal
Amazon.com, Inc.
- Faces regulatory scrutiny in antitrust and data privacy globally, a persistent risk.
Williams-Sonoma, Inc.
- Regulatory exposure limited mostly to retail standards; lower systemic regulatory pressure.
5. Supply Chain & Operations
Amazon.com, Inc.
- Complex global supply chain vulnerable to disruptions, yet benefits from scale and logistics expertise.
Williams-Sonoma, Inc.
- More concentrated supply chain with some exposure to international markets; less diversified than Amazon’s.
6. ESG & Climate Transition
Amazon.com, Inc.
- High scrutiny on carbon footprint and labor practices; substantial investments in sustainable initiatives ongoing.
Williams-Sonoma, Inc.
- Moderate ESG risks; focuses on sustainable products and corporate responsibility but with fewer resources.
7. Geopolitical Exposure
Amazon.com, Inc.
- Significant international operations expose it to geopolitical tensions and trade policy risks.
Williams-Sonoma, Inc.
- Limited geographic diversification reduces geopolitical risk but also limits growth opportunities abroad.
Which company shows a better risk-adjusted profile?
Amazon’s largest risk is regulatory and geopolitical exposure, amplified by its scale and global footprint. Williams-Sonoma’s most impactful risk lies in its higher leverage and stock volatility. Despite Amazon’s complex risks, its strong capital structure and diversified operations provide a more balanced risk-adjusted profile. Williams-Sonoma’s higher beta and debt ratio heighten its vulnerability, despite superior profitability metrics. The recent surge in Amazon’s regulatory challenges justifies heightened caution, whereas Williams-Sonoma’s debt profile demands monitoring amid economic uncertainty.
Final Verdict: Which stock to choose?
Amazon’s superpower lies in its unmatched scale and innovation engine, driving consistent revenue growth and expanding profitability. Its key point of vigilance is the stretched valuation multiples, which may pressure returns if growth slows. Amazon suits portfolios aiming for long-term aggressive growth fueled by market leadership and reinvestment capacity.
Williams-Sonoma boasts a robust moat with exceptional capital efficiency and strong returns on invested capital well above its cost of capital. Its conservative balance sheet and stable free cash flow profile offer a safer harbor compared to Amazon’s higher volatility. This stock fits well in GARP portfolios seeking quality growth anchored by durable profitability.
If you prioritize aggressive expansion and market dominance, Amazon is the compelling choice due to its innovation scale and growth momentum. However, if you seek better stability with strong capital returns and a proven economic moat, Williams-Sonoma offers superior risk-adjusted performance. Both present slightly favorable profiles but cater to distinct investor appetites.
Disclaimer: Investment carries a risk of loss of initial capital. The past performance is not a reliable indicator of future results. Be sure to understand risks before making an investment decision.
Go Further
I encourage you to read the complete analyses of Amazon.com, Inc. and Williams-Sonoma, Inc. to enhance your investment decisions: