Home > Comparison > Consumer Cyclical > AMZN vs ULTA
The strategic rivalry between Amazon.com, Inc. and Ulta Beauty, Inc. shapes the specialty retail sector’s evolution. Amazon operates as a capital-intensive global e-commerce and cloud services powerhouse. Ulta Beauty excels as a high-margin, specialty beauty retailer focused on physical stores and branded products across the U.S. This analysis pits Amazon’s scale and diversification against Ulta’s niche market strength to identify the superior risk-adjusted investment for a diversified portfolio in 2026.

Table of contents
Companies Overview
Amazon.com, Inc. and Ulta Beauty, Inc. stand as pivotal players within the specialty retail sector, shaping consumer experiences nationwide.
Amazon.com, Inc.: E-Commerce and Cloud Powerhouse
Amazon dominates the specialty retail market by combining online and physical stores with a diverse product mix. Its core revenue stems from direct sales, third-party seller programs, and Amazon Web Services (AWS), which drives high-margin cloud revenue. In 2026, the company emphasizes expanding AWS capabilities alongside enhancing Prime membership value to sustain its competitive edge.
Ulta Beauty, Inc.: Premier Beauty Retailer
Ulta Beauty commands the U.S. beauty market through its extensive network of 1,308 retail stores and a growing e-commerce platform. The company’s revenue hinges on sales of cosmetics, skincare, salon services, and proprietary brands. Its 2026 strategy focuses on blending in-store experiences with digital innovation to deepen customer engagement and broaden market penetration.
Strategic Collision: Similarities & Divergences
Both companies excel in specialty retail but diverge in scope—Amazon pursues a broad ecosystem spanning retail and cloud services, while Ulta targets a focused beauty niche with experiential retail. Their primary battleground lies in omnichannel customer engagement, where Amazon’s scale contrasts with Ulta’s curated brand loyalty. These distinctions define their unique investment profiles: Amazon as a tech-driven growth leader, Ulta as a specialty retailer with strong consumer brand affinity.
Income Statement Comparison
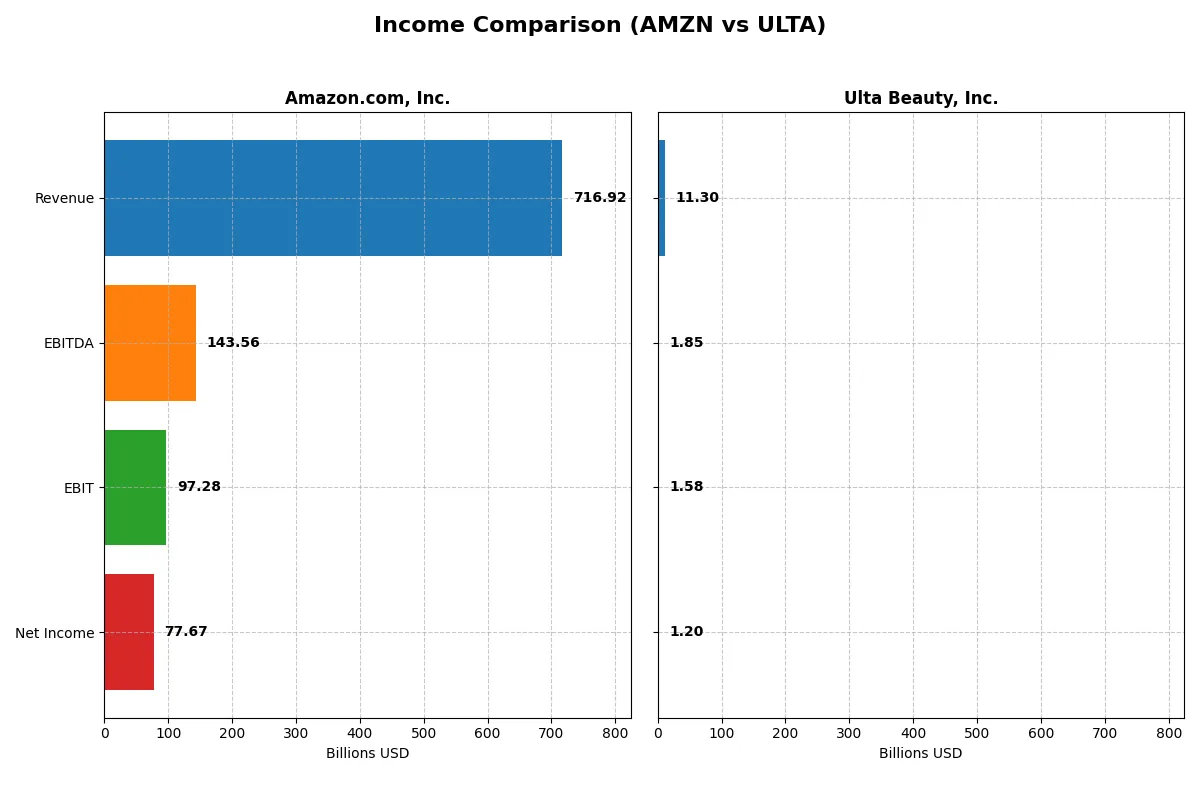
This data dissects the core profitability and scalability of both corporate engines to reveal who dominates the bottom line:
| Metric | Amazon.com, Inc. (AMZN) | Ulta Beauty, Inc. (ULTA) |
|---|---|---|
| Revenue | 717B | 11.3B |
| Cost of Revenue | 356B | 6.9B |
| Operating Expenses | 281B | 2.8B |
| Gross Profit | 361B | 4.4B |
| EBITDA | 144B | 1.8B |
| EBIT | 97.3B | 1.6B |
| Interest Expense | 2.3B | 0 |
| Net Income | 77.7B | 1.2B |
| EPS | 7.29 | 25.44 |
| Fiscal Year | 2025 | 2024 |
Income Statement Analysis: The Bottom-Line Duel
The income statement comparison reveals which company runs its corporate engine with superior efficiency and sustainable profit power.
Amazon.com, Inc. Analysis
Amazon’s revenue surged 12.4% in 2025 to $717B, with net income climbing 31% to $77.7B. Its gross margin stands strong at 50.3%, reflecting robust cost control. The net margin of 10.8% confirms healthy bottom-line conversion. Operating income jumped 36.9%, signaling accelerating efficiency and profit momentum.
Ulta Beauty, Inc. Analysis
Ulta’s revenue grew modestly by 0.8% to $11.3B in 2024, while net income slipped 7.7% to $1.2B. Its gross margin at 38.8% is solid but notably lower than Amazon’s. Despite an EBIT margin of 14.0%, the recent decline in profitability and EPS signals headwinds in operational leverage and growth pacing.
Margin Power vs. Revenue Scale
Amazon’s dominant revenue scale and improving margins decisively outpace Ulta’s slower topline growth and shrinking profits. Amazon’s ability to expand net income by over 30% in a single year contrasts with Ulta’s contraction. Investors seeking robust, scalable profitability lean toward Amazon’s profile, while Ulta’s slower momentum may appeal to those favoring niche specialty growth.
Financial Ratios Comparison
These vital ratios act as a diagnostic tool to expose the underlying fiscal health, valuation premiums, and capital efficiency of the companies compared below:
| Ratios | Amazon.com, Inc. (AMZN) | Ulta Beauty, Inc. (ULTA) |
|---|---|---|
| ROE | 18.9% | 48.3% |
| ROIC | 10.7% | 26.6% |
| P/E | 31.8 | 16.2 |
| P/B | 6.0 | 7.8 |
| Current Ratio | 1.05 | 1.70 |
| Quick Ratio | 0.88 | 0.60 |
| D/E | 0.37 | 0.77 |
| Debt-to-Assets | 18.7% | 32.0% |
| Interest Coverage | 35.2 | 0 (not reported) |
| Asset Turnover | 0.88 | 1.88 |
| Fixed Asset Turnover | 2.01 | 3.96 |
| Payout ratio | 0 | 0 |
| Dividend yield | 0 | 0 |
| Fiscal Year | 2025 | 2024 |
Efficiency & Valuation Duel: The Vital Signs
Ratios act as a company’s DNA, uncovering hidden risks and revealing operational strengths beyond surface-level figures.
Amazon.com, Inc.
Amazon delivers solid profitability with an 18.9% ROE and a 10.8% net margin, signaling operational efficiency. Yet, its P/E at 31.8 and P/B at 6.0 suggest the stock trades at a premium. Amazon reinvests heavily in R&D, reflecting growth ambitions rather than dividend payouts, which fits its long-term innovation strategy.
Ulta Beauty, Inc.
Ulta impresses with a robust 48.3% ROE and a 10.6% net margin, demonstrating exceptional capital efficiency. Its P/E ratio of 16.2 is moderate, while a high P/B of 7.8 signals some valuation tension. Ulta offers no dividend but supports shareholder value through strong free cash flow and reinvestment into its retail expansion and brand development.
Premium Valuation vs. Operational Efficiency
Amazon trades at a higher valuation multiple, reflecting growth expectations, while Ulta boasts superior returns on equity and invested capital. Ulta’s metrics indicate better operational efficiency at a fairer price. Investors seeking growth with efficient capital use may prefer Ulta’s profile, whereas Amazon fits those prioritizing scale and innovation reinvestment.
Which one offers the Superior Shareholder Reward?
I observe Amazon.com, Inc. (AMZN) and Ulta Beauty, Inc. (ULTA) both forgo dividends, focusing on reinvestment and buybacks. AMZN’s dividend yield is 0%, with a very low free cash flow per share of $0.7, limiting buyback capacity. ULTA boasts a robust free cash flow of $20.4 per share and a price-to-free-cash-flow ratio near 20, signaling strong buyback potential. ULTA’s payout relies heavily on buybacks supported by consistent cash generation and solid operating margins (~14%), unlike AMZN’s thin free cash flow margin (<1%). Historically, ULTA’s leaner capital expenditure coverage and higher operating cash flow coverage ratio (~3.6 vs. AMZN’s ~1.06) suggest a more sustainable and shareholder-friendly distribution model in 2026. I judge ULTA offers the superior total shareholder return profile, balancing growth reinvestment with aggressive buybacks, while AMZN’s reinvestment strategy remains constrained by limited free cash flow yield.
Comparative Score Analysis: The Strategic Profile
The radar chart reveals the fundamental DNA and trade-offs of Amazon.com, Inc. and Ulta Beauty, Inc., highlighting operational efficiency, financial risk, and valuation balance:
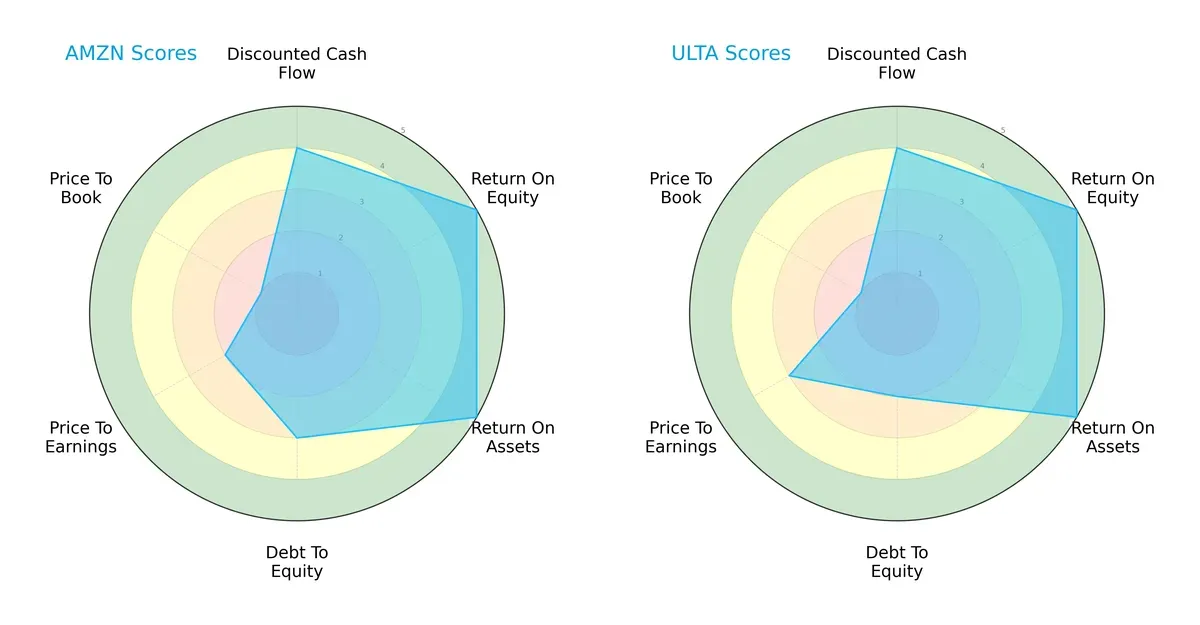
Both companies exhibit strong operational metrics with ROE and ROA scores at 5, reflecting excellent asset and equity utilization. Amazon shows a moderate debt-to-equity score of 3, indicating balanced leverage, while Ulta scores lower at 2, signaling a more conservative capital structure. Valuation metrics diverge: Amazon’s lower P/E score (2) suggests less favorable earnings pricing compared to Ulta’s moderate 3, yet both share a very unfavorable P/B score of 1, hinting at potential overvaluation risks. Overall, Amazon presents a more balanced financial profile, whereas Ulta leans on its conservative leverage as a competitive edge.
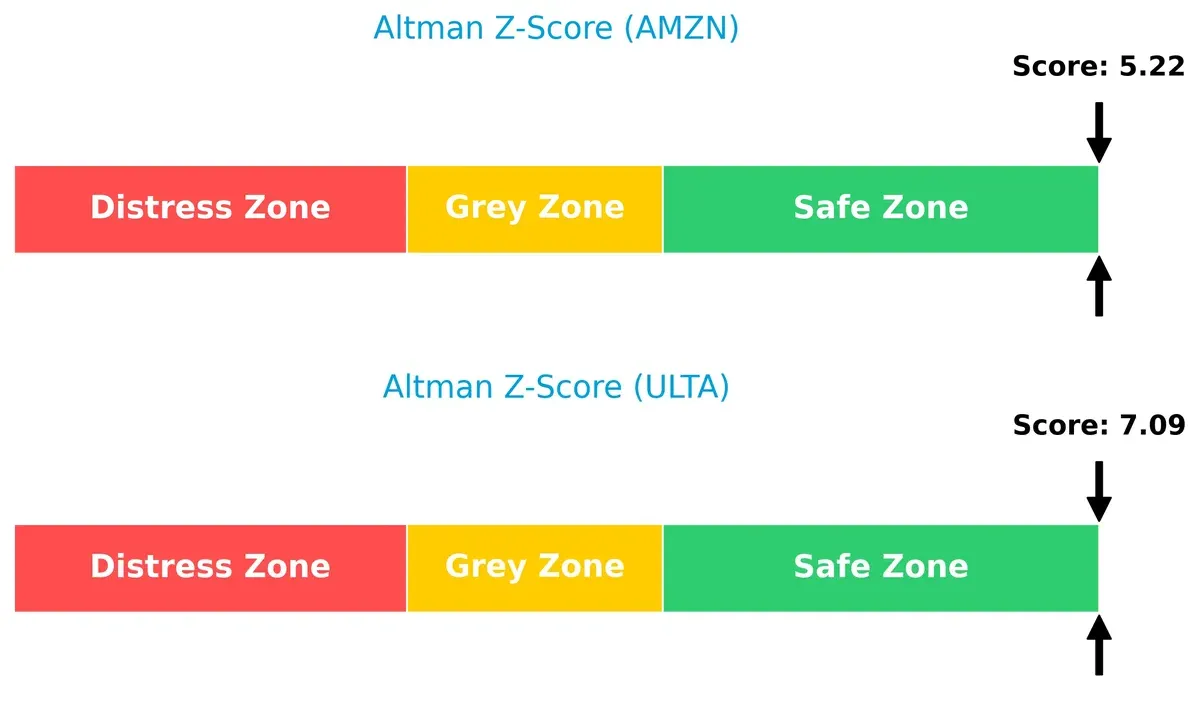
Bankruptcy Risk: Solvency Showdown
Amazon’s Altman Z-Score of 5.22 trails behind Ulta’s safer 7.09, both firmly in the safe zone, implying robust solvency and low bankruptcy risk in this economic cycle:
Financial Health: Quality of Operations
Ulta edges out Amazon with a Piotroski F-Score of 6 versus 5, reflecting slightly stronger internal financial health and fewer operational red flags:

How are the two companies positioned?
This section dissects the operational DNA of Amazon and Ulta by comparing their revenue distribution by segment and internal dynamics. The goal is to confront their economic moats and identify which model offers the most resilient, sustainable competitive advantage today.
Revenue Segmentation: The Strategic Mix
This comparison dissects how Amazon.com, Inc. and Ulta Beauty, Inc. diversify their income streams and reveals their primary sector bets:
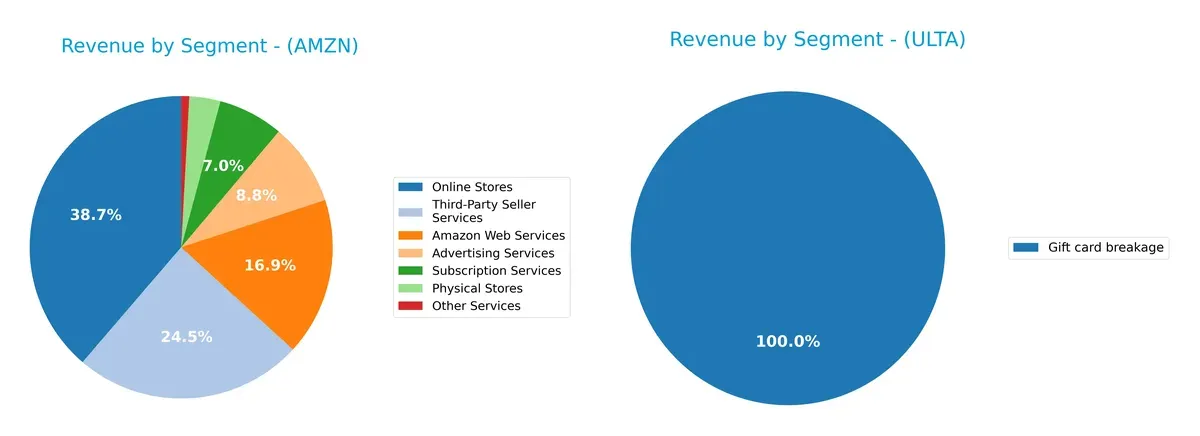
Amazon.com, Inc. dwarfs Ulta with a broad revenue base, including Online Stores at $247B, AWS at $108B, and Third-Party Seller Services at $156B. Ulta Beauty relies heavily on Gift Card Breakage at just $24M, showing limited diversification. Amazon’s multi-segment dominance anchors its ecosystem lock-in, while Ulta’s narrow focus signals concentration risk amid evolving retail trends.
Strengths and Weaknesses Comparison
This table compares the strengths and weaknesses of Amazon.com, Inc. and Ulta Beauty, Inc.:
Amazon.com, Inc. Strengths
- Diverse revenue streams across AWS, online stores, advertising, and subscriptions
- Favorable net margin and ROE indicate solid profitability
- Low debt-to-assets ratio with strong interest coverage
- Significant global presence with large North America and international sales
- Strong market share in cloud and e-commerce sectors
Ulta Beauty, Inc. Strengths
- High ROE and ROIC show efficient capital use and strong profitability
- Favorable WACC supports value creation
- Strong current ratio indicates liquidity
- High asset turnover signals operational efficiency
- Favorable interest coverage with zero debt cost
Amazon.com, Inc. Weaknesses
- Elevated P/E and P/B ratios may signal overvaluation risk
- Neutral liquidity ratios present moderate short-term risk
- No dividend yield could deter income-focused investors
- Asset turnover remains neutral despite scale
Ulta Beauty, Inc. Weaknesses
- Unfavorable quick ratio suggests potential liquidity strain
- Higher P/B ratio than peers could indicate valuation concerns
- Debt-to-assets and D/E ratios at neutral levels imply moderate leverage risk
- No dividend yield limits income appeal
Amazon’s broad diversification and global scale underpin its strengths but valuation and liquidity metrics warrant caution. Ulta excels in profitability and operational efficiency but faces liquidity and leverage risks. Both companies show distinct profiles influencing strategic focus areas.
The Moat Duel: Analyzing Competitive Defensibility
A structural moat is the only lasting shield that protects profits from competitors’ relentless advances in any industry:
Amazon.com, Inc.: Scale and Ecosystem Network Moat
Amazon’s moat stems from its vast network effects and ecosystem. Its high gross margin (50%) and growing ROIC signal operational efficiency. Expansion in AWS and international markets could deepen this advantage in 2026.
Ulta Beauty, Inc.: Brand Loyalty and Customer Experience Moat
Ulta’s moat relies on strong brand loyalty and differentiated in-store experience, contrasting Amazon’s tech-driven scale. Its ROIC far exceeds WACC, reflecting superior capital allocation. Ulta’s potential lies in expanding salon services and private labels.
Network Effects vs. Brand Loyalty: The Moat Showdown
Amazon’s ecosystem moat is broad but still slightly value-dilutive as ROIC lags WACC. Ulta boasts a deeper moat with robust value creation and accelerating ROIC. I see Ulta better positioned to defend and grow its niche market share in 2026.
Which stock offers better returns?
The past year saw Amazon.com, Inc. rise steadily with a strong price gain, while Ulta Beauty, Inc. showed sharper growth and accelerating momentum in its stock price.
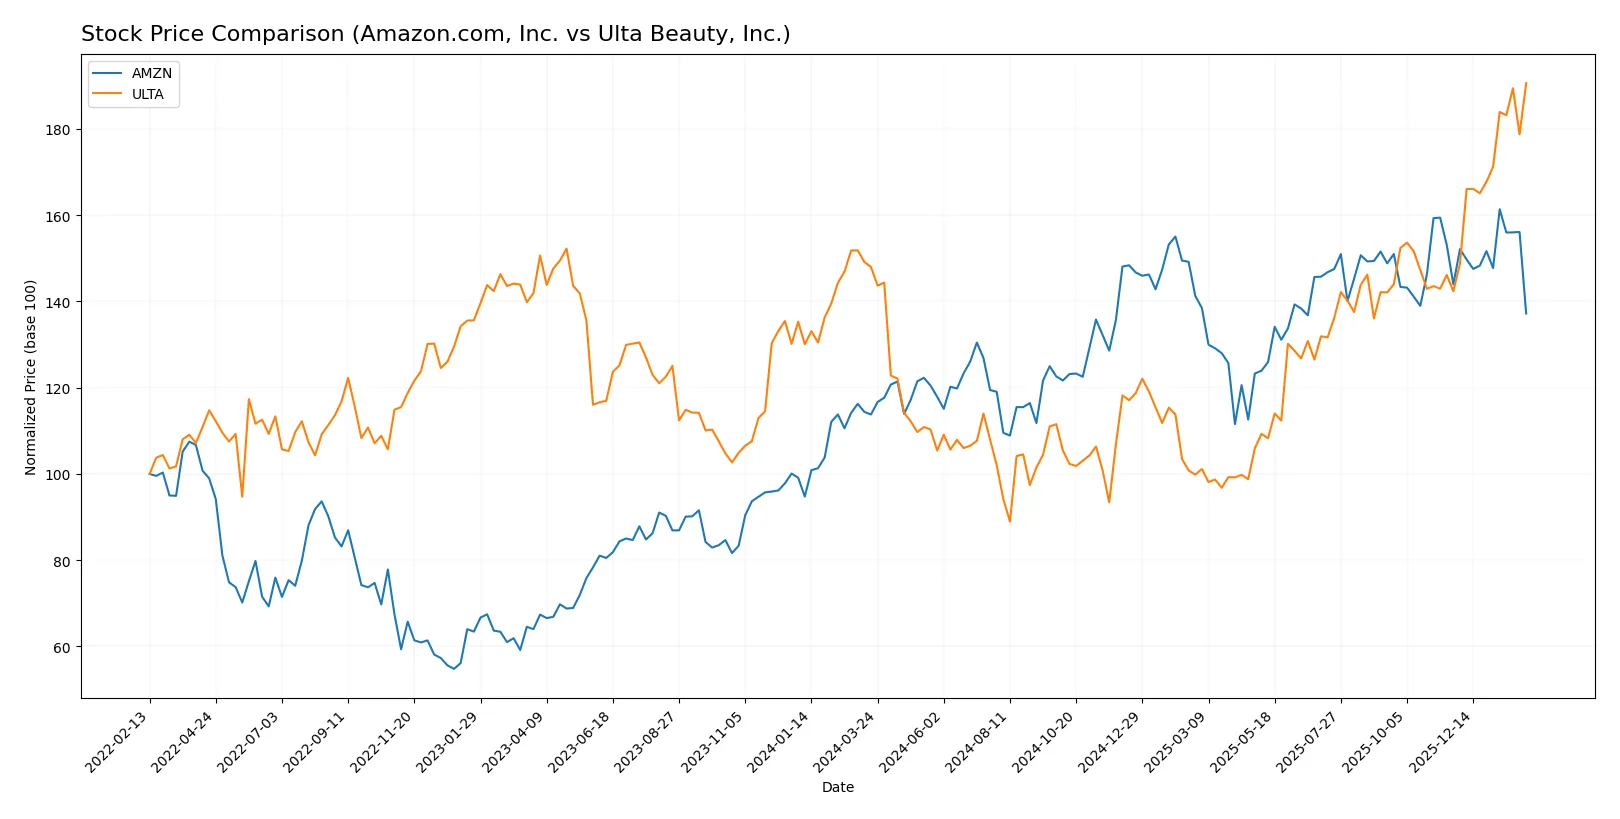
Trend Comparison
Amazon’s stock climbed 20.58% over the past year, marking a bullish trend with decelerating gains from a low of 167 to a high near 247. Volatility remains moderate with a 21.86 std deviation.
Ulta’s stock surged 28.81% over the same period, reflecting a bullish trend with accelerating strength. It ranged from 322 to 690, showing much higher volatility at 88.12 std deviation.
Ulta outperformed Amazon, delivering the highest market return and stronger upward momentum over the last 12 months.
Target Prices
Analysts present a broad but optimistic target range for Amazon.com, Inc. and Ulta Beauty, Inc.
| Company | Target Low | Target High | Consensus |
|---|---|---|---|
| Amazon.com, Inc. | 175 | 315 | 283.86 |
| Ulta Beauty, Inc. | 425 | 790 | 693.73 |
Amazon’s consensus target sits roughly 35% above its current 210 price, signaling upside potential amid sector volatility. Ulta trades near its consensus target, indicating market confidence but limited immediate gains.

Don’t Let Luck Decide Your Entry Point
Optimize your entry points with our advanced ProRealTime indicators. You’ll get efficient buy signals with precise price targets for maximum performance. Start outperforming now!
How do institutions grade them?
Amazon.com, Inc. Grades
Here are the latest grades issued by reputable financial institutions for Amazon.com, Inc.:
| Grading Company | Action | New Grade | Date |
|---|---|---|---|
| BMO Capital | Maintain | Outperform | 2026-02-06 |
| Oppenheimer | Maintain | Outperform | 2026-02-06 |
| Wedbush | Maintain | Outperform | 2026-02-06 |
| Evercore ISI Group | Maintain | Outperform | 2026-02-06 |
| Argus Research | Maintain | Buy | 2026-02-06 |
| Telsey Advisory Group | Maintain | Outperform | 2026-02-06 |
| Piper Sandler | Maintain | Overweight | 2026-02-06 |
| Citizens | Maintain | Market Outperform | 2026-02-06 |
| RBC Capital | Maintain | Outperform | 2026-02-06 |
| Wells Fargo | Maintain | Overweight | 2026-02-06 |
Ulta Beauty, Inc. Grades
Below are the recent institutional grades for Ulta Beauty, Inc. from established financial firms:
| Grading Company | Action | New Grade | Date |
|---|---|---|---|
| TD Cowen | Maintain | Buy | 2026-01-21 |
| Raymond James | Upgrade | Strong Buy | 2026-01-21 |
| Oppenheimer | Maintain | Outperform | 2026-01-20 |
| Morgan Stanley | Maintain | Overweight | 2026-01-15 |
| B of A Securities | Maintain | Neutral | 2026-01-08 |
| UBS | Maintain | Buy | 2026-01-07 |
| Argus Research | Maintain | Buy | 2026-01-02 |
| Oppenheimer | Maintain | Outperform | 2025-12-10 |
| TD Cowen | Upgrade | Buy | 2025-12-08 |
| Morgan Stanley | Maintain | Overweight | 2025-12-08 |
Which company has the best grades?
Ulta Beauty displays a slightly more bullish consensus with a “Strong Buy” upgrade and multiple “Buy” ratings. Amazon consistently earns “Outperform” and “Buy” ratings but no upgrades. Investors may view Ulta’s recent upgrades as a signal of growing confidence, while Amazon’s stable grades reflect steady institutional support.
Risks specific to each company
The following categories identify the critical pressure points and systemic threats facing both firms in the 2026 market environment:
1. Market & Competition
Amazon.com, Inc.
- Faces intense competition across e-commerce, cloud, and retail sectors, pressuring margins.
Ulta Beauty, Inc.
- Competes in a highly fragmented beauty retail market with strong direct-to-consumer brands emerging.
2. Capital Structure & Debt
Amazon.com, Inc.
- Maintains a conservative debt ratio (D/E 0.37) with strong interest coverage (43x).
Ulta Beauty, Inc.
- Higher leverage (D/E 0.77) increases financial risk despite favorable interest coverage.
3. Stock Volatility
Amazon.com, Inc.
- Beta 1.385 indicates higher sensitivity to market swings, increasing stock price volatility.
Ulta Beauty, Inc.
- Beta 0.832 suggests more stability and less correlation with overall market fluctuations.
4. Regulatory & Legal
Amazon.com, Inc.
- Subject to global antitrust scrutiny and data privacy regulations, adding compliance costs.
Ulta Beauty, Inc.
- Faces mainly U.S. regulatory risks, including consumer protection and labor law compliance.
5. Supply Chain & Operations
Amazon.com, Inc.
- Complex global logistics expose Amazon to disruptions and rising transportation costs.
Ulta Beauty, Inc.
- Relies on domestic suppliers with less exposure to global supply chain shocks.
6. ESG & Climate Transition
Amazon.com, Inc.
- Faces pressure to reduce carbon footprint across massive operations and data centers.
Ulta Beauty, Inc.
- Increasing focus on sustainable beauty products but smaller operational footprint limits impact.
7. Geopolitical Exposure
Amazon.com, Inc.
- Significant international presence exposes it to geopolitical tensions and trade restrictions.
Ulta Beauty, Inc.
- Primarily U.S.-focused, limiting direct geopolitical risks but vulnerable to domestic policy shifts.
Which company shows a better risk-adjusted profile?
Amazon’s largest risk centers on its broad market and regulatory challenges, demanding vigilant capital allocation and compliance. Ulta’s principal risk stems from its elevated leverage amid competitive pressures. Considering risk-adjusted metrics, Ulta’s lower stock volatility and stronger profitability ratios slightly outweigh Amazon’s scale risks, but Amazon’s robust balance sheet and global diversification provide a formidable buffer. Recent data highlight Amazon’s superior interest coverage (42.78x) versus Ulta’s leverage concerns, signaling prudent financial management amid complexity.
Final Verdict: Which stock to choose?
Amazon.com, Inc. wields unmatched scale and operational efficiency, driving consistent revenue and profit growth. Its vast ecosystem fuels innovation, but its slim current ratio signals a liquidity watchpoint. Amazon suits investors chasing aggressive growth with a tolerance for balance sheet tightness.
Ulta Beauty, Inc. commands a durable moat through strong brand loyalty and high returns on invested capital. It offers a safer profile than Amazon, backed by robust liquidity and steady profitability. Ulta fits portfolios seeking growth at a reasonable price with lower risk exposure.
If you prioritize expansive growth fueled by innovation and market dominance, Amazon is the compelling choice due to its accelerating top-line and improving profitability. However, if you seek a more stable investment with a proven economic moat and strong capital returns, Ulta offers better stability and value creation potential.
Disclaimer: Investment carries a risk of loss of initial capital. The past performance is not a reliable indicator of future results. Be sure to understand risks before making an investment decision.
Go Further
I encourage you to read the complete analyses of Amazon.com, Inc. and Ulta Beauty, Inc. to enhance your investment decisions: