Home > Comparison > Consumer Cyclical > AMZN vs TSCO
The strategic rivalry between Amazon.com, Inc. and Tractor Supply Company shapes the future of specialty retail. Amazon operates a sprawling, technology-driven platform blending e-commerce with cloud services, while Tractor Supply focuses on rural lifestyle retail with a strong physical presence. This head-to-head pits digital innovation against niche market specialization. This analysis will determine which business model offers superior risk-adjusted returns for a diversified portfolio in today’s cyclical consumer sector.
Table of contents
Companies Overview
Amazon.com, Inc. and Tractor Supply Company represent two powerful forces in specialty retail, shaping distinct consumer segments.
Amazon.com, Inc.: Global E-Commerce and Cloud Giant
Amazon dominates as a global leader in online retail and cloud computing. It generates revenue through a diverse mix: direct product sales, third-party seller services, subscription programs like Amazon Prime, and Amazon Web Services. In 2026, the company focuses strategically on expanding AWS capabilities and enhancing customer engagement across its digital and physical platforms.
Tractor Supply Company: Rural Lifestyle Retailer
Tractor Supply Company specializes as the leading rural lifestyle retailer in the U.S., catering to recreational farmers and ranchers. Its core revenue comes from sales of agricultural, pet, and hardware products through more than 2,000 stores and e-commerce sites. The company’s 2026 strategy centers on expanding store footprint and integrating digital channels to deepen rural market penetration.
Strategic Collision: Similarities & Divergences
Both firms excel in specialty retail but target vastly different markets—Amazon’s broad digital ecosystem contrasts with Tractor Supply’s focused rural presence. Their competition overlaps marginally in e-commerce, yet Amazon’s scale and tech innovation set it apart. Investors face distinct profiles: Amazon offers high-growth tech diversification; Tractor Supply provides steady, niche retail resilience.
Income Statement Comparison
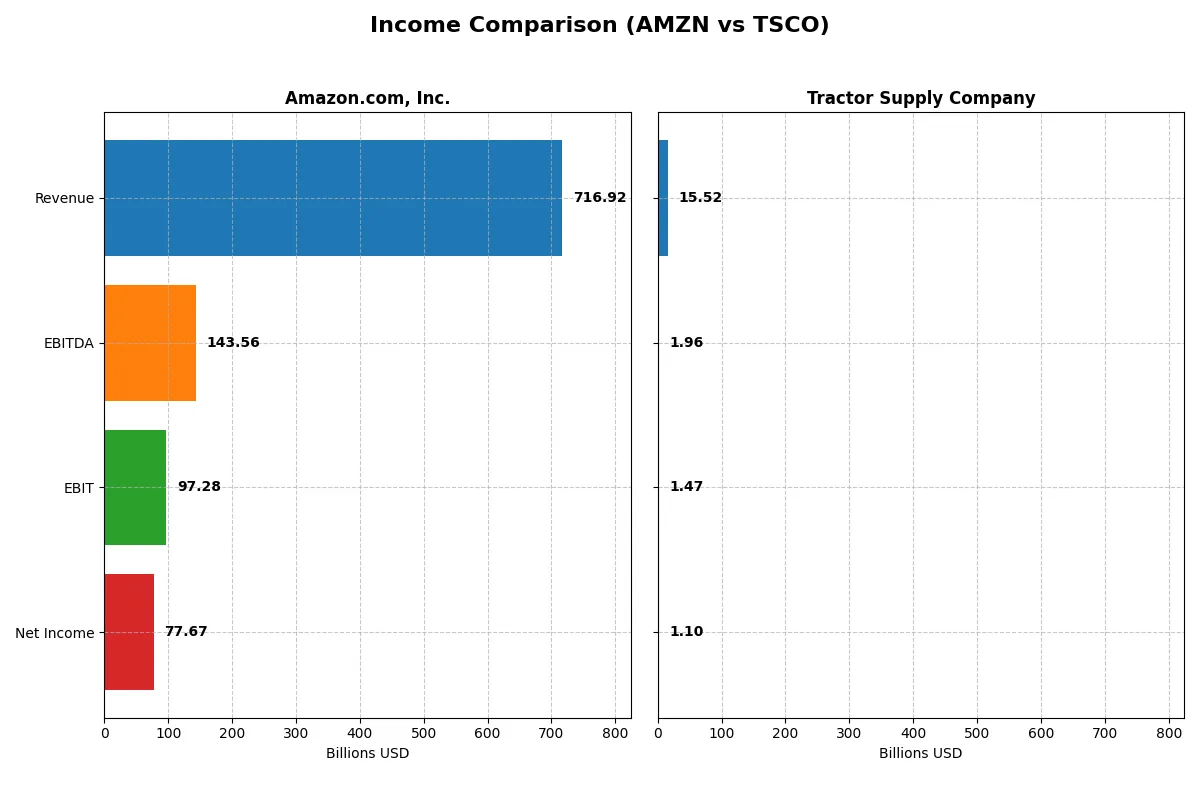
This data dissects the core profitability and scalability of both corporate engines to reveal who dominates the bottom line:
| Metric | Amazon.com, Inc. (AMZN) | Tractor Supply Company (TSCO) |
|---|---|---|
| Revenue | 717B | 15.5B |
| Cost of Revenue | 356.4B | 10.4B |
| Operating Expenses | 280.5B | 3.7B |
| Gross Profit | 360.5B | 5.2B |
| EBITDA | 143.6B | 2.0B |
| EBIT | 97.3B | 1.5B |
| Interest Expense | 2.3B | 69M |
| Net Income | 77.7B | 1.1B |
| EPS | 7.29 | 2.07 |
| Fiscal Year | 2025 | 2025 |
Income Statement Analysis: The Bottom-Line Duel
This income statement comparison reveals which company runs a more efficient and profitable corporate engine through recent financial performance.
Amazon.com, Inc. Analysis
Amazon’s revenue surged from $470B in 2021 to $717B in 2025, reflecting a 53% rise. Net income exploded from $33B to nearly $78B, doubling in five years. Its gross margin held strong near 50%, with net margin improving to 10.8%. The 2025 figures showcase accelerating profitability and expanding operating leverage, signaling robust momentum.
Tractor Supply Company Analysis
Tractor Supply’s revenue grew steadily from $12.7B in 2021 to $15.5B in 2025, up 22%. Net income increased modestly from $1B to $1.1B, with net margin steady at 7%. Gross margin hovered around 33%, while EBIT margin remained below 10%. The latest year shows stable but slower growth, indicating mature operational efficiency but limited expansion.
Margin Dominance vs. Steady Scale
Amazon dominates with superior margin expansion and rapid net income growth, nearly tripling its earnings in five years. Tractor Supply delivers consistent revenue gains but lags in profitability and margin improvement. For investors, Amazon’s dynamic margin and earnings momentum profile offers greater growth potential versus Tractor Supply’s steady but limited scale.
Financial Ratios Comparison
These vital ratios act as a diagnostic tool to expose the underlying fiscal health, valuation premiums, and capital efficiency of the companies analyzed:
| Ratios | Amazon.com, Inc. (AMZN) | Tractor Supply Company (TSCO) |
|---|---|---|
| ROE | 18.9% | 42.5% |
| ROIC | 10.7% | 13.1% |
| P/E | 31.8 | 24.2 |
| P/B | 6.0 | 10.3 |
| Current Ratio | 1.05 | 1.34 |
| Quick Ratio | 0.88 | 0.16 |
| D/E (Debt-to-Equity) | 0.37 | 3.73 |
| Debt-to-Assets | 18.7% | 88.1% |
| Interest Coverage | 35.2 | 21.2 |
| Asset Turnover | 0.88 | 1.42 |
| Fixed Asset Turnover | 2.01 | 2.23 |
| Payout Ratio | 0 | 44.5% |
| Dividend Yield | 0% | 1.84% |
| Fiscal Year | 2025 | 2025 |
Efficiency & Valuation Duel: The Vital Signs
Financial ratios act as the company’s DNA, exposing hidden risks and operational strengths that shape investor confidence and strategic positioning.
Amazon.com, Inc.
Amazon delivers solid profitability with an 18.9% ROE and a 10.8% net margin, signaling efficient core operations. However, its valuation appears stretched, trading at a high P/E of 31.8 and a P/B of 6.0, which may imply premium pricing. Amazon reinvests heavily in R&D, foregoing dividends to fuel growth and innovation.
Tractor Supply Company
Tractor Supply posts an impressive 42.5% ROE, reflecting strong shareholder value creation, though its 7.1% net margin is moderate. The stock trades at a reasonable P/E of 24.2 but carries high leverage, with a debt-to-equity ratio of 3.7 and elevated debt-to-assets at 88%. It offers a modest 1.8% dividend yield, balancing returns with financial risk.
Premium Valuation vs. Operational Safety
Amazon combines solid returns with growth-focused reinvestment but suffers from valuation premium and limited liquidity cushion. Tractor Supply exhibits superior profitability and dividend returns but carries significant financial leverage risks. Investors prioritizing growth might lean Amazon’s profile, while those seeking strong yield and efficiency may prefer Tractor Supply.
Which one offers the Superior Shareholder Reward?
I compare Amazon.com’s zero dividend payout and minimal free cash flow per share (0.7) with heavy reinvestment in growth and technology. Tractor Supply offers a 1.8% dividend yield and a 44% payout ratio, supported by steady free cash flow of 1.4 per share. Amazon’s buybacks are limited due to cash reinvestment, while Tractor Supply maintains consistent buybacks as part of its capital allocation. I see Tractor Supply’s mature dividend and buyback approach as more sustainable for reliable income in 2026. Amazon’s growth focus may deliver long-term capital gains but with higher risk. For total shareholder return today, Tractor Supply offers a superior, balanced reward profile.
Comparative Score Analysis: The Strategic Profile
The radar chart reveals the fundamental DNA and trade-offs of Amazon.com, Inc. and Tractor Supply Company, highlighting their financial strengths and weaknesses:
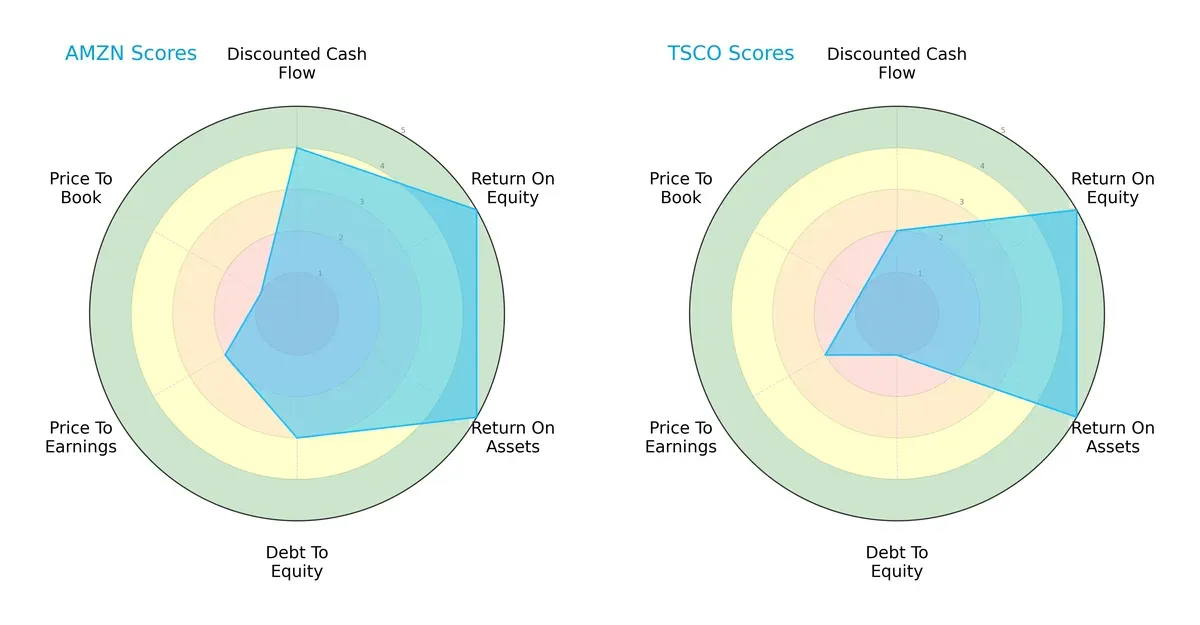
Amazon demonstrates a balanced profile with strong DCF (4), ROE (5), and ROA (5) scores, showing efficient capital use and solid cash flow. Tractor Supply matches Amazon in profitability (ROE 5, ROA 5) but lags in DCF (2) and suffers from a weak debt-to-equity score (1), signaling higher financial risk. Amazon’s moderate debt management (3) contrasts with Tractor Supply’s vulnerability, making Amazon the more stable choice despite valuation concerns.
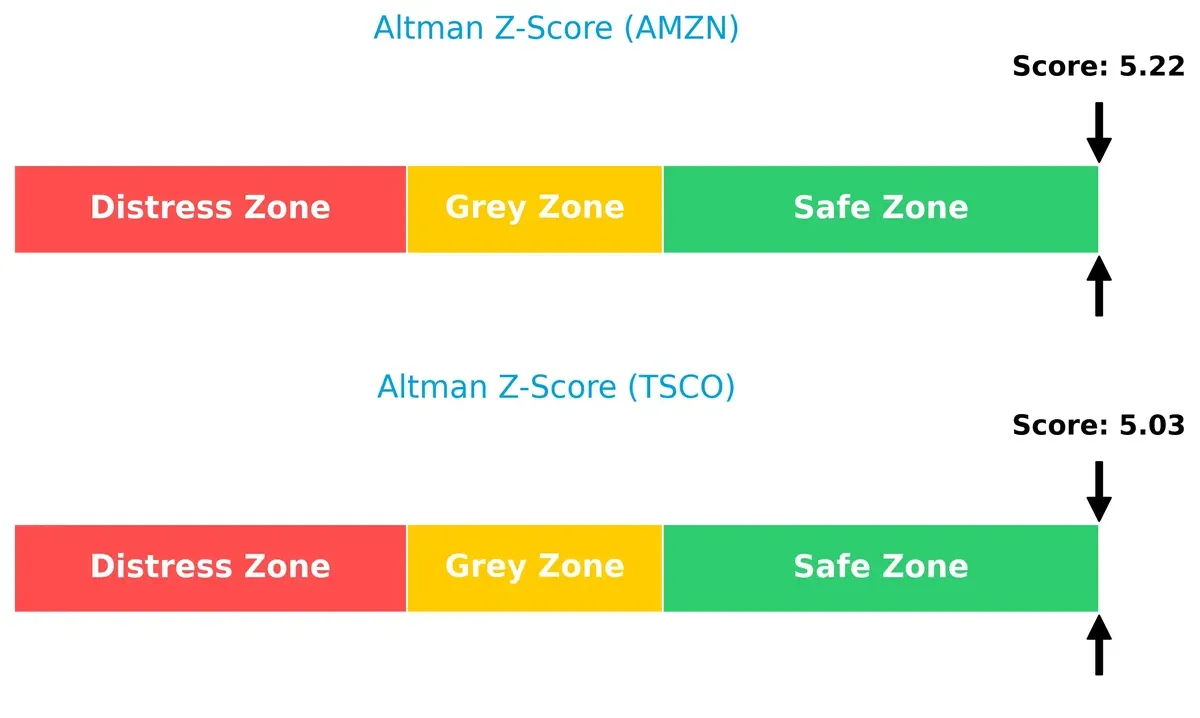
Bankruptcy Risk: Solvency Showdown
Amazon’s Altman Z-Score (5.22) slightly surpasses Tractor Supply’s (5.03), placing both comfortably in the safe zone for bankruptcy risk. This indicates robust financial stability and low default risk for long-term investors in the current cycle:
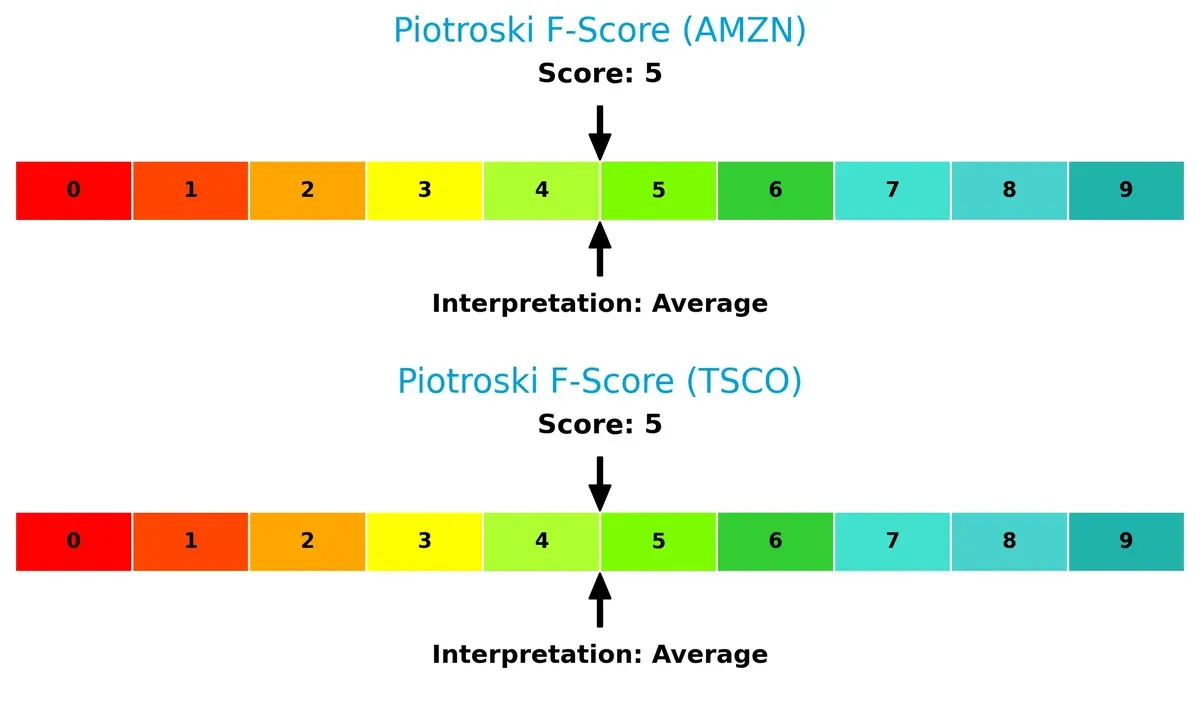
Financial Health: Quality of Operations
Both companies share an average Piotroski F-Score of 5, indicating moderate financial health. Neither shows immediate red flags, but this middling score suggests room for improvement in operational efficiency and balance sheet quality:
How are the two companies positioned?
This section dissects the operational DNA of Amazon and Tractor Supply by comparing their revenue distribution and internal dynamics. The goal is to confront their economic moats to reveal which business model delivers the most resilient and sustainable competitive advantage today.
Revenue Segmentation: The Strategic Mix
This comparison dissects how Amazon.com, Inc. and Tractor Supply Company diversify their income streams and where their primary sector bets lie:
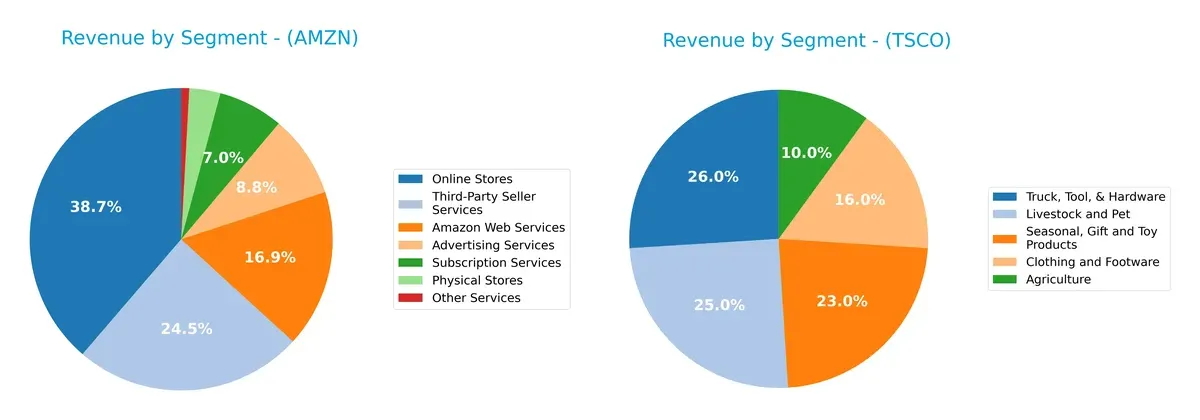
Amazon’s revenue dwarfs Tractor Supply’s, anchored by Online Stores at $247B and Third-Party Seller Services at $156B. Amazon shows a highly diversified mix with strong bets in AWS ($108B) and Advertising ($56B). Tractor Supply pivots around Truck, Tool, & Hardware ($3.9B) and Livestock and Pet ($3.7B), reflecting a more concentrated retail niche. Amazon’s ecosystem lock-in contrasts Tractor Supply’s focused sector exposure, implying differing risk profiles.
Strengths and Weaknesses Comparison
This table compares the Strengths and Weaknesses of Amazon.com, Inc. and Tractor Supply Company:
Amazon.com, Inc. Strengths
- Highly diversified revenue streams including AWS and Advertising Services
- Favorable profitability metrics with net margin at 10.83% and ROE at 18.89%
- Low debt-to-assets ratio at 18.7% and strong interest coverage of 42.78
- Significant global presence with substantial North America and international sales
Tractor Supply Company Strengths
- Strong return on equity at 42.46% and ROIC of 13.11%, outperforming WACC of 6.14%
- Favorable asset turnover at 1.42 indicating efficient use of assets
- Solid interest coverage ratio of 21.22
- Diversified product categories in agriculture, clothing, tools, and pet segments
Amazon.com, Inc. Weaknesses
- High price-to-book ratio at 6.01 and PE ratio at 31.83 suggest expensive valuation
- Neutral liquidity with current ratio at 1.05 and quick ratio at 0.88
- No dividend yield limits income for yield-focused investors
Tractor Supply Company Weaknesses
- High debt-to-equity at 3.73 and debt-to-assets at 88.12 raise leverage concerns
- Unfavorable quick ratio at 0.16 signals liquidity risk
- Price-to-book ratio at 10.27 indicates potential overvaluation
Amazon’s broad diversification and global footprint underpin its slightly favorable financial profile but valuation and liquidity pose caution. Tractor Supply excels in profitability and asset efficiency but carries significant leverage and liquidity risks, which may affect financial flexibility.
The Moat Duel: Analyzing Competitive Defensibility
A structural moat alone protects long-term profits from competition’s relentless erosion. Let’s dissect the competitive fortresses of Amazon and Tractor Supply:
Amazon.com, Inc.: Scale and Ecosystem Powerhouse
Amazon’s moat stems from its vast ecosystem and cost advantage, reflected in a growing ROIC despite shedding value relative to WACC. Its dominant North American and AWS segments fuel margin stability and expansion into new markets in 2026.
Tractor Supply Company: Niche Focus and Brand Loyalty
Tractor Supply’s competitive edge lies in strong brand loyalty and specialized rural retail presence. Unlike Amazon, it creates clear value above WACC but faces a declining ROIC trend, signaling pressure on profitability despite stable margins and steady expansion.
Verdict: Ecosystem Scale vs. Niche Brand Loyalty
Amazon commands a wider moat through scale and ecosystem integration, while Tractor Supply’s narrower moat shows value creation but with profitability challenges. Amazon is better positioned to defend market share in a competitive 2026 landscape.
Which stock offers better returns?
The past year showed a strong bullish trend for Amazon, with notable price acceleration slowing down, while Tractor Supply exhibited moderate gains and decelerating momentum.
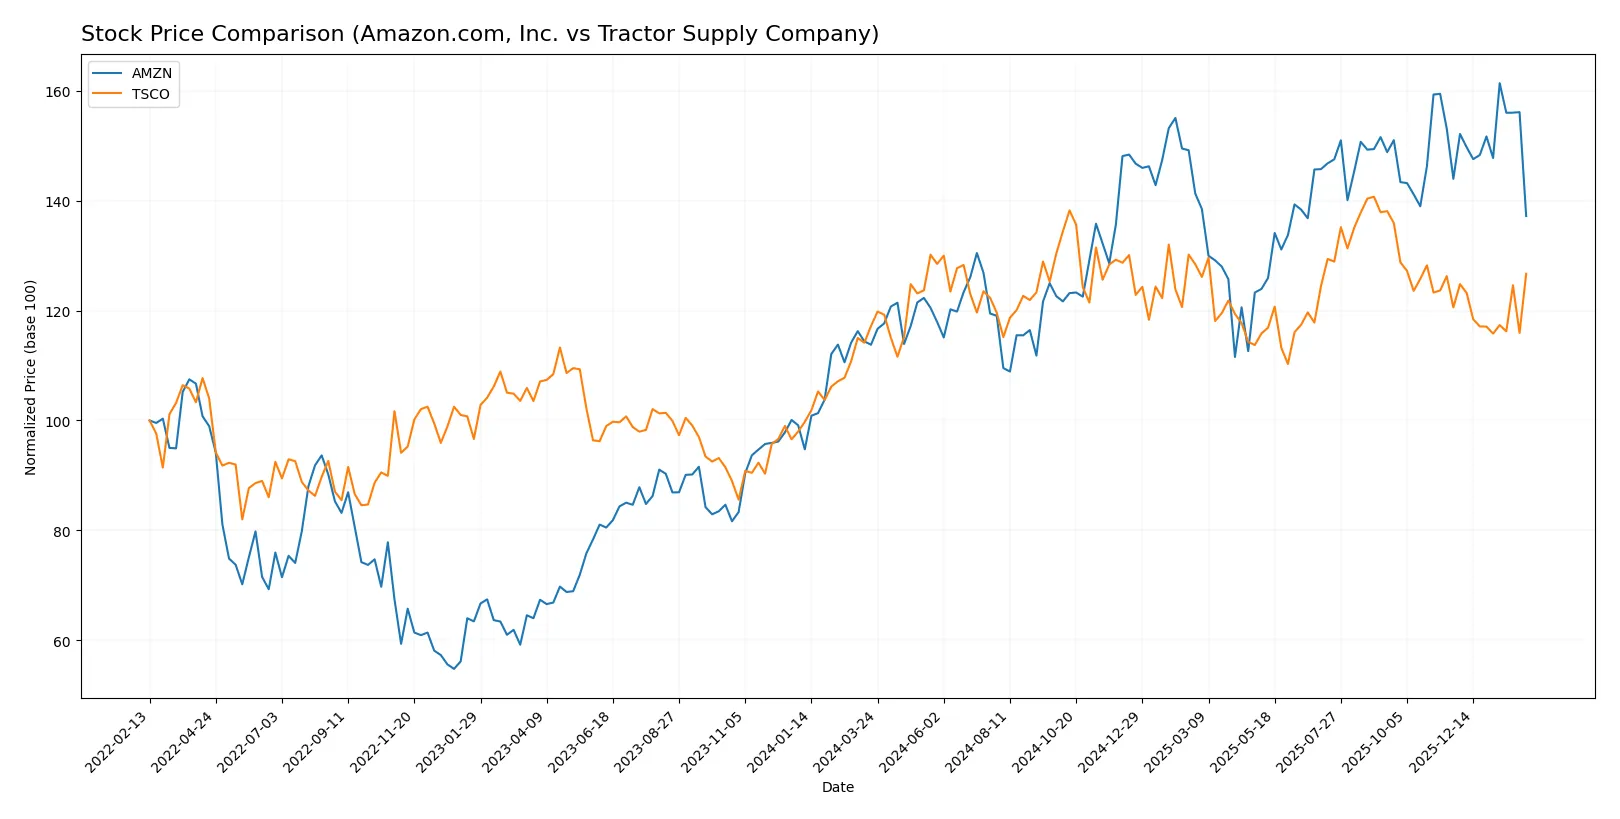
Trend Comparison
Amazon.com, Inc. posted a 20.58% price increase over the past 12 months, marking a bullish trend with decelerating acceleration and a wide price range from 167 to 247. Tractor Supply Company gained 8.13% in the same period, reflecting a bullish yet decelerating trend with less volatility between 48 and 62. Amazon’s return outperformed Tractor Supply’s by a significant margin, delivering the highest market performance among the two stocks.
Target Prices
Analysts present a clear consensus on target prices for Amazon.com, Inc. and Tractor Supply Company.
| Company | Target Low | Target High | Consensus |
|---|---|---|---|
| Amazon.com, Inc. | 175 | 315 | 283.86 |
| Tractor Supply Company | 50 | 67 | 59 |
Amazon’s target consensus at 284 implies a substantial upside from its current 210 price, signaling strong growth expectations. Tractor Supply’s target consensus of 59 suggests moderate appreciation potential above its present 55.61 price.

Don’t Let Luck Decide Your Entry Point
Optimize your entry points with our advanced ProRealTime indicators. You’ll get efficient buy signals with precise price targets for maximum performance. Start outperforming now!
How do institutions grade them?
Here is a summary of the latest institutional grades for Amazon.com, Inc. and Tractor Supply Company:
Amazon.com, Inc. Grades
The following table lists recent grades from established grading firms for Amazon.com, Inc.:
| Grading Company | Action | New Grade | Date |
|---|---|---|---|
| BMO Capital | Maintain | Outperform | 2026-02-06 |
| Oppenheimer | Maintain | Outperform | 2026-02-06 |
| Wedbush | Maintain | Outperform | 2026-02-06 |
| Evercore ISI Group | Maintain | Outperform | 2026-02-06 |
| Argus Research | Maintain | Buy | 2026-02-06 |
| Telsey Advisory Group | Maintain | Outperform | 2026-02-06 |
| Piper Sandler | Maintain | Overweight | 2026-02-06 |
| Citizens | Maintain | Market Outperform | 2026-02-06 |
| RBC Capital | Maintain | Outperform | 2026-02-06 |
| Wells Fargo | Maintain | Overweight | 2026-02-06 |
Tractor Supply Company Grades
Below are recent institutional grades from reputable firms for Tractor Supply Company:
| Grading Company | Action | New Grade | Date |
|---|---|---|---|
| Argus Research | Maintain | Buy | 2026-02-02 |
| Telsey Advisory Group | Maintain | Outperform | 2026-01-30 |
| TD Cowen | Maintain | Hold | 2026-01-30 |
| JP Morgan | Maintain | Neutral | 2026-01-30 |
| Piper Sandler | Maintain | Overweight | 2026-01-30 |
| Mizuho | Maintain | Outperform | 2026-01-30 |
| Morgan Stanley | Maintain | Equal Weight | 2026-01-30 |
| Jefferies | Maintain | Buy | 2026-01-30 |
| Goldman Sachs | Maintain | Buy | 2026-01-30 |
| DA Davidson | Maintain | Buy | 2026-01-30 |
Which company has the best grades?
Amazon.com, Inc. consistently receives “Outperform” and “Buy” ratings from major firms, indicating strong institutional confidence. Tractor Supply Company shows a wider range from “Buy” to “Hold,” reflecting more mixed views. Investors may interpret Amazon’s more uniform positive grades as higher consensus confidence.
Risks specific to each company
The following categories identify the critical pressure points and systemic threats facing both firms in the 2026 market environment:
1. Market & Competition
Amazon.com, Inc.
- Dominates e-commerce and cloud sectors but faces intense tech and retail rivals.
Tractor Supply Company
- Strong in rural retail niche with moderate competition from big-box and online stores.
2. Capital Structure & Debt
Amazon.com, Inc.
- Maintains moderate leverage (D/E 0.37) with excellent interest coverage (42.78x).
Tractor Supply Company
- Highly leveraged (D/E 3.73), raising financial risk despite adequate coverage (21.22x).
3. Stock Volatility
Amazon.com, Inc.
- Beta 1.385 indicates above-market volatility, reflecting exposure to tech sector swings.
Tractor Supply Company
- Beta 0.726 shows lower volatility, more stable amid retail market fluctuations.
4. Regulatory & Legal
Amazon.com, Inc.
- Faces global antitrust scrutiny and data privacy regulations, increasing compliance costs.
Tractor Supply Company
- Primarily U.S.-focused, less exposed to complex international regulatory risks.
5. Supply Chain & Operations
Amazon.com, Inc.
- Complex global supply chains vulnerable to geopolitical disruptions and inflationary pressures.
Tractor Supply Company
- Regional supply chain more straightforward but sensitive to agricultural commodity price shifts.
6. ESG & Climate Transition
Amazon.com, Inc.
- Under pressure to reduce carbon footprint and improve labor practices amid public scrutiny.
Tractor Supply Company
- Faces challenges integrating ESG initiatives in rural supply chains and product sourcing.
7. Geopolitical Exposure
Amazon.com, Inc.
- High global footprint exposes it to trade tensions and foreign policy risks.
Tractor Supply Company
- Localized U.S. operations limit direct geopolitical risk but still affected by domestic policy shifts.
Which company shows a better risk-adjusted profile?
Amazon’s most impactful risk lies in regulatory and global supply chain complexity, given its vast operations and antitrust pressures. Tractor Supply’s critical risk is its high leverage, which threatens financial stability in downturns. Amazon’s lower debt and superior interest coverage grant it a more resilient risk-adjusted profile. Notably, Tractor Supply’s debt-to-assets ratio of 88% signals elevated vulnerability, whereas Amazon’s 18.7% ratio reflects prudent capital management.
Final Verdict: Which stock to choose?
Amazon.com, Inc. excels as a cash machine with expanding profitability and a growing ROIC, signaling improving operational efficiency. Its point of vigilance lies in a high valuation premium and modest liquidity ratios. It suits investors seeking aggressive growth anchored in innovation and scale.
Tractor Supply Company boasts a solid strategic moat through strong return on equity and a durable value-creating business model. Compared to Amazon, it offers better debt management safety but shows signs of declining profitability. It fits well within GARP portfolios balancing growth with reasonable risk.
If you prioritize rapid expansion and reinvestment efficiency, Amazon outshines with its improving profitability and market dominance. However, if you seek value creation with financial discipline and more stability, Tractor Supply offers better risk-adjusted prospects despite its profitability headwinds. Both present slightly favorable scenarios but cater to distinct investor profiles.
Disclaimer: Investment carries a risk of loss of initial capital. The past performance is not a reliable indicator of future results. Be sure to understand risks before making an investment decision.
Go Further
I encourage you to read the complete analyses of Amazon.com, Inc. and Tractor Supply Company to enhance your investment decisions: