Home > Comparison > Consumer Cyclical > AMZN vs GPC
The strategic rivalry between Amazon.com, Inc. and Genuine Parts Company shapes the future of specialty retail. Amazon dominates as a global e-commerce and cloud services powerhouse, while Genuine Parts Company excels as a distributor of automotive and industrial replacement parts. This analysis pits Amazon’s innovation-driven growth against Genuine Parts’ steady value model. I will determine which corporate trajectory delivers superior risk-adjusted returns for a diversified portfolio in today’s dynamic market environment.
Table of contents
Companies Overview
Amazon.com, Inc. and Genuine Parts Company both hold significant roles in the specialty retail sector, shaping diverse market segments globally.
Amazon.com, Inc.: E-commerce and Cloud Powerhouse
Amazon.com, Inc. dominates specialty retail through a vast online and physical presence. Its core revenue stems from consumer product sales, third-party seller services, and Amazon Web Services (AWS), a leading cloud computing platform. In 2026, Amazon sharpens its strategic focus on expanding AWS capabilities while enhancing Prime membership benefits to deepen customer engagement.
Genuine Parts Company: Industrial and Automotive Distribution Leader
Genuine Parts Company excels in distributing automotive and industrial replacement parts across multiple global markets. Its revenue engine relies on supplying repair shops, fleet operators, and OEM customers with a broad range of parts and value-added services. In 2026, the company prioritizes expanding service offerings and international footprint to support diverse industrial clients and evolving vehicle technologies.
Strategic Collision: Similarities & Divergences
Both firms operate in specialty retail but diverge sharply in business philosophy. Amazon leverages a technology-driven, integrated ecosystem blending retail and cloud services. Genuine Parts focuses on a product-centric, service-heavy distribution model supporting industrial and automotive sectors. Their primary battleground lies in serving evolving customer needs, from digital convenience to specialized parts supply. These distinctions shape fundamentally different risk-reward profiles for investors.
Income Statement Comparison
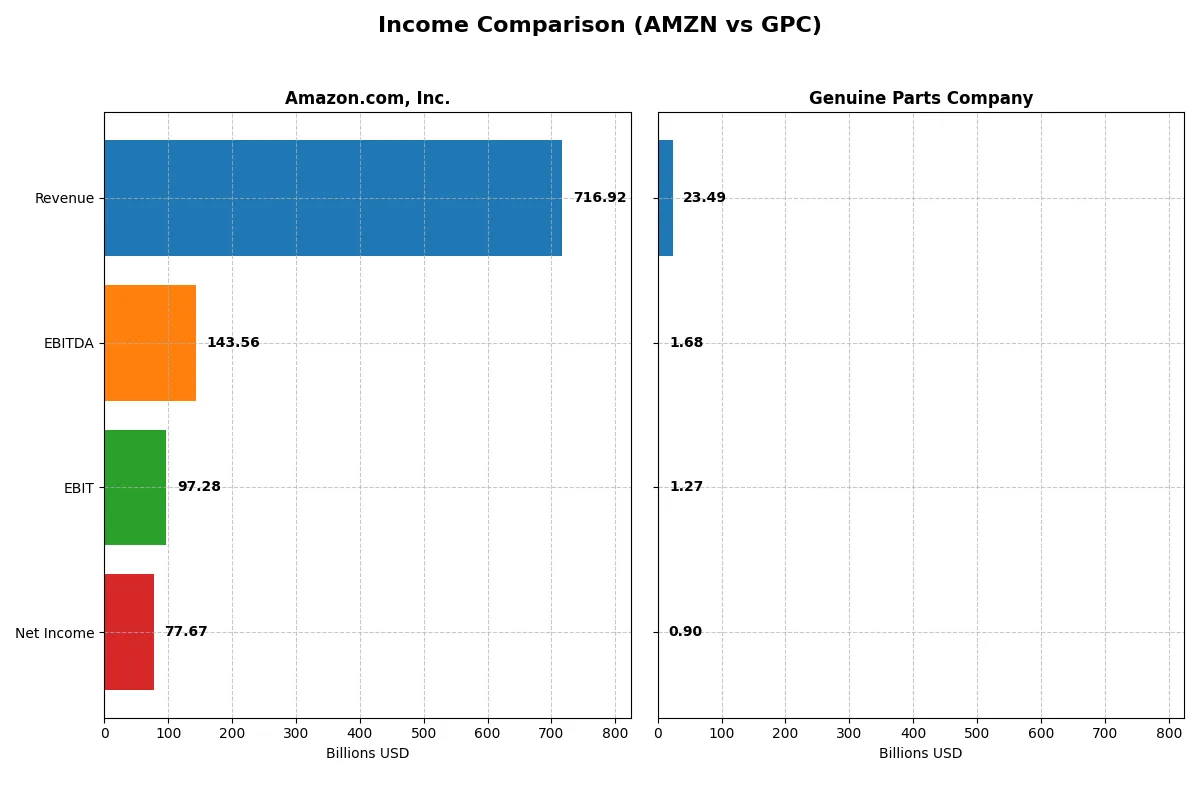
The following data dissects the core profitability and scalability of both corporate engines to reveal who dominates the bottom line:
| Metric | Amazon.com, Inc. (AMZN) | Genuine Parts Company (GPC) |
|---|---|---|
| Revenue | 717B | 23.5B |
| Cost of Revenue | 356.4B | 14.96B |
| Operating Expenses | 280.5B | 7.08B |
| Gross Profit | 360.5B | 8.52B |
| EBITDA | 143.6B | 1.68B |
| EBIT | 97.3B | 1.27B |
| Interest Expense | 2.27B | 97M |
| Net Income | 77.7B | 904M |
| EPS | 7.29 | 6.49 |
| Fiscal Year | 2025 | 2024 |
Income Statement Analysis: The Bottom-Line Duel
This income statement comparison reveals how efficiently each company converts revenue into profit, exposing the strength of their business engines.
Amazon.com, Inc. Analysis
Amazon’s revenue surged from 470B in 2021 to 717B in 2025, showcasing robust growth momentum. Net income exploded from 33B in 2021 to 78B in 2025, reflecting improved profitability. Gross margin stayed strong at 50.3%, while net margin expanded to 10.8%. The latest year highlights Amazon’s scale and operational leverage, driving a 16.7% net margin increase.
Genuine Parts Company Analysis
GPC’s revenue grew more modestly from 16.5B in 2020 to 23.5B in 2024. Net income showed volatility, peaking at 1.3B in 2023 before falling to 904M in 2024. Gross margin held at a solid 36.3%, but net margin remained slim at 3.9%. The recent decline in EBIT and net margin signals pressure on operating efficiency and profitability momentum.
Scale and Margin Dominance vs. Margin Stability and Growth Challenges
Amazon outpaces GPC with superior revenue scale and margin expansion, doubling net income over five years. GPC’s growth is steady but faces near-term profitability setbacks. Amazon’s profile appeals to investors prioritizing aggressive growth and margin gains, while GPC suits those favoring stable, if modest, earnings in a mature sector.
Financial Ratios Comparison
These vital ratios act as a diagnostic tool to expose underlying fiscal health, valuation premiums, and capital efficiency for the companies compared below:
| Ratios | Amazon.com, Inc. (AMZN) | Genuine Parts Company (GPC) |
|---|---|---|
| ROE | 18.9% | 20.8% |
| ROIC | 10.7% | 9.8% |
| P/E | 31.8 | 18.0 |
| P/B | 6.0 | 3.7 |
| Current Ratio | 1.05 | 1.16 |
| Quick Ratio | 0.88 | 0.51 |
| D/E (Debt-to-Equity) | 0.37 | 1.32 |
| Debt-to-Assets | 18.7% | 29.8% |
| Interest Coverage | 35.2 | 14.9 |
| Asset Turnover | 0.88 | 1.22 |
| Fixed Asset Turnover | 2.01 | 6.31 |
| Payout ratio | 0% | 61.4% |
| Dividend yield | 0% | 3.41% |
| Fiscal Year | 2025 | 2024 |
Efficiency & Valuation Duel: The Vital Signs
Financial ratios act as a company’s DNA, revealing hidden risks and operational excellence crucial for discerning investors.
Amazon.com, Inc.
Amazon posts a strong 18.9% ROE and solid 10.8% net margin, signaling robust profitability. However, its P/E ratio of 31.8 and P/B of 6.0 suggest the stock is expensive and stretched. Amazon returns value primarily through reinvestment, allocating 15% of revenue to R&D to fuel growth rather than dividends.
Genuine Parts Company
Genuine Parts shows a higher ROE at 20.8%, but a modest 3.9% net margin, reflecting conservative profitability. Its P/E near 18 and P/B at 3.8 imply a more reasonable valuation. The company balances shareholder returns with a 3.4% dividend yield, offering income alongside measured growth.
Valuation Stretch vs. Income Stability
Amazon’s premium valuation contrasts with Genuine Parts’ moderate multiples and steady dividends. Amazon’s growth profile suits investors seeking capital gains despite valuation risk. Genuine Parts appeals to those prioritizing income and operational stability within a balanced risk framework.
Which one offers the Superior Shareholder Reward?
Amazon.com, Inc. (AMZN) pays no dividends but reinvests heavily in growth, yielding minimal free cash flow (0.7/share in 2025). Genuine Parts Company (GPC) offers a solid 3.4% dividend yield, with a 61% payout ratio backed by strong free cash flow (4.9/share). Both engage in buybacks, but GPC’s mature, cash-generative model sustains distributions better. I find GPC’s balanced yield plus buybacks deliver a more attractive total return profile for 2026 investors seeking income and stability over Amazon’s aggressive, long-term growth reinvestment without immediate shareholder payouts.
Comparative Score Analysis: The Strategic Profile
The radar chart reveals the fundamental DNA and trade-offs of Amazon.com, Inc. and Genuine Parts Company, highlighting their competitive strengths and weaknesses:
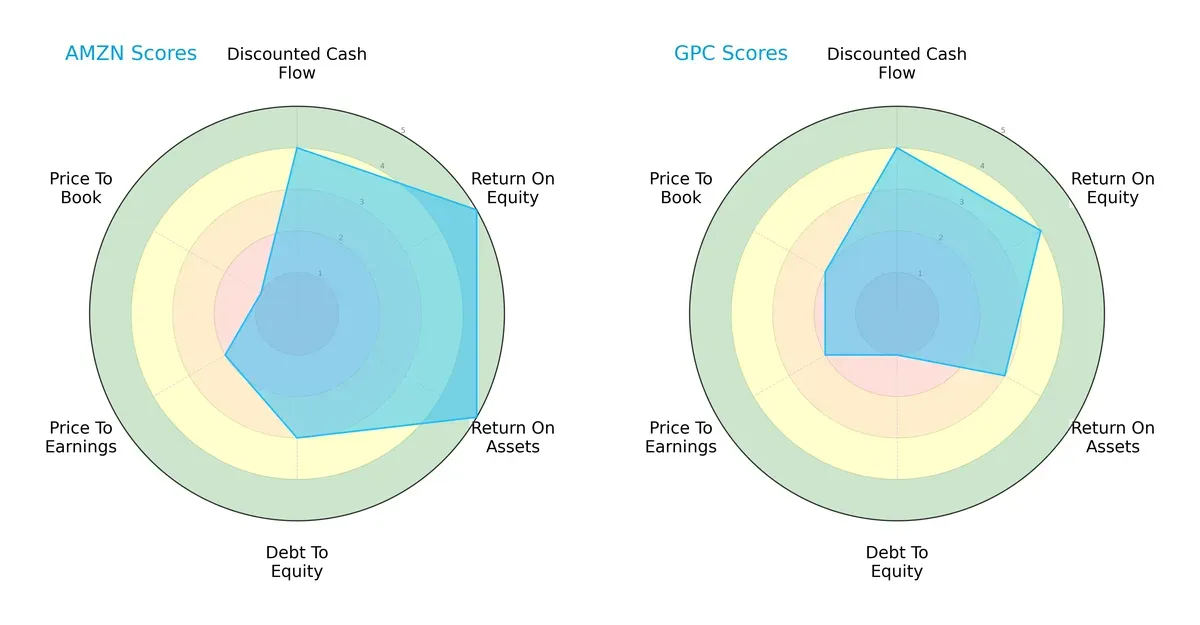
Amazon dominates in profitability metrics with top ROE and ROA scores (5 each), showcasing operational efficiency. Genuine Parts lags slightly with moderate ROE (4) and ROA (3). Both share strong discounted cash flow scores (4), reflecting sound cash generation. Amazon’s moderate debt-to-equity score (3) contrasts sharply with Genuine Parts’ weak leverage position (1), indicating greater financial risk for GPC. Valuation metrics tilt against Amazon, with unfavorable P/E (2) and very unfavorable P/B (1) scores, suggesting potential overvaluation compared to GPC’s slightly better valuation scores (P/E 2, P/B 2). Overall, Amazon presents a more balanced profile driven by operational excellence, while Genuine Parts relies on conservative valuation but suffers from higher leverage risk.
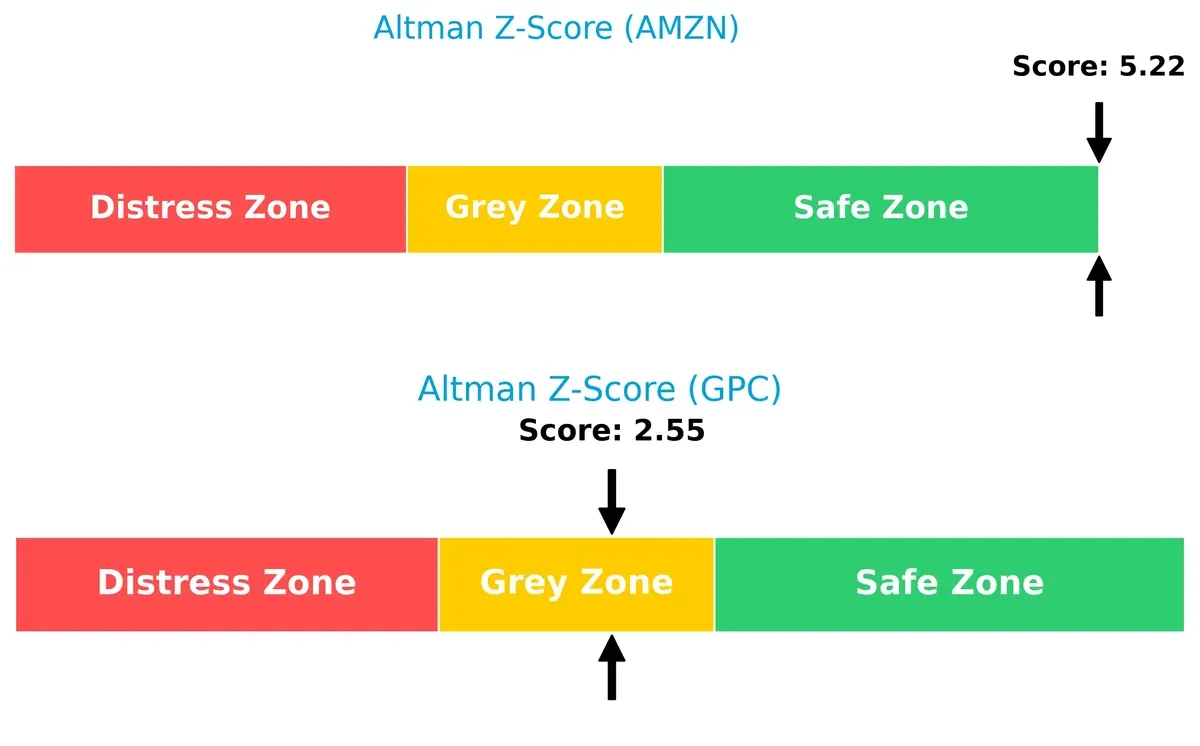
Bankruptcy Risk: Solvency Showdown
Amazon’s Altman Z-Score of 5.22 places it firmly in the safe zone, signaling strong long-term solvency. Genuine Parts’ 2.55 score lands in the grey zone, suggesting moderate bankruptcy risk amid economic fluctuations:
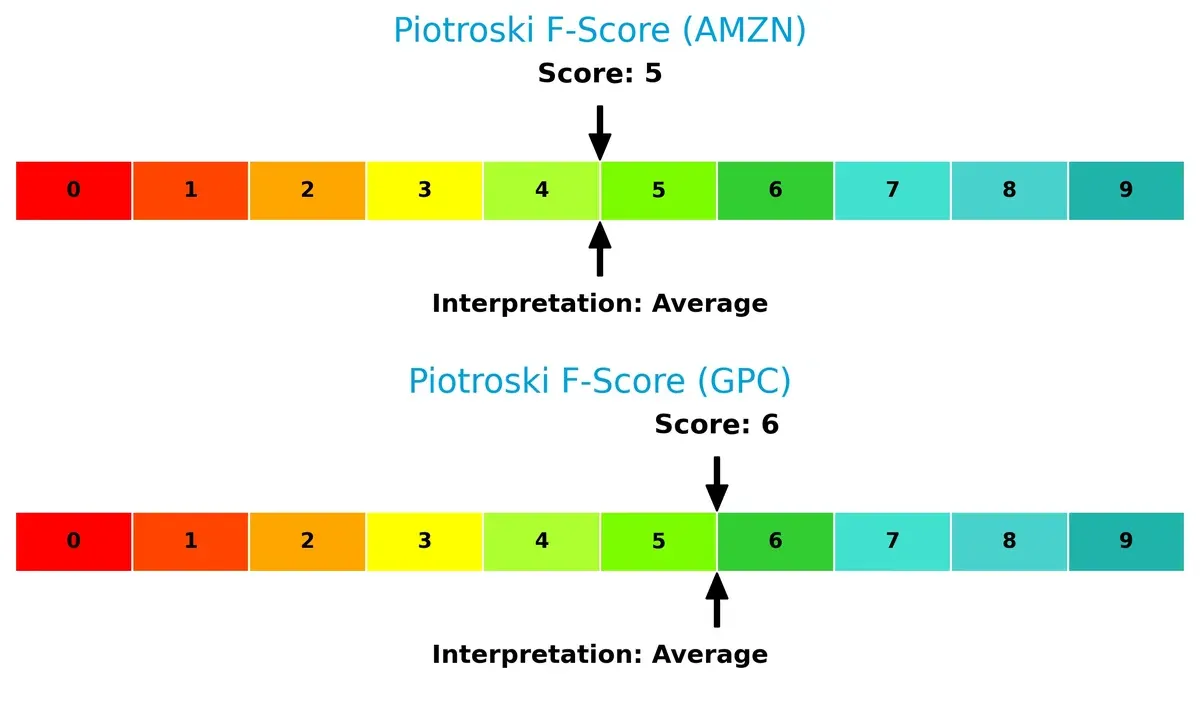
Financial Health: Quality of Operations
Amazon and Genuine Parts show average Piotroski F-Scores of 5 and 6, respectively, indicating stable but not peak financial health. Neither raises immediate red flags, but Genuine Parts exhibits slightly better internal operational quality:
How are the two companies positioned?
This section dissects the operational DNA of Amazon and Genuine Parts by comparing their revenue distribution and internal dynamics. The goal is to confront their economic moats to identify the most resilient competitive advantage in today’s market.
Revenue Segmentation: The Strategic Mix
This comparison dissects how Amazon.com, Inc. and Genuine Parts Company diversify income streams and where their primary sector bets focus:
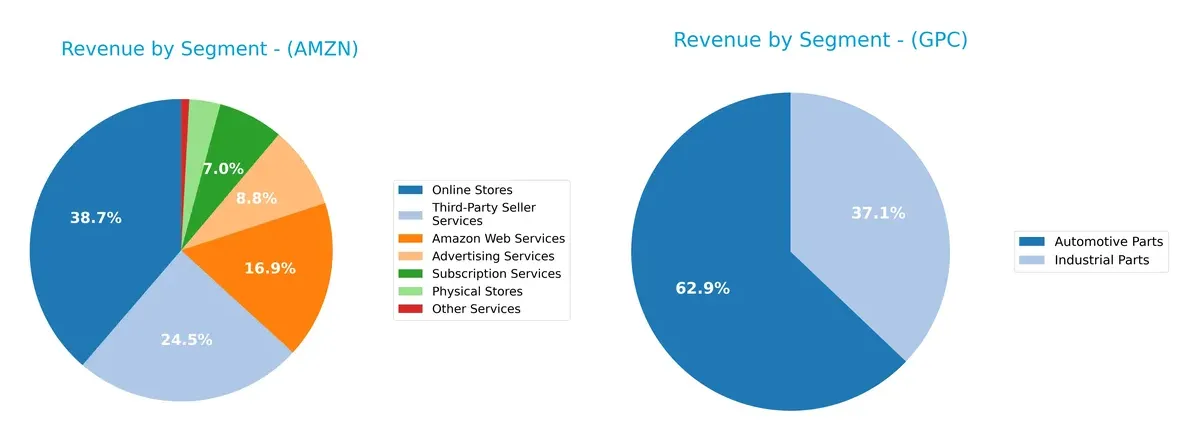
Amazon.com, Inc. boasts a highly diversified portfolio with no single segment dominating; its Online Stores at $247B anchor revenue, supported by Third-Party Seller Services at $156B and AWS at $108B. Genuine Parts Company leans heavily on Automotive Parts at $14.8B, nearly doubling Industrial Parts at $8.7B, showing moderate diversification. Amazon’s mix drives ecosystem lock-in and cross-segment synergy, while Genuine Parts faces concentration risk but benefits from focused industrial expertise.
Strengths and Weaknesses Comparison
This table compares the strengths and weaknesses of Amazon.com, Inc. and Genuine Parts Company:
Amazon.com, Inc. Strengths
- Diverse revenue streams including AWS, advertising, and third-party seller services
- Strong global presence with significant North America and international sales
- Favorable profitability metrics: net margin 10.83%, ROE 18.89%, ROIC 10.71%
- Conservative leverage with debt-to-assets 18.7%, high interest coverage 42.78
Genuine Parts Company Strengths
- Focused product segmentation in automotive and industrial parts
- Favorable ROE 20.84% and WACC 6.14%, supporting efficient capital use
- Strong asset turnover 1.22 and fixed asset turnover 6.31 indicating operational efficiency
- Positive dividend yield 3.41% provides income to investors
Amazon.com, Inc. Weaknesses
- High valuation ratios: PE 31.83 and PB 6.01 seen as unfavorable
- Neutral liquidity ratios: current ratio 1.05, quick ratio 0.88 may limit short-term flexibility
- No dividend yield, which may deter income-focused investors
Genuine Parts Company Weaknesses
- Low net margin 3.85%, indicating weaker profitability
- Elevated debt-to-equity ratio 1.32 and unfavorable quick ratio 0.51 raise financial risk concerns
- Unfavorable PB 3.75 suggests limited market valuation upside
Both companies exhibit slightly favorable overall financial profiles but differ in operational scale and financial structure. Amazon’s broad diversification and strong profitability contrast with Genuine Parts’ focused niche and income generation. Each faces specific valuation and liquidity challenges that shape their strategic priorities.
The Moat Duel: Analyzing Competitive Defensibility
A structural moat alone shields long-term profits from relentless competitive pressure and market erosion. Here’s how Amazon and Genuine Parts Company defend their turf:
Amazon.com, Inc.: Ecosystem and Scale Moat
Amazon’s primary moat stems from its vast ecosystem and scale economies. This drives high gross margins (50.3%) and expanding EBIT (13.6%), reflecting operational leverage. I see AWS growth and global retail expansion as pivotal to deepening this moat in 2026.
Genuine Parts Company: Niche Distribution and Service Moat
GPC relies on specialized distribution networks and customer switching costs in automotive and industrial parts. Its moat contrasts Amazon’s by focusing on stable, albeit thinner, margins (5.4% EBIT). The firm’s ROIC growth signals value creation, with potential in aftermarket electrification.
Verdict: Scale Ecosystem vs. Niche Distribution
Amazon’s moat is broader, driven by unmatched scale and tech-enabled ecosystem. GPC shows a deeper ROIC advantage, proving efficient capital use. Yet, Amazon is better positioned to defend market share amid digital transformation and global reach.
Which stock offers better returns?
Over the past year, Amazon.com, Inc. shows a strong upward price movement with a decelerating bullish trend, while Genuine Parts Company experiences a moderate overall decline with recent accelerating recovery.
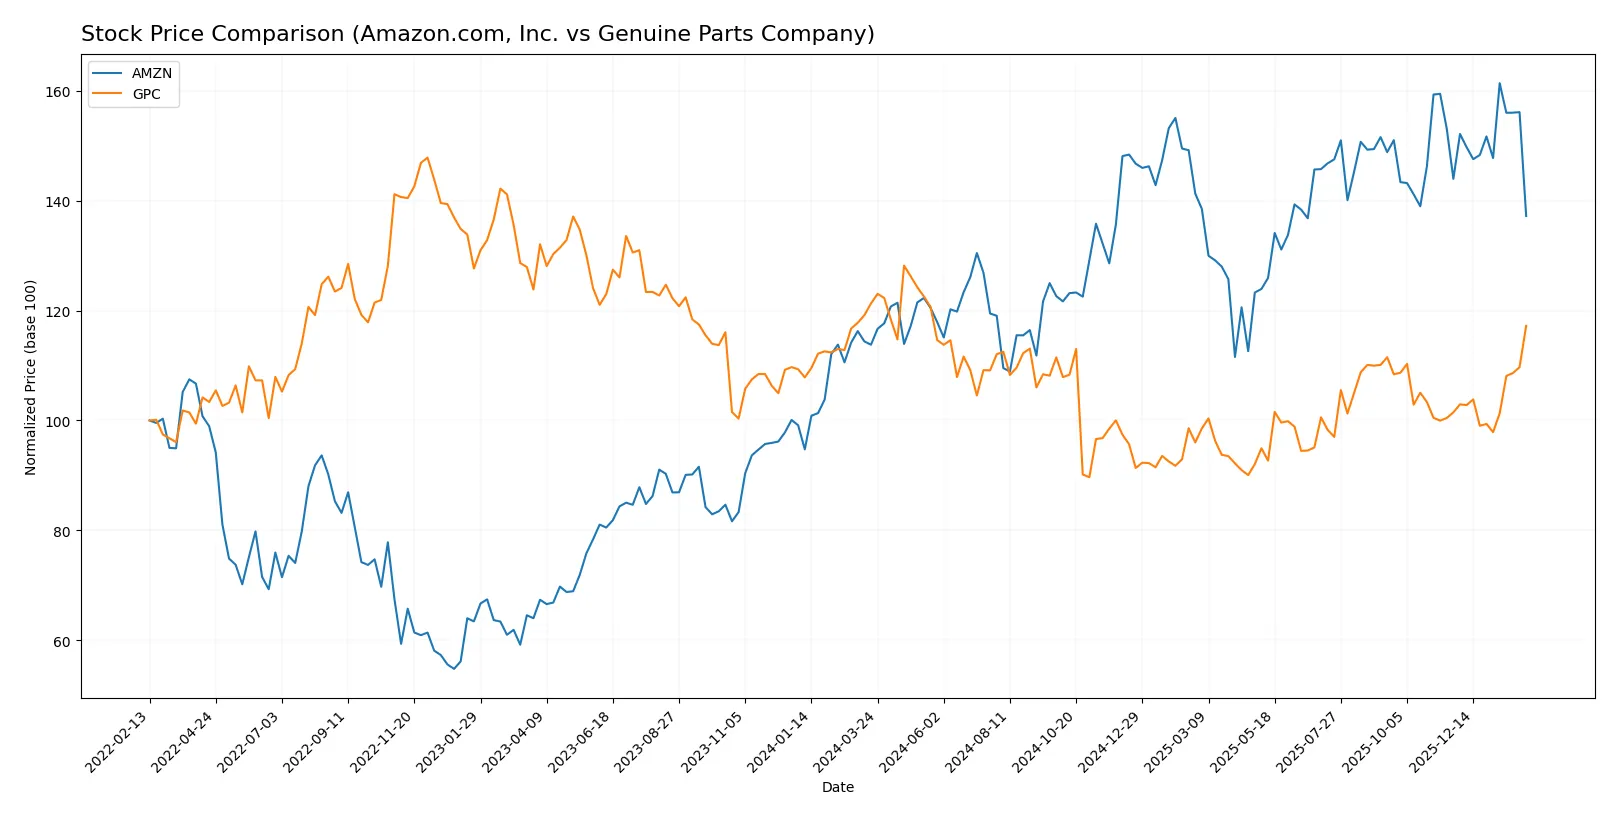
Trend Comparison
Amazon.com, Inc.’s stock posts a 20.58% gain over the past 12 months, reflecting a bullish trend with deceleration and notable volatility (21.86 std deviation). The highest price reached 247.38, the lowest 166.94.
Genuine Parts Company’s stock declines by 3.35% over the same period, marking a bearish trend with accelerating momentum. Its volatility is moderate (11.73 std deviation), with prices ranging from 113.61 to 162.39.
Amazon.com’s stock outperforms Genuine Parts, delivering significantly higher market returns despite recent short-term weakness compared to GPC’s recent rebound.
Target Prices
Analysts present a mixed but generally optimistic target consensus for Amazon.com, Inc. and Genuine Parts Company.
| Company | Target Low | Target High | Consensus |
|---|---|---|---|
| Amazon.com, Inc. | 175 | 315 | 283.86 |
| Genuine Parts Company | 140 | 150 | 145.33 |
The target consensus for Amazon suggests upside potential from the current 210.32 price, reflecting confidence in growth drivers. Genuine Parts Company trades near its consensus target of 145.33, indicating a more stable valuation outlook.

Don’t Let Luck Decide Your Entry Point
Optimize your entry points with our advanced ProRealTime indicators. You’ll get efficient buy signals with precise price targets for maximum performance. Start outperforming now!
How do institutions grade them?
The following tables show the latest institutional grades for Amazon.com, Inc. and Genuine Parts Company:
Amazon.com, Inc. Grades
This table summarizes recent grades issued by major financial institutions for Amazon.com, Inc.
| Grading Company | Action | New Grade | Date |
|---|---|---|---|
| BMO Capital | Maintain | Outperform | 2026-02-06 |
| Oppenheimer | Maintain | Outperform | 2026-02-06 |
| Wedbush | Maintain | Outperform | 2026-02-06 |
| Evercore ISI Group | Maintain | Outperform | 2026-02-06 |
| Argus Research | Maintain | Buy | 2026-02-06 |
| Telsey Advisory Group | Maintain | Outperform | 2026-02-06 |
| Piper Sandler | Maintain | Overweight | 2026-02-06 |
| Citizens | Maintain | Market Outperform | 2026-02-06 |
| RBC Capital | Maintain | Outperform | 2026-02-06 |
| Wells Fargo | Maintain | Overweight | 2026-02-06 |
Genuine Parts Company Grades
This table summarizes recent grades issued by major financial institutions for Genuine Parts Company.
| Grading Company | Action | New Grade | Date |
|---|---|---|---|
| Goldman Sachs | Upgrade | Neutral | 2025-11-13 |
| JP Morgan | Maintain | Overweight | 2025-10-23 |
| Truist Securities | Maintain | Buy | 2025-10-22 |
| UBS | Maintain | Neutral | 2025-10-10 |
| Evercore ISI Group | Maintain | Outperform | 2025-10-01 |
| Evercore ISI Group | Maintain | Outperform | 2025-08-26 |
| Loop Capital | Maintain | Buy | 2025-07-24 |
| JP Morgan | Maintain | Overweight | 2025-07-23 |
| UBS | Maintain | Neutral | 2025-07-23 |
| Truist Securities | Maintain | Buy | 2025-07-23 |
Which company has the best grades?
Amazon.com, Inc. consistently receives top-tier ratings such as “Outperform” and “Buy” across multiple institutions. Genuine Parts Company shows a mix of “Buy,” “Neutral,” and “Outperform” grades, with some recent upgrades. Amazon’s stronger and more uniform grades may signal higher institutional confidence, potentially influencing investor sentiment toward greater optimism.
Risks specific to each company
The following categories identify the critical pressure points and systemic threats facing both firms in the 2026 market environment:
1. Market & Competition
Amazon.com, Inc.
- Faces intense competition in e-commerce and cloud services, requiring constant innovation to maintain dominance.
Genuine Parts Company
- Operates in a fragmented automotive and industrial parts market with steady demand but limited pricing power.
2. Capital Structure & Debt
Amazon.com, Inc.
- Maintains moderate leverage with a debt-to-equity ratio of 0.37, supporting financial flexibility and low risk.
Genuine Parts Company
- Exhibits high leverage with a debt-to-equity ratio of 1.32, increasing financial risk and interest burden.
3. Stock Volatility
Amazon.com, Inc.
- Beta of 1.385 signals higher stock volatility, reflecting sensitivity to market swings and sector cyclicality.
Genuine Parts Company
- Lower beta of 0.73 indicates less volatility and relatively stable stock performance compared to broader markets.
4. Regulatory & Legal
Amazon.com, Inc.
- Faces significant regulatory scrutiny on data privacy, antitrust, and labor practices globally.
Genuine Parts Company
- Encounters moderate regulatory risks mainly tied to automotive and industrial safety standards.
5. Supply Chain & Operations
Amazon.com, Inc.
- Complex global supply chain vulnerable to disruptions but supported by advanced logistics capabilities.
Genuine Parts Company
- Relies on extensive distribution networks; operational efficiency critical amid rising logistics costs.
6. ESG & Climate Transition
Amazon.com, Inc.
- Invests heavily in sustainability initiatives but faces criticism over carbon footprint and labor conditions.
Genuine Parts Company
- ESG efforts growing but lag behind peers; transition risk exists in automotive parts for combustion engines.
7. Geopolitical Exposure
Amazon.com, Inc.
- Significant international exposure exposes it to trade tensions, tariffs, and geopolitical instability.
Genuine Parts Company
- Operates in multiple countries but with a more limited global footprint, reducing geopolitical risk.
Which company shows a better risk-adjusted profile?
Amazon’s most impactful risk lies in regulatory and geopolitical pressures, threatening its global business model. Genuine Parts Company faces its greatest risk from high leverage, elevating financial vulnerability. Amazon’s diversified operations and stronger balance sheet yield a superior risk-adjusted profile. Notably, Amazon’s Altman Z-score of 5.22 confirms robust financial health, while GPC’s 2.55 signals moderate distress risk.
Final Verdict: Which stock to choose?
Amazon’s superpower lies in its unmatched scale and innovation engine, driving robust revenue and margin expansion. Its rapid growth and improving profitability are impressive, yet the high valuation multiples require vigilance. It suits investors aiming for aggressive growth with tolerance for premium pricing.
Genuine Parts Company boasts a durable economic moat through its steady cash flow and efficient capital use. Its conservative leverage and solid dividend yield offer a safety cushion compared to Amazon’s riskier profile. It fits well within a GARP (Growth at a Reasonable Price) portfolio seeking stability and income.
If you prioritize high-growth potential and market leadership, Amazon is the compelling choice due to its expanding profitability and innovation momentum. However, if you seek better capital efficiency and income stability, Genuine Parts Company offers superior value creation with a more defensive stance. Both scenarios warrant careful risk assessment.
Disclaimer: Investment carries a risk of loss of initial capital. The past performance is not a reliable indicator of future results. Be sure to understand risks before making an investment decision.
Go Further
I encourage you to read the complete analyses of Amazon.com, Inc. and Genuine Parts Company to enhance your investment decisions: