Home > Comparison > Consumer Cyclical > AMZN vs EBAY
The strategic rivalry between Amazon.com, Inc. and eBay Inc. shapes the specialty retail sector’s competitive landscape. Amazon operates a vast, capital-intensive retail and cloud services empire, while eBay focuses on a lean, marketplace-driven platform connecting buyers and sellers. This analysis pits Amazon’s scale and diversification against eBay’s marketplace efficiency to assess which model delivers stronger risk-adjusted returns for a diversified portfolio.

Table of contents
Companies Overview
Amazon.com, Inc. and eBay Inc. stand as pivotal players shaping the specialty retail landscape globally.
Amazon.com, Inc.: The E-Commerce and Cloud Giant
Amazon dominates the specialty retail sector through its vast online and physical retail channels. Its core revenue engine combines product sales, third-party seller services, and Amazon Web Services (AWS), a leading cloud provider. In 2026, Amazon sharpens its focus on expanding AWS capabilities while enhancing its Prime membership ecosystem to deepen customer engagement.
eBay Inc.: The Global Online Marketplace
eBay operates a marketplace platform connecting buyers and sellers worldwide, generating revenue primarily through listing fees and transaction commissions. The company concentrates on refining its marketplace experience across digital and mobile channels, aiming to boost user engagement and streamline transaction processes in 2026.
Strategic Collision: Similarities & Divergences
Amazon and eBay both excel in e-commerce but diverge strategically. Amazon integrates closed ecosystems and cloud services, while eBay offers an open marketplace infrastructure. Their primary battleground lies in capturing online consumer spending and third-party seller loyalty. Investors encounter distinct profiles: Amazon’s expansive scale and diversified revenues contrast with eBay’s focused marketplace model and leaner operations.
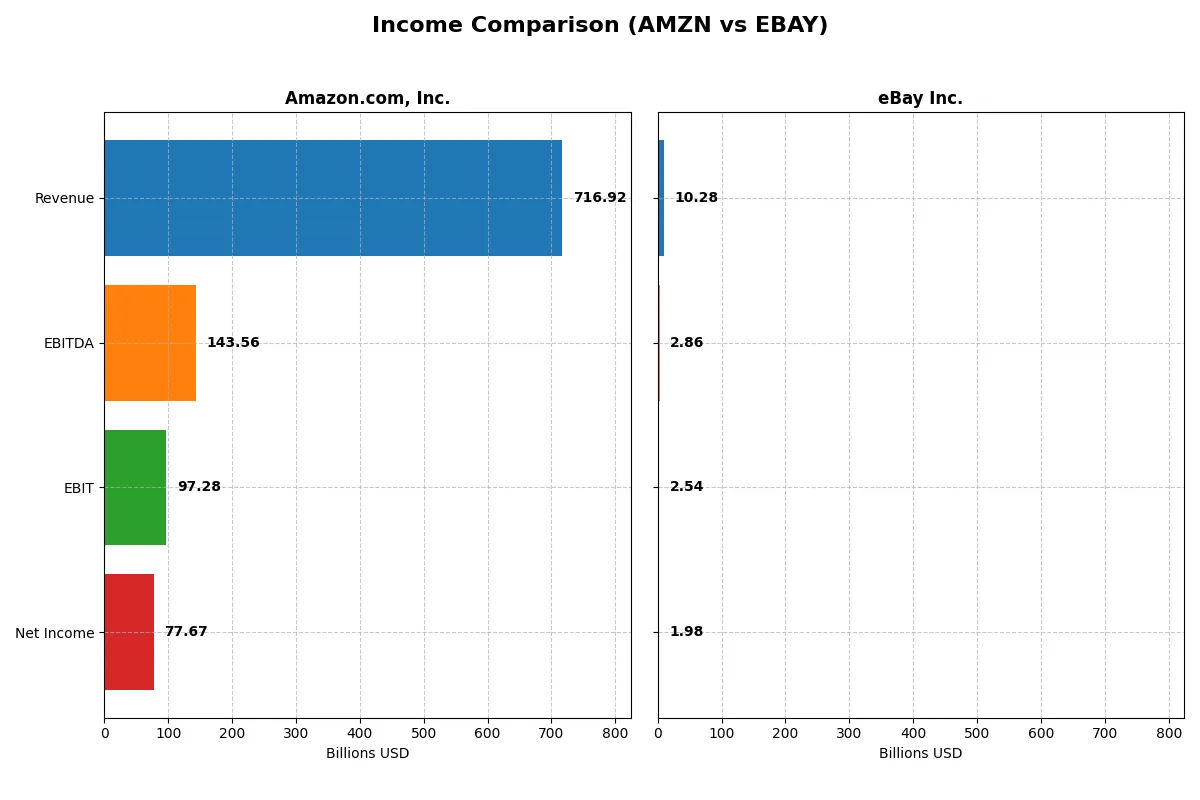
Income Statement Comparison
This data dissects the core profitability and scalability of both corporate engines to reveal who dominates the bottom line:
| Metric | Amazon.com, Inc. (AMZN) | eBay Inc. (EBAY) |
|---|---|---|
| Revenue | 717B | 10.3B |
| Cost of Revenue | 356B | 2.9B |
| Operating Expenses | 281B | 5.1B |
| Gross Profit | 361B | 7.4B |
| EBITDA | 144B | 2.9B |
| EBIT | 97.3B | 2.5B |
| Interest Expense | 2.3B | 0.3B |
| Net Income | 77.7B | 2.0B |
| EPS | 7.29 | 3.98 |
| Fiscal Year | 2025 | 2024 |
Income Statement Analysis: The Bottom-Line Duel
This income statement comparison reveals which company’s financial engine runs more efficiently through revenue growth and bottom-line profitability metrics.
Amazon.com, Inc. Analysis
Amazon’s revenue surged from $470B in 2021 to $717B in 2025, with net income expanding dramatically from $33B to $77.7B. Its gross margin holds strong above 50%, while net margin improved to 10.8%, signaling robust operational efficiency. The latest year showed accelerated EBIT growth of 37%, underscoring Amazon’s momentum in scaling profitably.
eBay Inc. Analysis
eBay’s revenue stayed nearly flat around $10B from 2020 to 2024, with net income declining from $5.7B in 2020 to $1.98B in 2024. Despite a high gross margin near 72% and a strong net margin of 19.2%, eBay’s profitability shrank recently, with EBIT falling 36% in the last year. This signals waning growth momentum and operational challenges.
Verdict: Growth Dynamo vs. Margin Specialist
Amazon dominates with rapid revenue and net income growth, fueled by expanding margins and operational scale. eBay offers stronger margins but struggles with stagnant revenue and shrinking profits. For investors prioritizing growth and improving profitability, Amazon’s profile clearly outshines eBay’s steady but declining earnings.
Financial Ratios Comparison
These vital ratios act as a diagnostic tool to expose the underlying fiscal health, valuation premiums, and capital efficiency of the companies compared below:
| Ratios | Amazon.com, Inc. (AMZN) | eBay Inc. (EBAY) |
|---|---|---|
| ROE | 18.9% | 38.3% |
| ROIC | 10.7% | 13.4% |
| P/E | 31.8 | 15.6 |
| P/B | 6.0 | 6.0 |
| Current Ratio | 1.05 | 1.24 |
| Quick Ratio | 0.88 | 1.24 |
| D/E | 0.37 | 1.52 |
| Debt-to-Assets | 18.7% | 40.6% |
| Interest Coverage | 35.2 | 8.95 |
| Asset Turnover | 0.88 | 0.53 |
| Fixed Asset Turnover | 2.01 | 6.08 |
| Payout ratio | 0 | 27.0% |
| Dividend yield | 0% | 1.73% |
| Fiscal Year | 2025 | 2024 |
Efficiency & Valuation Duel: The Vital Signs
Financial ratios act as a company’s DNA, exposing hidden risks and operational excellence crucial for investment decisions.
Amazon.com, Inc.
Amazon delivers solid profitability with an 18.9% ROE and a 10.8% net margin, signaling operational efficiency. However, its P/E ratio of 31.8 suggests the stock is stretched compared to market averages. Amazon returns no dividends, instead prioritizing heavy reinvestment in R&D and growth to fuel future expansion.
eBay Inc.
eBay boasts a stronger profitability profile with a 38.3% ROE and a 19.2% net margin, indicating robust operational efficiency. Its P/E ratio of 15.6 points to a more reasonable valuation. eBay pays a modest 1.73% dividend yield, offering more immediate shareholder returns alongside steady capital allocation.
Premium Valuation vs. Operational Safety
Amazon’s growth-oriented profile comes with a stretched valuation, while eBay offers higher profitability at a fairer price. For risk-tolerant investors seeking growth, Amazon’s reinvestment focus fits well. Conversely, eBay suits those favoring operational safety and consistent shareholder payouts.
Which one offers the Superior Shareholder Reward?
I compare Amazon.com, Inc. (AMZN) and eBay Inc. (EBAY) on their shareholder reward strategies in 2026. AMZN pays no dividends, focusing on reinvestment with a negligible free cash flow yield of 0.7% and capex-heavy expansion. EBAY balances a modest 1.7% dividend yield, a 27% payout, and a robust buyback program, supported by a strong free cash flow yield near 25%. EBAY’s disciplined capital allocation and consistent cash returns outperform AMZN’s growth reinvestment, offering a more sustainable and attractive total return profile for income-focused investors in 2026.
Comparative Score Analysis: The Strategic Profile
The radar chart illustrates the core DNA and strategic trade-offs of Amazon.com, Inc. and eBay Inc., highlighting their financial strengths and weaknesses:
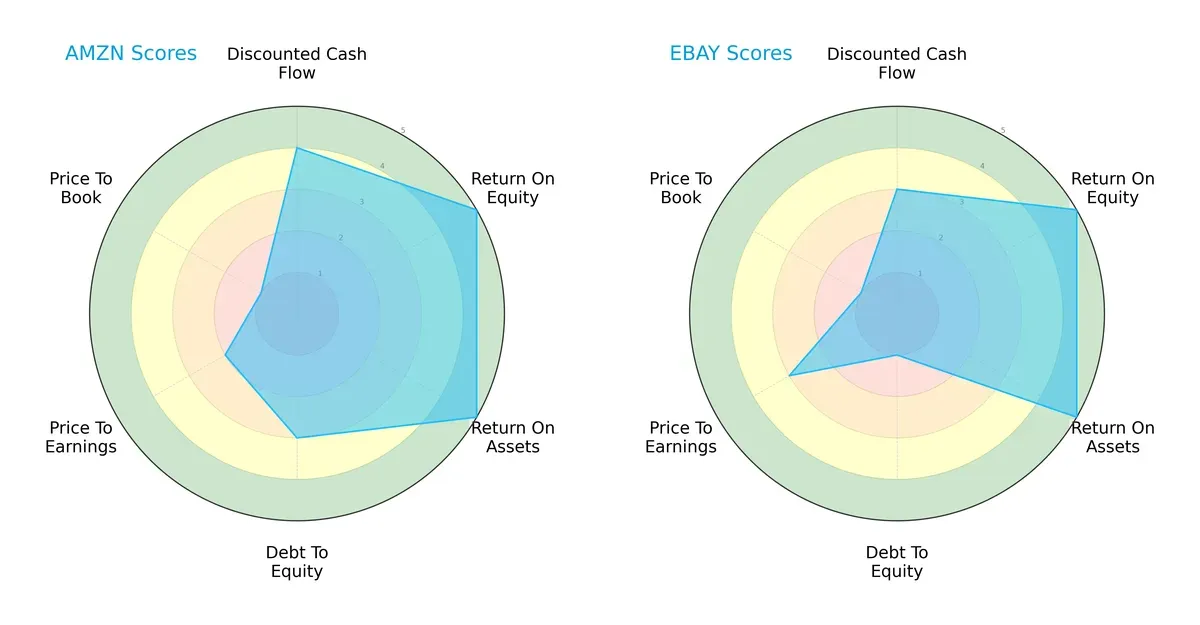
Amazon.com, Inc. delivers a more balanced profile with strong DCF (4), ROE (5), and ROA (5) scores, though its debt-to-equity score (3) is moderate. eBay Inc. matches Amazon in ROE (5) and ROA (5) but shows a weaker debt-to-equity score (1), signaling higher financial risk. Amazon’s valuation scores (P/E: 2, P/B: 1) lag, indicating potential overvaluation, while eBay fares slightly better on P/E (3). Amazon leans on operational efficiency and cash flow, whereas eBay depends more on asset returns but carries greater leverage risk.
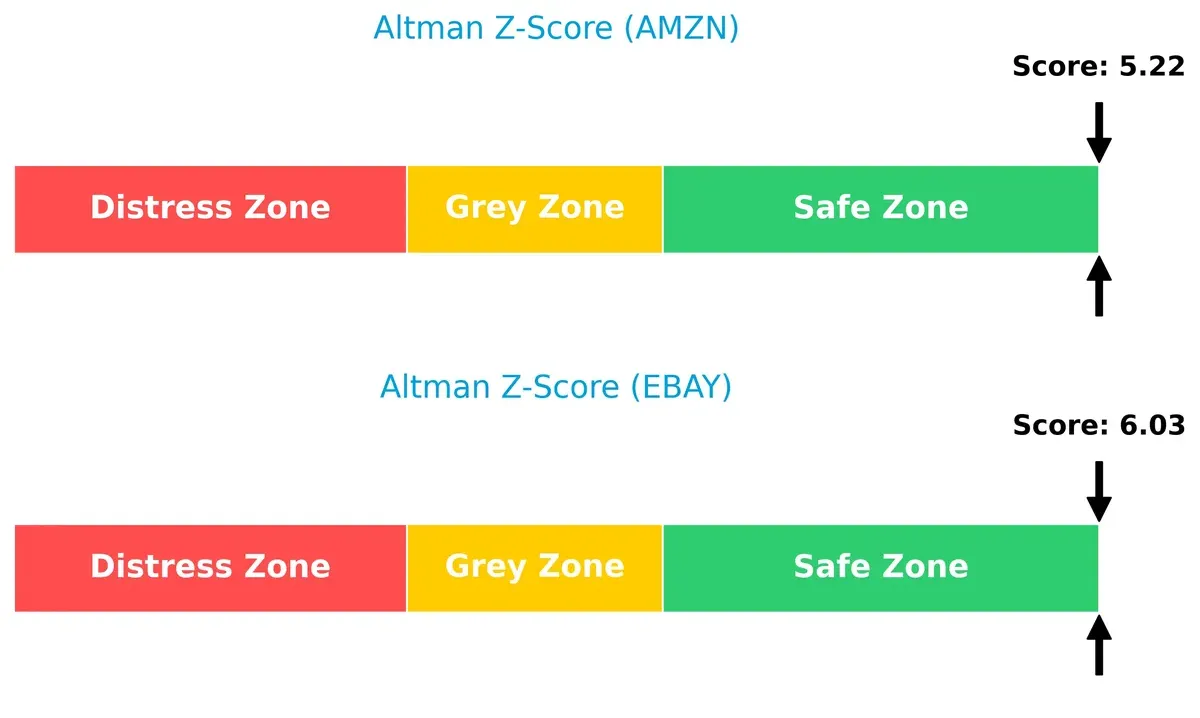
Bankruptcy Risk: Solvency Showdown
The Altman Z-Scores for Amazon (5.22) and eBay (6.03) both place them securely in the safe zone, underscoring strong solvency and low bankruptcy risk in today’s market cycle:
Financial Health: Quality of Operations
Amazon and eBay exhibit average Piotroski F-Scores of 5 and 6 respectively, reflecting moderate operational health without glaring financial red flags:
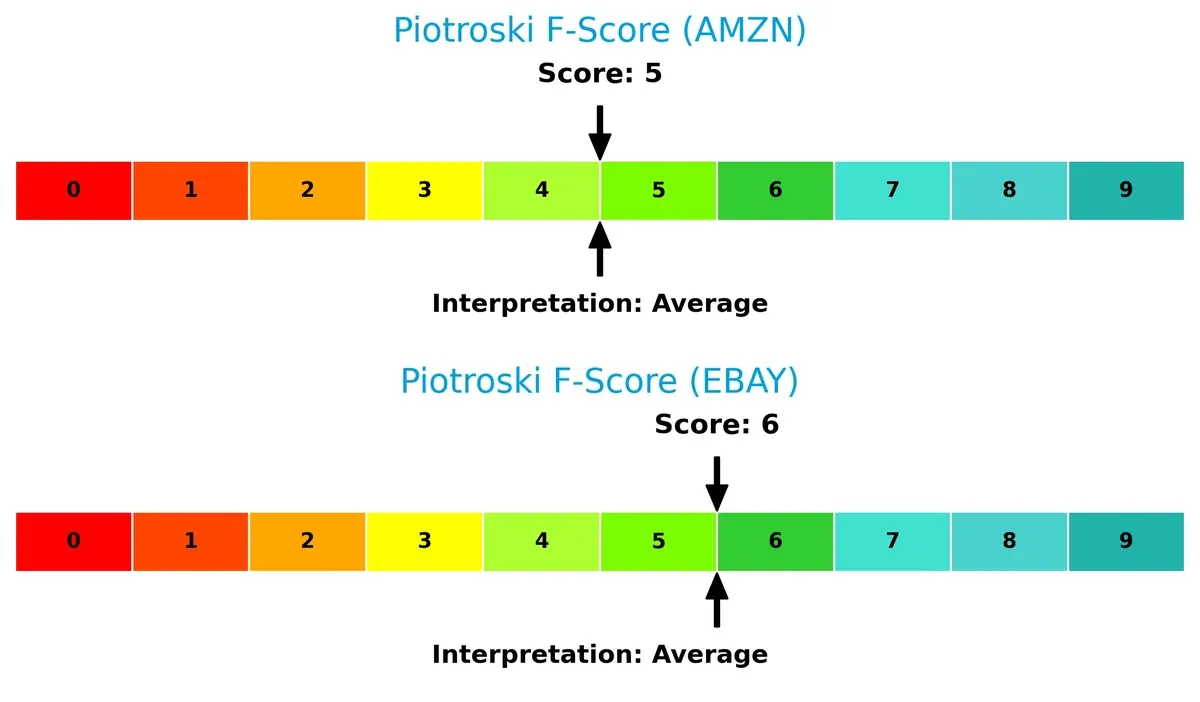
While neither firm is at peak financial strength, eBay’s slightly higher score suggests marginally better internal metrics and operational quality.
How are the two companies positioned?
This section dissects Amazon and eBay’s operational DNA by comparing their revenue distribution and internal dynamics. The goal is to confront their economic moats to reveal which model offers the most resilient, sustainable advantage today.
Revenue Segmentation: The Strategic Mix
This visual comparison dissects how Amazon.com, Inc. and eBay Inc. diversify their income streams and where their primary sector bets lie:
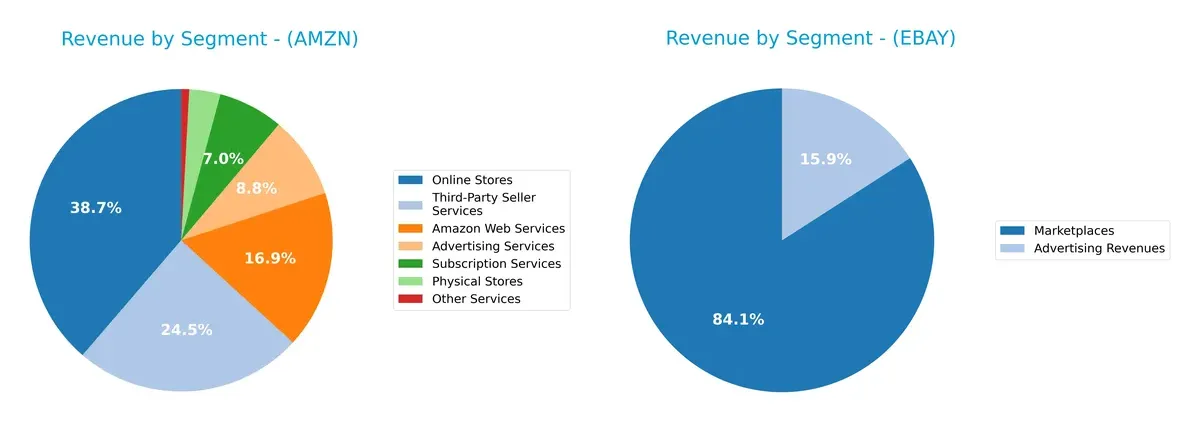
Amazon shows a highly diversified revenue base, with Online Stores at $247B anchoring its portfolio, followed by Third-Party Seller Services at $156B and AWS at $108B. eBay, by contrast, pivots heavily on a concentrated Marketplaces segment at $8.6B, with Advertising Revenues trailing at $1.6B. Amazon’s broad mix signals ecosystem lock-in and infrastructure dominance, while eBay’s narrower focus carries higher concentration risk but clearer operational leverage.
Strengths and Weaknesses Comparison
This table compares the Strengths and Weaknesses of Amazon and eBay based on diversification, profitability, financial health, innovation, global presence, and market share:
Amazon Strengths
- Highly diversified revenue streams across online stores, AWS, advertising, and subscriptions
- Strong global presence with significant North America and international sales
- Favorable net margin, ROE, and ROIC indicating efficient capital allocation
eBay Strengths
- Higher net margin and ROE reflecting profitability focus
- Favorable quick ratio and fixed asset turnover suggest operational efficiency
- Stable marketplace revenues with diversified geographic sales including China and Germany
Amazon Weaknesses
- High P/E and P/B ratios rated unfavorable, indicating expensive valuation
- Neutral liquidity ratios posing moderate short-term risk
- No dividend yield, limiting income appeal
eBay Weaknesses
- Elevated debt-to-equity ratio signaling higher leverage risk
- Unfavorable P/B ratio may imply overvaluation concerns
- Lower asset turnover relative to Amazon, suggesting less efficient use of assets
Amazon’s vast diversification and strong profitability contrast with eBay’s leaner but profitable business model. Amazon’s valuation metrics and liquidity require monitoring, while eBay’s higher leverage and asset efficiency warrant cautious analysis for strategic decisions.
The Moat Duel: Analyzing Competitive Defensibility
A structural moat alone protects long-term profits from relentless competitive erosion. Here is how Amazon and eBay defend their turf:
Amazon.com, Inc.: Scale-Driven Ecosystem Moat
Amazon’s primary moat stems from its vast ecosystem and network effects, supported by AWS and Prime membership. Its gross margin of 50% and growing ROIC reflect efficient capital use. In 2026, expansion into AI-driven logistics and international markets could deepen this moat, but fierce competition pressures margins.
eBay Inc.: Niche Marketplace & Cost Advantage
eBay relies on a cost-efficient marketplace model with high gross margin (72%) and strong EBIT margin (25%). Unlike Amazon’s scale, eBay’s moat comes from its streamlined operations and seller trust. Its ROIC well above WACC signals value creation. Future growth hinges on platform innovation and global expansion.
Verdict: Ecosystem Scale vs. Operational Efficiency
Amazon’s moat is broad, driven by network effects and diversified revenue streams. eBay’s moat is narrower but deeper, with superior ROIC and margin metrics. Amazon better defends market share through scale, while eBay excels at profitable niche dominance.
Which stock offers better returns?
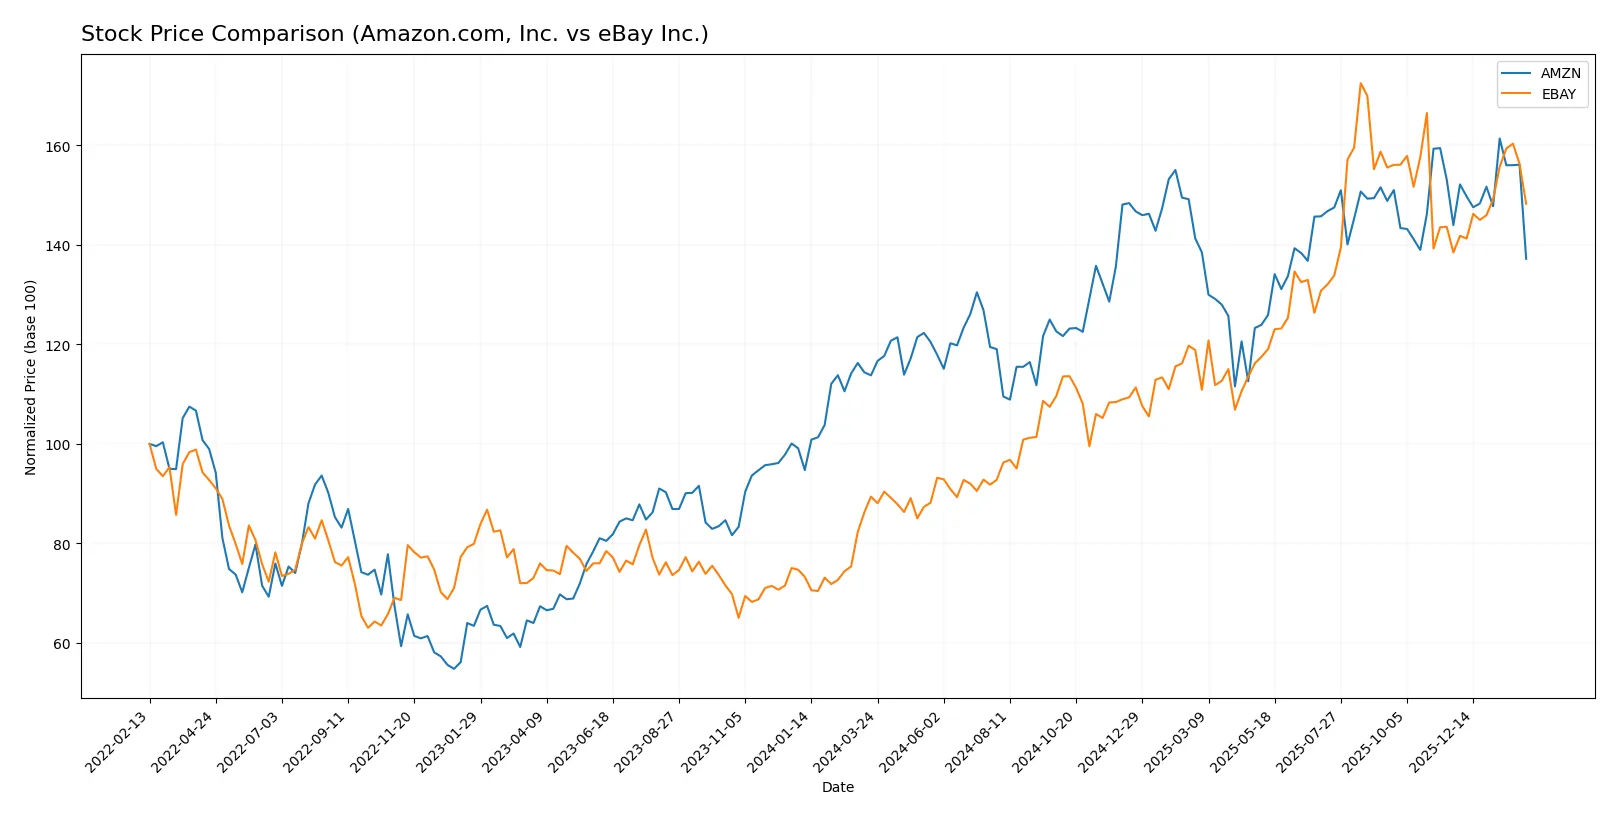
The past year shows Amazon’s shares rising overall by 20.58%, though recent months reflect a slight decline. eBay exhibits a stronger upward trajectory with accelerating gains and higher peak prices.
Trend Comparison
Amazon’s stock gained 20.58% over the past year, marking a bullish trend with decelerating momentum. It fluctuated between $166.94 and $247.38, showing moderate volatility (21.86 std dev).
eBay’s stock surged 65.8% over the same period, displaying a bullish trend with acceleration and less volatility (14.13 std dev). The price ranged from $49.65 to $100.7, reflecting strong upward momentum.
Comparing both, eBay significantly outperformed Amazon, delivering the highest market returns and accelerating gains over the past year.
Target Prices
Analysts show a bullish consensus for Amazon.com, Inc. and eBay Inc., with targets well above current prices.
| Company | Target Low | Target High | Consensus |
|---|---|---|---|
| Amazon.com, Inc. | 175 | 315 | 283.86 |
| eBay Inc. | 65 | 115 | 98 |
Amazon trades at $210, below its $284 consensus, indicating upside potential. eBay’s $86 price also lags its $98 consensus, suggesting room for growth.

Don’t Let Luck Decide Your Entry Point
Optimize your entry points with our advanced ProRealTime indicators. You’ll get efficient buy signals with precise price targets for maximum performance. Start outperforming now!
How do institutions grade them?
Institutional grades for Amazon.com, Inc. and eBay Inc. reflect current market views:
Amazon.com, Inc. Grades
The following table summarizes recent grades from reputable financial institutions for Amazon.com, Inc.:
| Grading Company | Action | New Grade | Date |
|---|---|---|---|
| BMO Capital | Maintain | Outperform | 2026-02-06 |
| Oppenheimer | Maintain | Outperform | 2026-02-06 |
| Wedbush | Maintain | Outperform | 2026-02-06 |
| Evercore ISI Group | Maintain | Outperform | 2026-02-06 |
| Argus Research | Maintain | Buy | 2026-02-06 |
| Telsey Advisory Group | Maintain | Outperform | 2026-02-06 |
| Piper Sandler | Maintain | Overweight | 2026-02-06 |
| Citizens | Maintain | Market Outperform | 2026-02-06 |
| RBC Capital | Maintain | Outperform | 2026-02-06 |
| Wells Fargo | Maintain | Overweight | 2026-02-06 |
eBay Inc. Grades
The table below shows recent institutional grades for eBay Inc.:
| Grading Company | Action | New Grade | Date |
|---|---|---|---|
| Citizens | Maintain | Market Outperform | 2026-01-28 |
| Morgan Stanley | Maintain | Overweight | 2026-01-13 |
| Wells Fargo | Maintain | Equal Weight | 2026-01-08 |
| Truist Securities | Maintain | Hold | 2025-11-03 |
| Needham | Maintain | Buy | 2025-10-30 |
| Piper Sandler | Maintain | Overweight | 2025-10-30 |
| Benchmark | Maintain | Buy | 2025-10-30 |
| Wells Fargo | Maintain | Equal Weight | 2025-10-30 |
| Cantor Fitzgerald | Maintain | Neutral | 2025-10-30 |
| UBS | Maintain | Neutral | 2025-10-30 |
Which company has the best grades?
Amazon.com, Inc. consistently receives Outperform and Buy ratings from top firms, signaling stronger institutional confidence. eBay’s grades vary more, ranging from Buy to Hold and Neutral, indicating a more cautious outlook. Investors may interpret Amazon’s higher consensus grades as a sign of better growth expectations and market positioning.
Risks specific to each company
The following categories identify critical pressure points and systemic threats facing Amazon.com, Inc. and eBay Inc. in the 2026 market environment:
1. Market & Competition
Amazon.com, Inc.
- Dominates specialty retail with vast scale but faces fierce competition from global e-commerce and cloud providers.
eBay Inc.
- Faces pressure from niche marketplaces and evolving consumer preferences; smaller scale limits competitive moats.
2. Capital Structure & Debt
Amazon.com, Inc.
- Maintains a conservative debt-to-equity ratio (0.37) and strong interest coverage, supporting financial stability.
eBay Inc.
- High debt leverage (debt/equity 1.52) raises financial risk despite adequate interest coverage.
3. Stock Volatility
Amazon.com, Inc.
- Beta of 1.385 implies above-market volatility, reflecting sensitivity to economic cycles and tech sector swings.
eBay Inc.
- Similar beta (1.38) indicates comparable volatility, but smaller market cap can amplify price swings.
4. Regulatory & Legal
Amazon.com, Inc.
- Global footprint exposes it to complex antitrust scrutiny and data privacy regulations.
eBay Inc.
- Regulatory risks exist but are less pronounced given narrower operational scale and scope.
5. Supply Chain & Operations
Amazon.com, Inc.
- Highly integrated supply chain offers scale advantages but is vulnerable to global disruptions.
eBay Inc.
- Relies on third-party sellers with less direct supply chain exposure, reducing operational risk but limiting control.
6. ESG & Climate Transition
Amazon.com, Inc.
- Faces intense pressure to reduce carbon footprint amid large logistics operations; recent sustainability initiatives underway.
eBay Inc.
- Smaller environmental footprint but must address governance and social responsibility to maintain brand trust.
7. Geopolitical Exposure
Amazon.com, Inc.
- Significant international revenue exposes it to trade tensions and geopolitical uncertainties.
eBay Inc.
- Moderate international presence reduces but does not eliminate geopolitical risks.
Which company shows a better risk-adjusted profile?
Amazon’s most impactful risk centers on regulatory and geopolitical exposure due to its scale and global reach. eBay’s greatest risk lies in its elevated financial leverage, heightening solvency concerns. Despite Amazon’s valuation concerns, it offers a stronger balance sheet and operational scale. eBay’s high debt and smaller scale increase vulnerability. Therefore, Amazon demonstrates a better risk-adjusted profile, supported by a robust Altman Z-score above 5 and strong interest coverage, while eBay’s leverage poses a material red flag.
Final Verdict: Which stock to choose?
Amazon’s superpower lies in its relentless growth engine and expanding profitability, fueled by scale and innovation. However, its premium valuation and modest current liquidity warrant caution. It fits well in an aggressive growth portfolio seeking exposure to a tech giant evolving beyond retail.
eBay boasts a durable moat through consistent value creation and strong free cash flow, supported by a lean cost structure. Compared to Amazon, it offers better margin safety but slower growth. It suits investors favoring GARP strategies focused on stable, cash-generative businesses.
If you prioritize scalable growth with improving profitability, Amazon is compelling due to its expanding ROIC and innovation-driven momentum. However, if you seek reliable value creation with less valuation risk, eBay offers better stability and a proven competitive moat. Both present valid scenarios based on your risk appetite and investment horizon.
Disclaimer: Investment carries a risk of loss of initial capital. The past performance is not a reliable indicator of future results. Be sure to understand risks before making an investment decision.
Go Further
I encourage you to read the complete analyses of Amazon.com, Inc. and eBay Inc. to enhance your investment decisions: