Home > Comparison > Consumer Cyclical > AMZN vs BBY
The strategic rivalry between Amazon.com, Inc. and Best Buy Co., Inc. shapes the trajectory of the Consumer Cyclical sector. Amazon dominates as a global, capital-intensive specialty retailer with a vast e-commerce and cloud services platform. Best Buy operates as a focused, high-touch specialty retailer with brick-and-mortar strength in technology products. This analysis will assess which model delivers superior risk-adjusted returns for diversified portfolios amid evolving retail dynamics.

Table of contents
Companies Overview
Amazon.com, Inc. and Best Buy Co., Inc. both shape the evolving landscape of specialty retail in North America.
Amazon.com, Inc.: Global E-commerce and Cloud Powerhouse
Amazon dominates specialty retail with a massive ecosystem spanning e-commerce and cloud computing. Its core revenue comes from product sales, third-party seller services, and Amazon Web Services (AWS). In 2026, Amazon strategically focuses on expanding AWS capabilities while enhancing its Prime membership to lock in consumer loyalty and grow digital content offerings.
Best Buy Co., Inc.: Leading Consumer Electronics Retailer
Best Buy commands a strong physical retail presence in North America, specializing in technology products and consumer electronics. It drives revenue through in-store sales, online platforms, and a suite of services like Geek Squad support and installation. Best Buy’s 2026 strategy centers on blending digital and physical retail experiences to sustain competitive advantage and expand its service portfolio.
Strategic Collision: Similarities & Divergences
Both companies compete fiercely in consumer technology, but Amazon pursues a broad digital ecosystem while Best Buy emphasizes a tactile, service-rich retail model. The battleground lies in capturing tech-savvy consumers seeking convenience versus personalized service. Their investment profiles diverge sharply—Amazon offers scalable cloud growth potential, whereas Best Buy provides stable retail cash flow with a focus on customer service excellence.
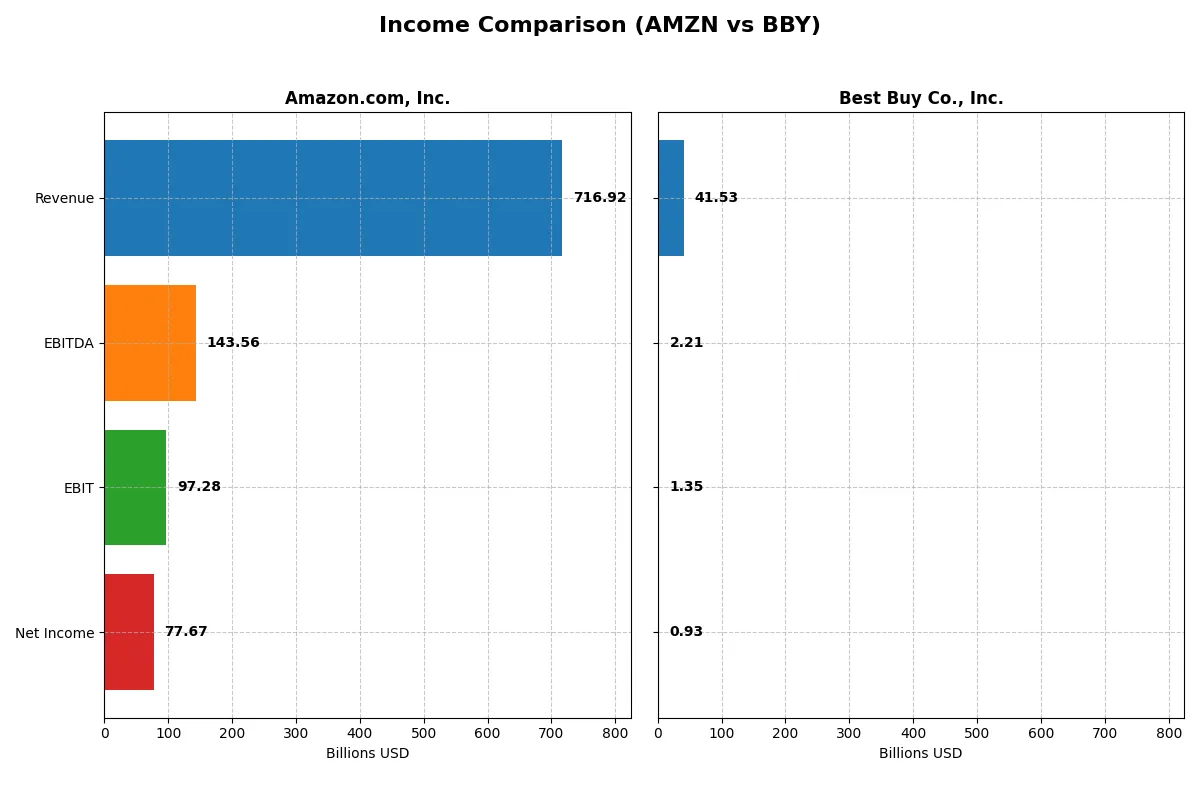
Income Statement Comparison
This data dissects the core profitability and scalability of both corporate engines to reveal who dominates the bottom line:
| Metric | Amazon.com, Inc. (AMZN) | Best Buy Co., Inc. (BBY) |
|---|---|---|
| Revenue | 717B | 41.5B |
| Cost of Revenue | 356.4B | 32.1B |
| Operating Expenses | 280.5B | 7.64B |
| Gross Profit | 360.5B | 9.39B |
| EBITDA | 143.6B | 2.21B |
| EBIT | 97.3B | 1.35B |
| Interest Expense | 2.27B | 51M |
| Net Income | 77.7B | 927M |
| EPS | 7.29 | 4.31 |
| Fiscal Year | 2025 | 2025 |
Income Statement Analysis: The Bottom-Line Duel
This income statement comparison unveils the true efficiency and profitability engines powering Amazon.com and Best Buy over recent years.
Amazon.com, Inc. Analysis
Amazon’s revenue surged from $470B in 2021 to $717B in 2025, with net income climbing from $33B to $77.7B. Its gross margin holds strong above 50%, reflecting robust pricing power and cost control. The net margin expanded to 10.8% in 2025, signaling improved operational leverage and accelerating profitability momentum.
Best Buy Co., Inc. Analysis
Best Buy’s revenue declined from $47.3B in 2021 to $41.5B in 2025, with net income dropping from $1.8B to $927M. Gross margin steadies near 22.6%, but net margin remains slim at 2.2%, showing limited profitability. The 2025 figures reveal weakening top-line and bottom-line growth, reflecting challenges in scaling and margin expansion.
Growth and Margin Dominance vs. Margin Compression
Amazon outperforms Best Buy decisively with robust revenue growth (53% over five years) and expanding net margins, whereas Best Buy faces contraction across key metrics. Amazon’s profile suits investors seeking growth and improving profitability. Best Buy’s profile signals caution amid margin pressure and shrinking earnings.
Financial Ratios Comparison
These vital ratios act as a diagnostic tool to expose the underlying fiscal health, valuation premiums, and capital efficiency of each company:
| Ratios | Amazon.com, Inc. (AMZN) | Best Buy Co., Inc. (BBY) |
|---|---|---|
| ROE | 18.9% | 33.0% |
| ROIC | 10.7% | 16.6% |
| P/E | 31.8 | 19.9 |
| P/B | 6.0 | 6.6 |
| Current Ratio | 1.05 | 1.03 |
| Quick Ratio | 0.88 | 0.39 |
| D/E | 0.37 | 1.44 |
| Debt-to-Assets | 18.7% | 27.4% |
| Interest Coverage | 35.2x | 33.7x |
| Asset Turnover | 0.88 | 2.81 |
| Fixed Asset Turnover | 2.01 | 8.38 |
| Payout ratio | 0% | 87.1% |
| Dividend yield | 0% | 4.37% |
| Fiscal Year | 2025 | 2025 |
Efficiency & Valuation Duel: The Vital Signs
Financial ratios serve as a company’s DNA, exposing both hidden risks and operational excellence through key metrics investors must decode.
Amazon.com, Inc.
Amazon demonstrates solid profitability with an 18.9% ROE and a strong 10.8% net margin, signaling efficient capital use. However, its valuation appears stretched at a 31.8 P/E and 6.0 P/B, reflecting market expectations for growth. The absence of dividends shifts focus to reinvestment, notably 15.1% of revenue in R&D, fueling innovation.
Best Buy Co., Inc.
Best Buy posts an impressive 33.0% ROE but a modest 2.2% net margin, suggesting high leverage in profitability. Its P/E of 19.9 is more moderate but paired with a high 6.6 P/B, indicating some valuation premium. The 4.4% dividend yield highlights shareholder returns, balancing its capital allocation between payouts and efficient asset turnover.
Premium Valuation vs. Operational Safety
Amazon’s higher profitability and reinvestment strategy come with valuation stretch and no dividends. Best Buy offers stronger ROE with dividends but lower margins and some financial leverage risks. Investors seeking growth may prefer Amazon’s profile; those valuing yield and operational efficiency might lean toward Best Buy.
Which one offers the Superior Shareholder Reward?
Amazon.com, Inc. (AMZN) does not pay dividends but plows free cash flow into growth and acquisitions, reflecting a reinvestment strategy. Its free cash flow per share is $0.7B in 2025, with minimal buybacks. Best Buy Co., Inc. (BBY) offers a 4.37% dividend yield in 2025, with an 87% payout ratio, supported by strong free cash flow of $6.5B per share and consistent buybacks. BBY’s distribution is sustainable, balancing dividends and buybacks, while AMZN prioritizes long-term value through reinvestment. I find BBY’s shareholder reward more attractive in 2026 due to its reliable income and capital return mix.
Comparative Score Analysis: The Strategic Profile
The radar chart reveals the fundamental DNA and trade-offs of Amazon.com, Inc. and Best Buy Co., Inc., highlighting their distinct financial strengths and valuation challenges:
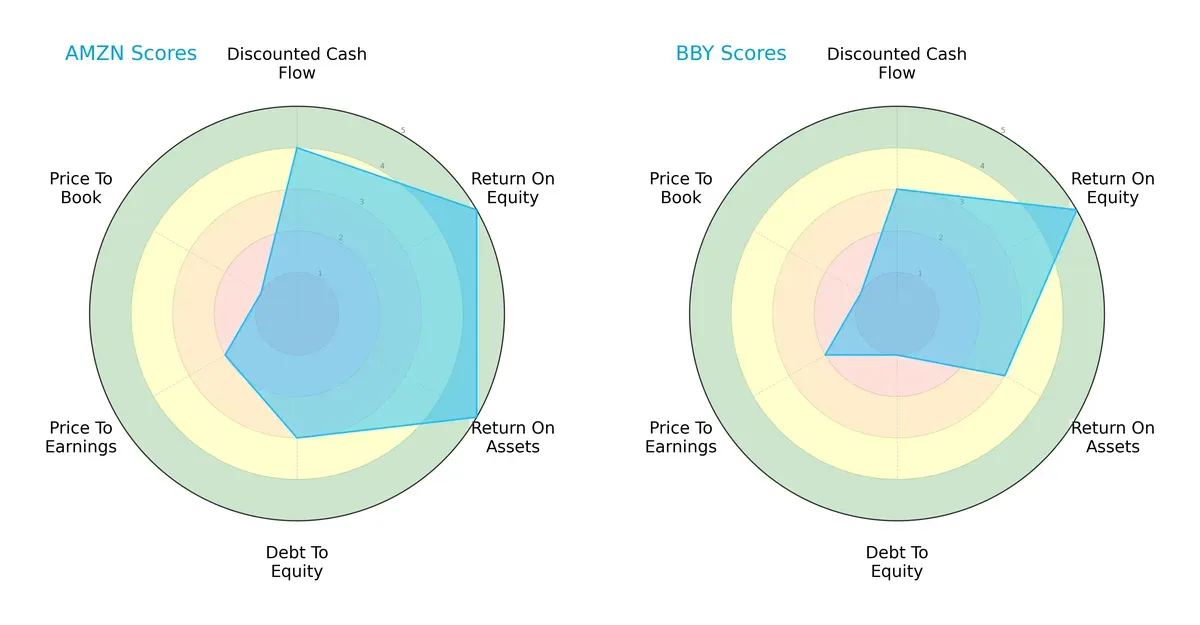
Amazon maintains a more balanced profile with strong ROE and ROA scores at 5 each, reflecting superior profitability and asset efficiency. Best Buy matches Amazon’s ROE at 5 but lags in ROA with a moderate 3. Amazon’s debt-to-equity score of 3 indicates moderate leverage, while Best Buy’s low score of 1 signals higher financial risk. Both firms suffer unfavorable price-to-earnings and price-to-book scores, suggesting valuation concerns, but Amazon’s higher discounted cash flow score (4 vs. 3) points to better growth prospects. Overall, Amazon leverages operational strength and moderate leverage, while Best Buy relies heavily on equity efficiency but carries greater balance sheet risk.
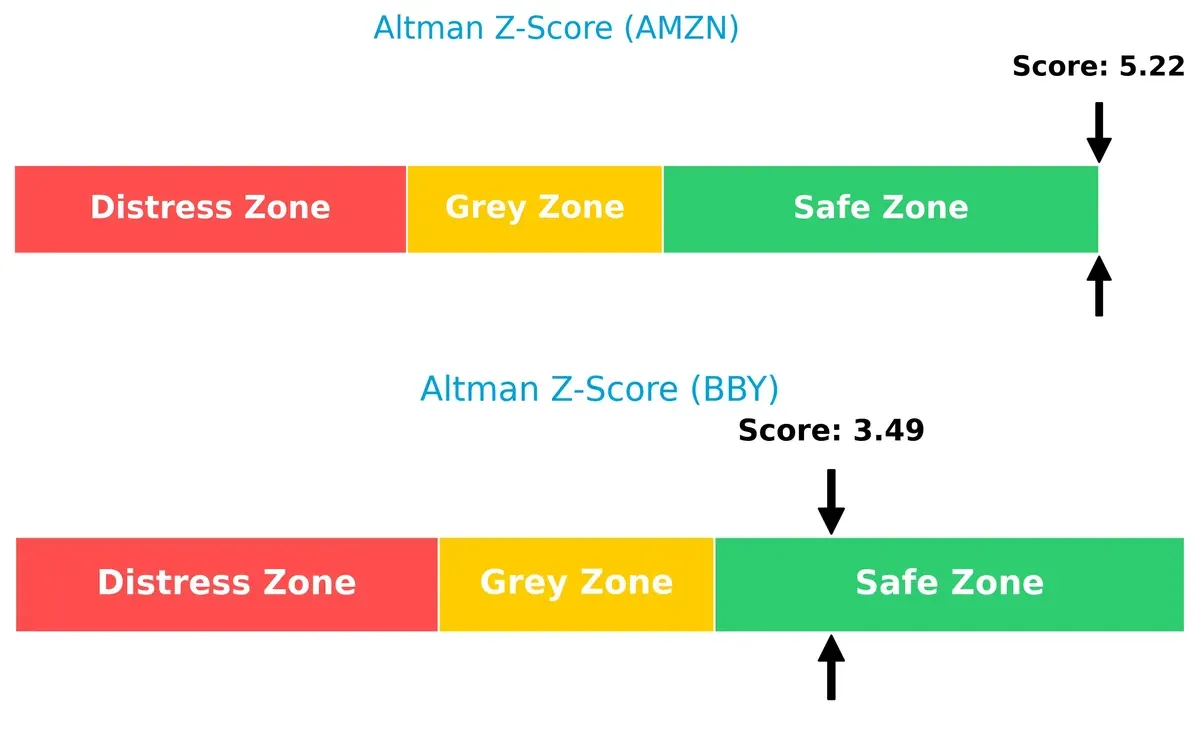
Bankruptcy Risk: Solvency Showdown
Amazon’s Altman Z-Score of 5.22 comfortably surpasses Best Buy’s 3.49, both residing in the safe zone but with a clear margin favoring Amazon’s long-term solvency:
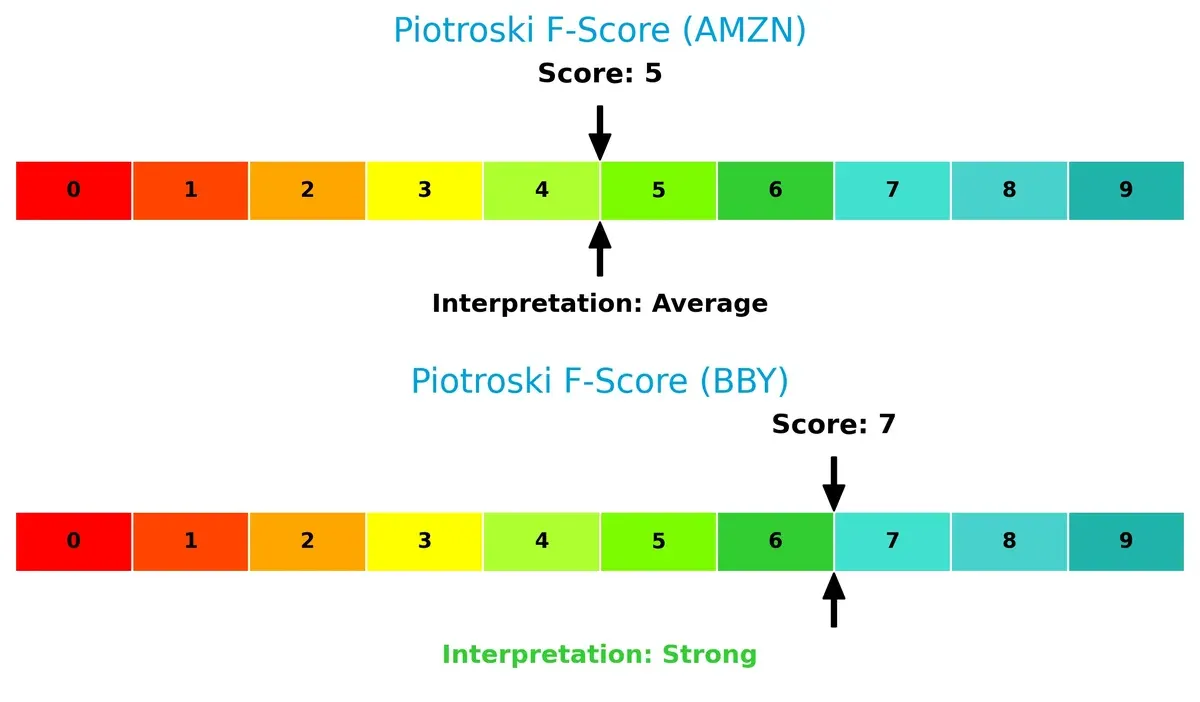
Financial Health: Quality of Operations
Best Buy scores a stronger 7 on the Piotroski F-Score, indicating robust internal financial health compared to Amazon’s average 5, which raises mild operational red flags:
How are the two companies positioned?
This section dissects Amazon and Best Buy’s operational DNA by comparing their revenue distribution and internal dynamics. It aims to confront their economic moats to identify which model offers the most resilient competitive advantage today.
Revenue Segmentation: The Strategic Mix
This visual comparison dissects how Amazon.com, Inc. and Best Buy Co., Inc. diversify their income streams and where their primary sector bets lie:
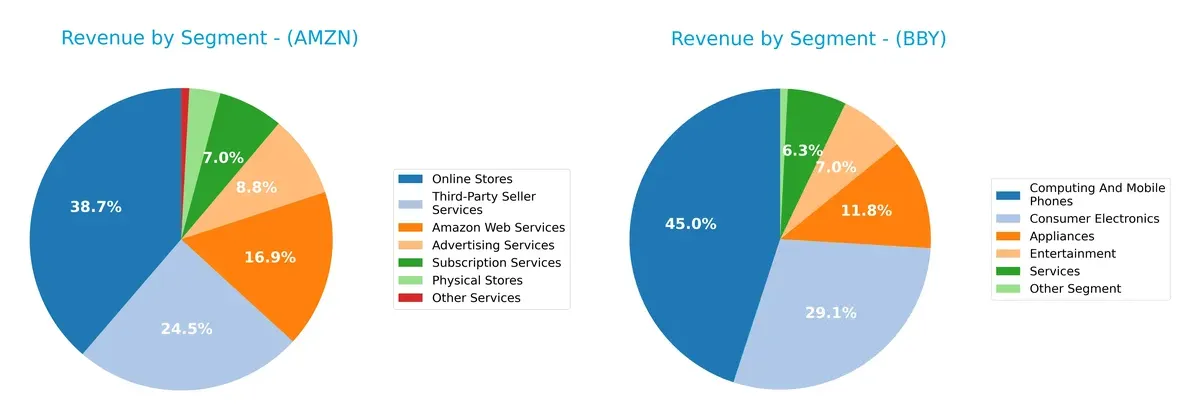
Amazon anchors its revenue in Online Stores ($247B) and Third-Party Seller Services ($156B), supplemented by AWS ($108B) and Advertising ($56B). Best Buy pivots mainly on Computing & Mobile Phones ($18.7B) and Consumer Electronics ($12.1B). Amazon’s diversified ecosystem reduces concentration risk and drives infrastructure dominance. Best Buy’s focus on fewer segments increases sector exposure but strengthens its retail specialization.
Strengths and Weaknesses Comparison
This table compares the Strengths and Weaknesses of Amazon and Best Buy based on diversification, profitability, financials, innovation, global presence, and market share:
Amazon Strengths
- Highly diversified revenue streams include AWS, advertising, and third-party services
- Strong net margin of 10.83% indicating operational efficiency
- Favorable ROE at 18.89%, showing solid shareholder returns
- Low debt-to-equity ratio of 0.37 reduces financial risk
- Extensive global presence with large North America and international sales
- Large market share in e-commerce and cloud services
Best Buy Strengths
- High ROE of 33.01% reflects excellent capital efficiency
- Robust ROIC of 16.61% above WACC at 9.05%, indicating value creation
- Favorable asset turnover ratios signal efficient asset use
- Solid dividend yield at 4.37% appeals to income investors
- Well-established presence in domestic market with growing international segment
- Focused product segments in consumer electronics and appliances
Amazon Weaknesses
- High P/E ratio of 31.83 suggests expensive valuation
- Unfavorable P/B of 6.01 may indicate overvaluation
- Neutral liquidity ratios with quick ratio below 1 could signal short-term risk
- No dividend yield limits income appeal
- Moderate asset turnover shows room for efficiency improvement
- Large reliance on North America segment may limit diversification
Best Buy Weaknesses
- Low net margin at 2.23% points to thin profitability
- High debt-to-equity ratio of 1.44 increases financial leverage risk
- Unfavorable quick ratio of 0.39 indicates potential liquidity issues
- P/B ratio of 6.58 signals possible overvaluation
- Smaller international footprint limits global exposure
- Lower revenue diversification compared to Amazon
Amazon leverages strong diversification and global scale to maintain profitability and financial strength. Best Buy excels in capital efficiency and dividend income but faces liquidity and margin pressures. Each company’s weaknesses suggest strategic priorities for financial and operational improvements.
The Moat Duel: Analyzing Competitive Defensibility
A structural moat is the only reliable shield protecting long-term profits from relentless competitive pressure. Let’s examine how two retail giants defend their turf:
Amazon.com, Inc.: Scale-Driven Ecosystem Moat
Amazon leverages vast scale and network effects, reflected in a rising ROIC and strong margin stability. Its expanding AWS and Prime services deepen this moat in 2026.
Best Buy Co., Inc.: Value-Added Service Moat
Best Buy relies on specialized services and customer trust, creating switching costs unlike Amazon’s scale. Its ROIC exceeds WACC but faces margin pressure and declining profitability trends.
Verdict: Scale Ecosystem vs. Service Differentiation
Amazon’s growing ROIC and diversified ecosystem grant it a wider, more sustainable moat. Best Buy creates value but struggles with shrinking profitability. Amazon is better positioned to defend market share.
Which stock offers better returns?
The past year saw Amazon.com, Inc. post strong gains despite recent deceleration, while Best Buy Co., Inc. faced a sustained decline with accelerating selling pressure.
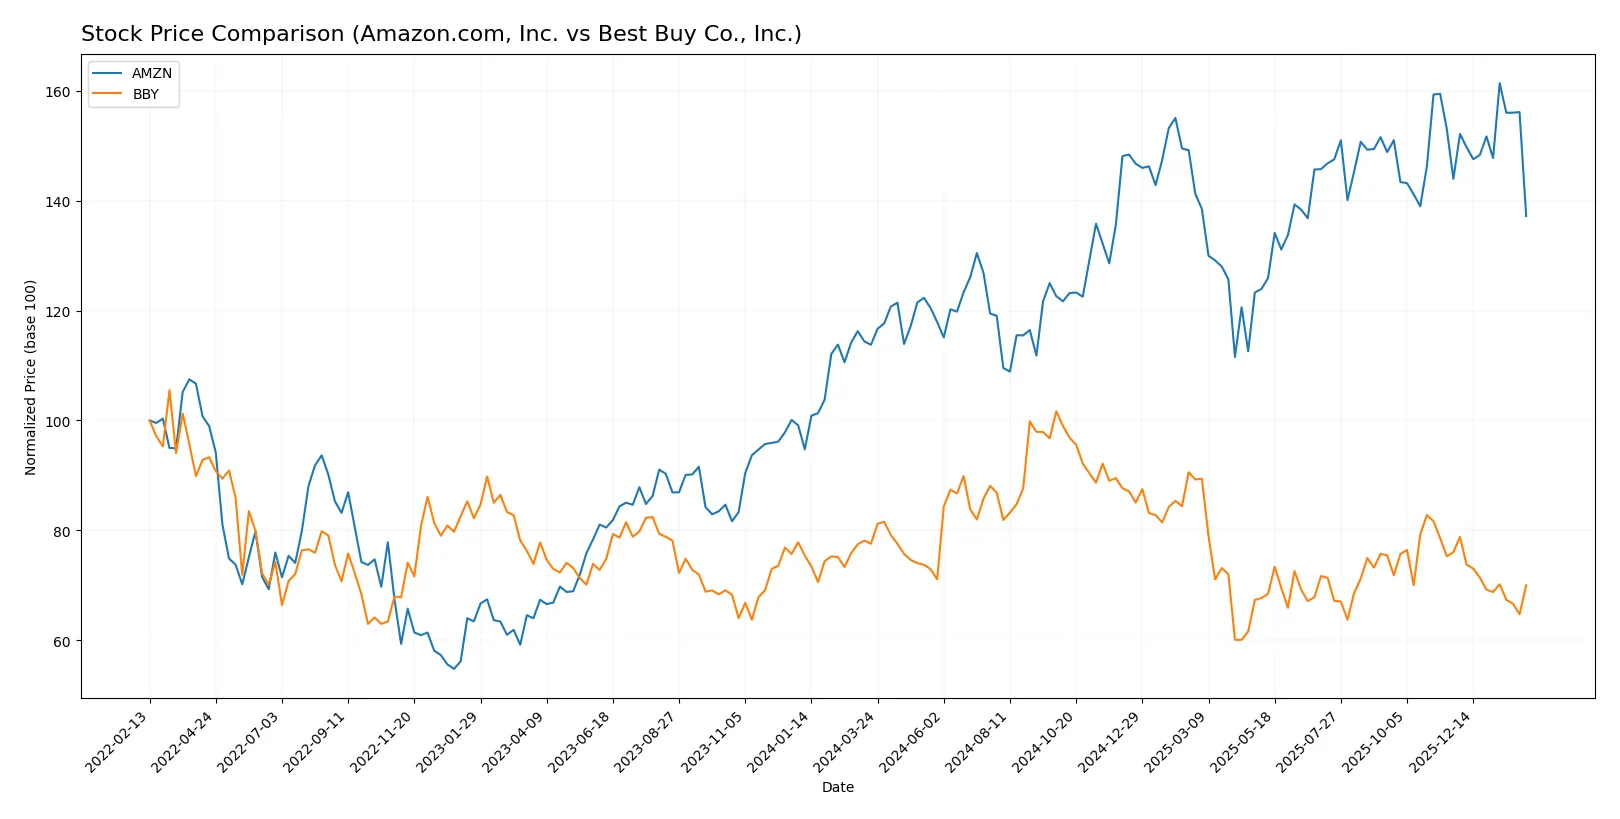
Trend Comparison
Amazon’s stock rose 20.58% over the past 12 months, marking a bullish trend with decelerating momentum and a high volatility of 21.86%. It peaked at 247.38 and bottomed at 166.94.
Best Buy’s shares fell 9.75% over the same period, confirming a bearish trend with decelerating losses and moderate volatility near 9.85%. Its price ranged from 60.43 to 102.26.
Amazon outperformed Best Buy clearly, delivering positive market returns versus Best Buy’s negative trend over the last year.
Target Prices
Analysts present a cautiously optimistic target consensus for Amazon.com, Inc. and Best Buy Co., Inc.
| Company | Target Low | Target High | Consensus |
|---|---|---|---|
| Amazon.com, Inc. | 175 | 315 | 283.86 |
| Best Buy Co., Inc. | 70 | 96 | 80.29 |
Amazon’s target consensus sits about 35% above its current price, reflecting growth confidence despite recent volatility. Best Buy’s targets hover near its current price, signaling moderate upside potential amid retail sector pressures.

Don’t Let Luck Decide Your Entry Point
Optimize your entry points with our advanced ProRealTime indicators. You’ll get efficient buy signals with precise price targets for maximum performance. Start outperforming now!
How do institutions grade them?
The following tables summarize the latest institutional grades for Amazon.com, Inc. and Best Buy Co., Inc.:
Amazon.com, Inc. Grades
This table shows recent grade updates from reputable financial institutions for Amazon.com, Inc.
| Grading Company | Action | New Grade | Date |
|---|---|---|---|
| BMO Capital | Maintain | Outperform | 2026-02-06 |
| Oppenheimer | Maintain | Outperform | 2026-02-06 |
| Wedbush | Maintain | Outperform | 2026-02-06 |
| Evercore ISI Group | Maintain | Outperform | 2026-02-06 |
| Argus Research | Maintain | Buy | 2026-02-06 |
| Telsey Advisory Group | Maintain | Outperform | 2026-02-06 |
| Piper Sandler | Maintain | Overweight | 2026-02-06 |
| Citizens | Maintain | Market Outperform | 2026-02-06 |
| RBC Capital | Maintain | Outperform | 2026-02-06 |
| Wells Fargo | Maintain | Overweight | 2026-02-06 |
Best Buy Co., Inc. Grades
This table presents recent institutional grades and changes for Best Buy Co., Inc.
| Grading Company | Action | New Grade | Date |
|---|---|---|---|
| Evercore ISI Group | Maintain | In Line | 2026-02-03 |
| JP Morgan | Downgrade | Neutral | 2026-02-02 |
| Truist Securities | Maintain | Hold | 2026-01-16 |
| Morgan Stanley | Maintain | Equal Weight | 2026-01-15 |
| Barclays | Maintain | Equal Weight | 2026-01-08 |
| Evercore ISI Group | Maintain | In Line | 2025-12-09 |
| Barclays | Maintain | Equal Weight | 2025-11-26 |
| Truist Securities | Maintain | Hold | 2025-11-26 |
| Morgan Stanley | Maintain | Equal Weight | 2025-11-26 |
| UBS | Maintain | Buy | 2025-11-26 |
Which company has the best grades?
Amazon.com, Inc. consistently receives strong “Outperform” and “Buy” grades from multiple top-tier firms. Best Buy Co., Inc. shows more mixed grades, including “Hold,” “Neutral,” and “Equal Weight.” This disparity may influence investor sentiment toward Amazon as the stronger-rated stock.
Risks specific to each company
The following categories identify the critical pressure points and systemic threats facing both firms in the 2026 market environment:
1. Market & Competition
Amazon.com, Inc.
- Dominates e-commerce and cloud, but faces intense global competition and margin pressure.
Best Buy Co., Inc.
- Faces stiff competition from online and big-box retailers, limiting pricing power and growth.
2. Capital Structure & Debt
Amazon.com, Inc.
- Maintains a conservative debt-to-equity ratio (0.37), ensuring manageable financial risk.
Best Buy Co., Inc.
- Carries higher leverage (1.44 debt-to-equity), raising concerns over financial flexibility.
3. Stock Volatility
Amazon.com, Inc.
- Beta at 1.385 indicates moderate sensitivity to market swings.
Best Buy Co., Inc.
- Slightly higher beta (1.469) suggests elevated stock price volatility.
4. Regulatory & Legal
Amazon.com, Inc.
- Faces regulatory scrutiny on antitrust and data privacy globally, a persistent headwind.
Best Buy Co., Inc.
- Regulatory risks are less pronounced but include compliance costs and data security.
5. Supply Chain & Operations
Amazon.com, Inc.
- Complex global supply chain vulnerable to disruptions but benefits from scale and logistics expertise.
Best Buy Co., Inc.
- More limited supply chain, exposed to tech product shortages and retail inventory risks.
6. ESG & Climate Transition
Amazon.com, Inc.
- Invests heavily in renewable energy and carbon reduction but faces criticism over labor practices.
Best Buy Co., Inc.
- Improving ESG profile with focus on sustainable products and waste reduction, yet limited scale.
7. Geopolitical Exposure
Amazon.com, Inc.
- Significant international exposure subjects it to currency, trade, and political risks.
Best Buy Co., Inc.
- Primarily North American operations reduce geopolitical complexity but limit growth avenues.
Which company shows a better risk-adjusted profile?
Amazon’s key risk is regulatory scrutiny amid its global dominance, while Best Buy’s leverage and operational vulnerability stand out. Amazon’s balanced capital structure and scale provide a more resilient risk-adjusted profile. Best Buy’s higher financial leverage and lower margins raise caution despite a stronger Piotroski score. The widening gap in debt-to-equity ratios (0.37 vs. 1.44) underscores my concern about Best Buy’s financial risk.
Final Verdict: Which stock to choose?
Amazon’s superpower lies in its unmatched scale and innovation-driven growth engine. Its expanding profitability and growing ROIC suggest rising efficiency. A point of vigilance remains its premium valuation multiples, which could pressure returns if growth slows. Amazon suits aggressive growth portfolios aiming for long-term capital appreciation.
Best Buy’s strategic moat is its high return on invested capital well above cost, signaling strong value creation despite shrinking profitability. Its solid dividend yield and favorable cash flow metrics add a safety cushion compared to Amazon. Best Buy fits well in GARP portfolios seeking stable income with moderate growth potential.
If you prioritize dynamic growth and market leadership, Amazon is the compelling choice due to its innovation and improving profitability. However, if you seek income stability and value creation with a margin of safety, Best Buy offers better stability despite recent operational challenges. Both present slightly favorable fundamentals but cater to distinct investor profiles.
Disclaimer: Investment carries a risk of loss of initial capital. The past performance is not a reliable indicator of future results. Be sure to understand risks before making an investment decision.
Go Further
I encourage you to read the complete analyses of Amazon.com, Inc. and Best Buy Co., Inc. to enhance your investment decisions: