Home > Comparison > Consumer Defensive > PM vs MO
The strategic rivalry between Philip Morris International Inc. and Altria Group, Inc. defines the current trajectory of the tobacco sector. Philip Morris operates as a global innovator, advancing smoke-free products across 71 international markets. Altria focuses on a traditional U.S.-centric tobacco portfolio with strong cigarette and oral nicotine sales. This analysis will evaluate which business model offers a superior risk-adjusted return, guiding portfolio allocations amid evolving industry dynamics.
Table of contents
Companies Overview
Philip Morris International and Altria Group dominate the tobacco industry with distinct geographic and product strategies.
Philip Morris International Inc.: Global Tobacco Innovator
Philip Morris International commands a leading position outside the U.S. with a portfolio focused on cigarettes and smoke-free products. Its core revenue derives from sales of heat-not-burn, vapor, and oral nicotine products in 71 international markets. The company’s 2026 strategy aggressively centers on delivering a smoke-free future by expanding its reduced-risk product offerings.
Altria Group, Inc.: U.S. Tobacco Powerhouse
Altria Group stands as a major U.S. tobacco manufacturer with a portfolio including cigarettes, cigars, and smokeless tobacco. It generates revenue primarily from Marlboro cigarettes and oral nicotine pouches sold through wholesalers and retail chains across the United States. Altria’s strategic focus remains on consolidating its domestic market share while growing its oral nicotine product segment.
Strategic Collision: Similarities & Divergences
Both companies rely on strong brand portfolios and tobacco product sales but diverge on geographic scope—Philip Morris targets international markets, while Altria dominates domestically. Their primary battleground lies in the evolving reduced-risk product category, pivotal for future growth. Investors face distinct profiles: Philip Morris pursues global innovation, while Altria emphasizes U.S. market strength and steady cash flow.
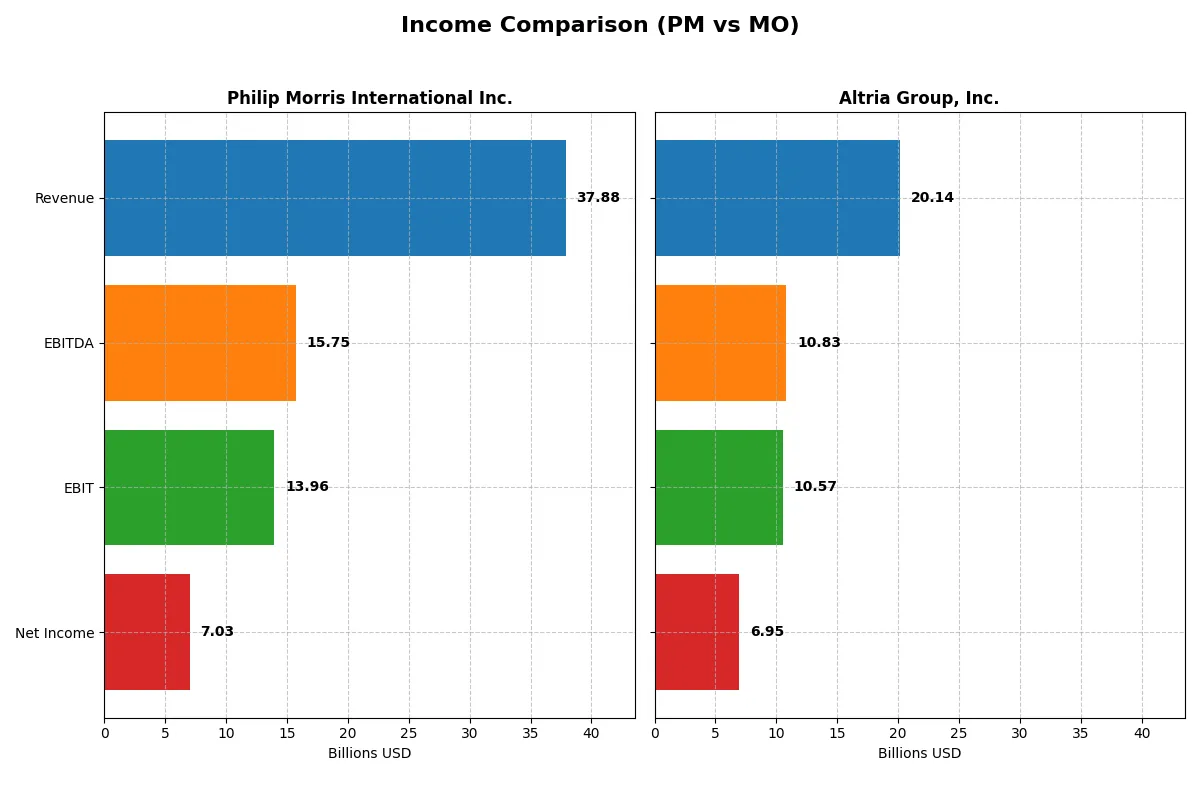
Income Statement Comparison
This data dissects the core profitability and scalability of both corporate engines to reveal who dominates the bottom line:
| Metric | Philip Morris International Inc. (PM) | Altria Group, Inc. (MO) |
|---|---|---|
| Revenue | 37.9B | 20.1B |
| Cost of Revenue | 13.3B | 2.7B |
| Operating Expenses | 11.1B | 2.4B |
| Gross Profit | 24.5B | 17.4B |
| EBITDA | 15.7B | 10.8B |
| EBIT | 14.0B | 10.6B |
| Interest Expense | 1.8B | 1.2B |
| Net Income | 7.0B | 6.9B |
| EPS | 4.53 | 4.11 |
| Fiscal Year | 2024 | 2025 |
Income Statement Analysis: The Bottom-Line Duel
This income statement comparison exposes which company runs its business more efficiently and rewards investors with superior profitability.
Philip Morris International Inc. Analysis
Philip Morris shows a steady revenue rise from 29B in 2020 to nearly 38B in 2024, though net income dipped to 7B in 2024 from highs near 9B earlier. Its gross margin consistently exceeds 64%, reflecting strong cost control. However, net margin slipped to 18.6%, signaling margin pressure despite healthy operating income growth.
Altria Group, Inc. Analysis
Altria’s revenue declined slightly from 21B in 2021 to 20B in 2025, yet net income surged to 11.3B in 2024 before falling to 6.9B in 2025. Its gross margin impressively reached 86.6% in 2025, with a top-tier net margin of 34.5%. The company’s profitability profile shows volatility but outstanding margin leverage overall.
Margin Dominance vs. Revenue Momentum
Altria outperforms Philip Morris in margin efficiency, boasting a net margin nearly double PM’s 2024 figure. Philip Morris leads in revenue growth but struggles to convert sales into net profits consistently. For investors prioritizing margin resilience over top-line scale, Altria’s leaner cost structure and profit generation present a more compelling profile.
Financial Ratios Comparison
These vital ratios act as a diagnostic tool to expose the underlying fiscal health, valuation premiums, and capital efficiency of the two companies:
| Ratios | Philip Morris International Inc. (PM) | Altria Group, Inc. (MO) |
|---|---|---|
| ROE | -59.9% (2024) | -198.4% (2025) |
| ROIC | 25.4% (2024) | 42.9% (2025) |
| P/E | 26.6 (2024) | 13.9 (2025) |
| P/B | -15.9 (2024) | -27.6 (2025) |
| Current Ratio | 0.88 (2024) | 0.61 (2025) |
| Quick Ratio | 0.47 (2024) | 0.49 (2025) |
| D/E (Debt-to-Equity) | -3.9 (2024) | -7.3 (2025) |
| Debt-to-Assets | 74.0% (2024) | 73.4% (2025) |
| Interest Coverage | 7.6x (2024) | 12.8x (2025) |
| Asset Turnover | 0.61 (2024) | 0.58 (2025) |
| Fixed Asset Turnover | 5.18 (2024) | 11.8 (2025) |
| Payout ratio | 116.5% (2024) | 100.2% (2025) |
| Dividend yield | 4.38% (2024) | 7.20% (2025) |
| Fiscal Year | 2024 | 2025 |
Efficiency & Valuation Duel: The Vital Signs
Financial ratios serve as a company’s DNA, unveiling hidden operational strengths and risks that shape investment outcomes.
Philip Morris International Inc.
Philip Morris shows a strong net margin of 18.57% and a favorable ROIC of 25.44%, signaling operational efficiency. However, its P/E ratio at 26.59 suggests the stock is somewhat expensive. The dividend yield stands at a healthy 4.38%, rewarding shareholders consistently despite a negative ROE, reflecting capital intensity and depreciation effects.
Altria Group, Inc.
Altria posts a robust net margin of 34.5% and an impressive ROIC of 42.95%, highlighting superior profitability and capital use. Its P/E ratio of 13.92 indicates a more attractive valuation. Altria offers a solid dividend yield of 7.2%, providing strong income, although its deeply negative ROE points to leverage and accounting challenges.
Valuation Discipline vs. Profitability Power
Both companies demonstrate favorable operational metrics and manageable risks, but Altria’s lower valuation and higher dividend yield offer a better risk-reward balance. Philip Morris suits investors focusing on steady dividend growth, while Altria appeals to those seeking income combined with operational strength.
Which one offers the Superior Shareholder Reward?
Philip Morris International (PM) and Altria Group (MO) both prioritize shareholder returns but differ sharply in approach. PM delivers a dividend yield near 4.4% with payout ratios slightly above 100%, signaling a full payout of free cash flow. Its buyback intensity is moderate, supporting total returns but constrained by leverage. MO offers a higher dividend yield around 7.2% to 9.5%, with more variable payout ratios between 60% and 115%, reflecting more aggressive capital distribution. MO’s buyback program is robust, boosting shareholder value alongside dividends. I observe MO’s model as more sustainable in 2026, driven by stronger free cash flow coverage and superior buyback efficiency. For investors seeking total return, MO’s blend of yield and buybacks outpaces PM’s steadier but less dynamic payouts.
Comparative Score Analysis: The Strategic Profile
The radar chart reveals the fundamental DNA and trade-offs of Philip Morris International and Altria Group, highlighting their core financial strengths and weaknesses:
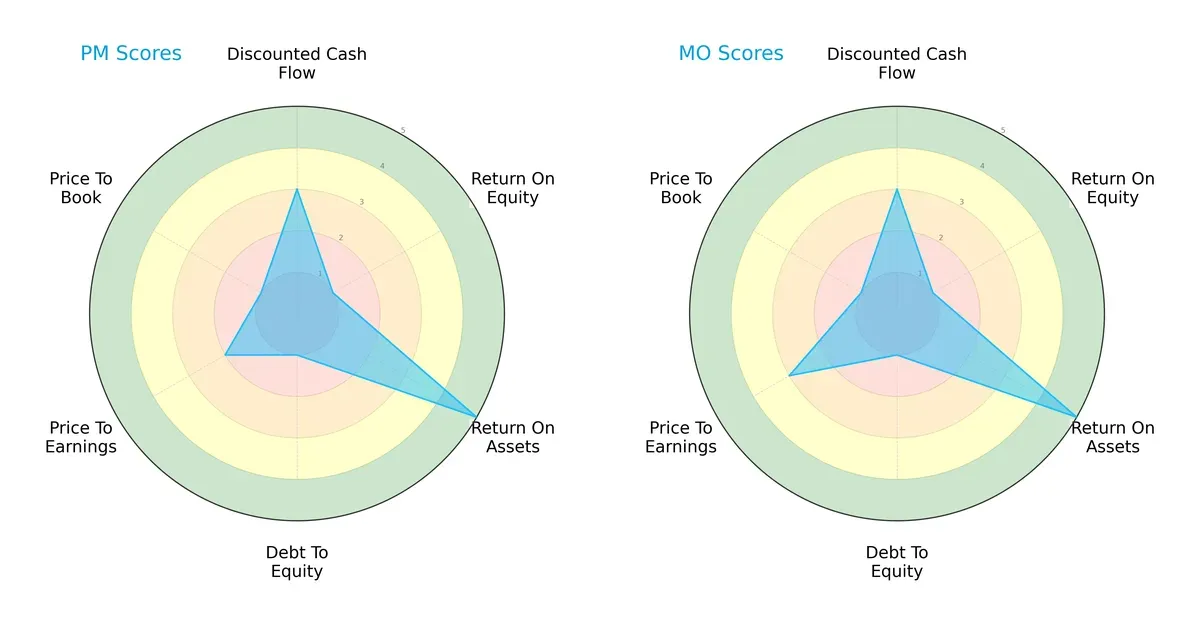
Both companies share a moderately balanced overall score of 2 and a neutral DCF score of 3, indicating similar valuation outlooks. Each has a very unfavorable return on equity and debt-to-equity score of 1, suggesting heavy leverage and weak equity returns. However, both excel in return on assets with a score of 5, reflecting efficient asset utilization. Altria edges Philip Morris on price-to-earnings valuation with a 3 versus 2, signaling relatively better market pricing. Neither company shows strength in price-to-book metrics, scoring 1 each, highlighting valuation risks. Overall, Altria demonstrates a slightly more balanced valuation strategy, while Philip Morris relies more on asset efficiency as its competitive edge.
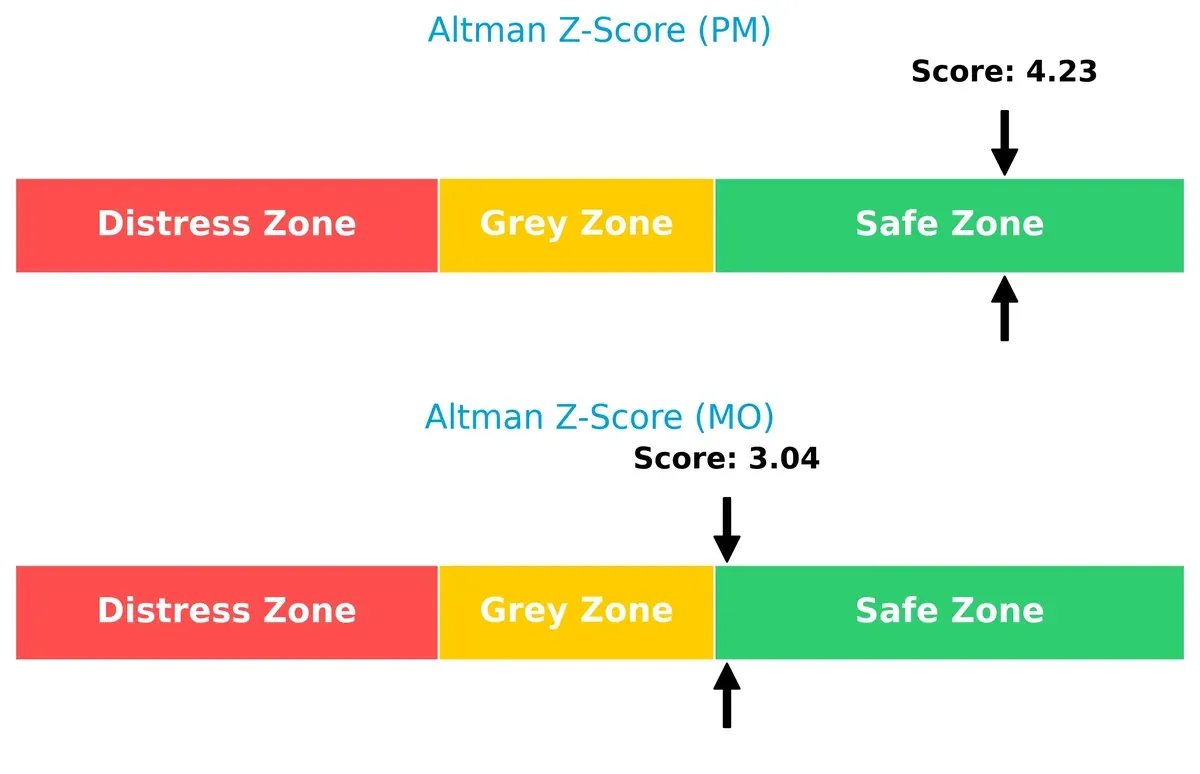
Bankruptcy Risk: Solvency Showdown
Philip Morris posts a stronger Altman Z-Score of 4.23 compared to Altria’s 3.04, both safely above the distress threshold, indicating resilient solvency positions in this late-cycle environment:
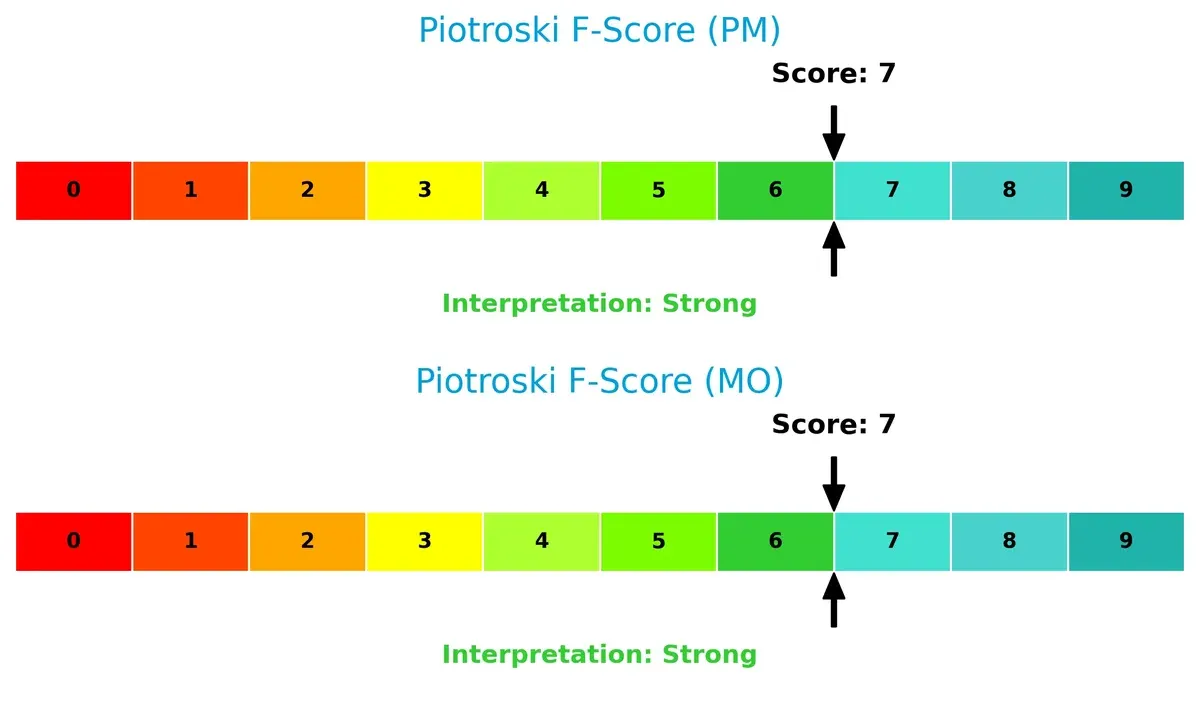
Financial Health: Quality of Operations
Both Philip Morris and Altria achieve strong Piotroski F-Scores of 7, signaling robust internal financial health and operational quality without immediate red flags:
How are the two companies positioned?
This section dissects PM and MO’s operational DNA by comparing revenue distribution and internal strengths and weaknesses. The goal is to confront their economic moats and identify which offers a more resilient, sustainable competitive advantage today.
Revenue Segmentation: The Strategic Mix
This visual comparison dissects how Philip Morris International Inc. and Altria Group, Inc. diversify their income streams and where their primary sector bets lie:
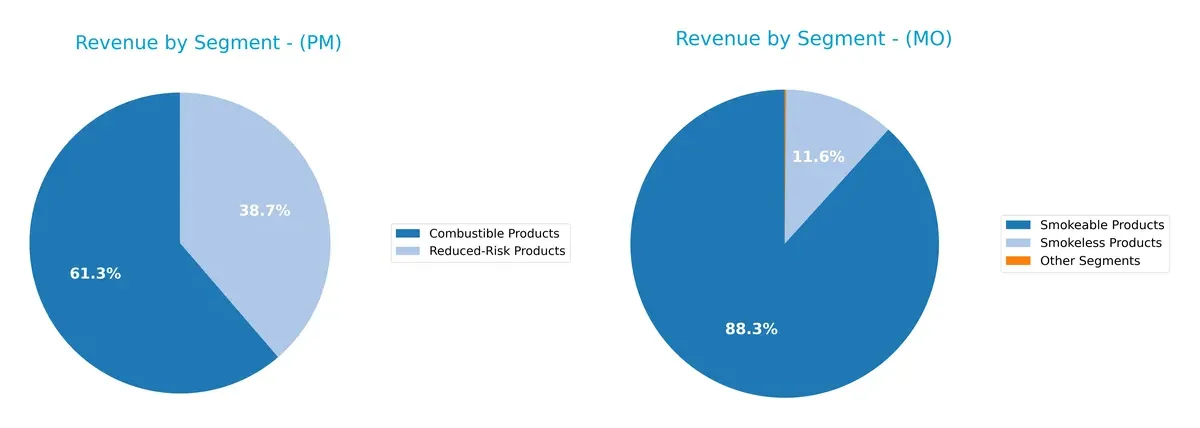
Philip Morris leans heavily on Combustible Products, generating $23.2B in 2024, while Reduced-Risk Products contribute $14.7B. Altria’s revenue is more concentrated, anchored by Smokeable Products at $21.2B, with smaller contributions from Smokeless Products ($2.8B) and Other Segments ($38M). Philip Morris’s dual focus signals a strategic pivot toward innovation and ecosystem lock-in, whereas Altria’s reliance on smokeables exposes it to concentration risk amid shifting consumer preferences.
Strengths and Weaknesses Comparison
This table compares the strengths and weaknesses of Philip Morris International Inc. and Altria Group, Inc.:
Philip Morris International Inc. Strengths
- Strong RoIC at 25.44% versus WACC of 5.34%
- Favorable net margin of 18.57%
- High dividend yield at 4.38%
- Robust fixed asset turnover of 5.18
- Diverse revenue from combustible and reduced-risk products
- Global presence with significant EU and Asia sales
Altria Group, Inc. Strengths
- Superior net margin of 34.5%
- Higher RoIC at 42.95% with favorable WACC at 5.63%
- Favorable PE of 13.92 indicating relative valuation strength
- High fixed asset turnover at 11.78
- Diverse product mix including smokeless and wine segments
- Stronger dividend yield near 7.2% (neutral status)
Philip Morris International Inc. Weaknesses
- Negative ROE at -59.86% signals shareholder value erosion
- Low current and quick ratios below 1 signal liquidity risk
- High debt to assets at 73.96% indicates leverage concerns
- Unfavorable PE ratio at 26.59
- Lower net margin compared to MO
- Negative PB value may reflect market skepticism
Altria Group, Inc. Weaknesses
- Negative ROE at -198.37% is a major red flag
- Very low liquidity ratios with current ratio at 0.61
- High debt to assets at 73.42% also signals leverage risk
- Dividend yield only neutral despite high profitability
- Smaller geographic reach without disclosed international revenue
Both companies demonstrate strong capital returns and profitability with significant leverage risks and low liquidity. PM benefits from broader global diversification, while MO shows superior profitability metrics but with concentrated geographic exposure. These contrasts shape each company’s strategic positioning in a mature, regulated industry.
The Moat Duel: Analyzing Competitive Defensibility
A structural moat is the sole barrier protecting long-term profits from competitive erosion. Let’s dissect the moat dynamics of two tobacco giants:
Philip Morris International Inc.: Innovation-Driven Intangible Assets
Philip Morris leverages strong brand equity and smoke-free product innovation. Its moat shows in stable margins (EBIT ~37%) and a 20% ROIC premium over WACC, though ROIC is declining. New markets and heat-not-burn tech could deepen this edge if execution holds.
Altria Group, Inc.: Operational Efficiency and Brand Loyalty
Altria excels with superior cost advantage and brand dominance in the U.S. It commands an exceptional 52% EBIT margin and a growing ROIC 37% above WACC, signaling robust value creation. Expansion into oral nicotine pouches may fuel further moat expansion.
Intangible Innovation vs. Operational Excellence: Who Holds the Stronger Moat?
Altria’s growing ROIC and superior margin profile indicate a wider and deeper moat than Philip Morris, whose declining ROIC signals caution. Altria appears better positioned to defend its turf against industry disruption.
Which stock offers better returns?
The past year saw Philip Morris International’s shares surge sharply, while Altria Group’s stock also gained but at a more moderate pace, reflecting differing momentum and trading volume trends.
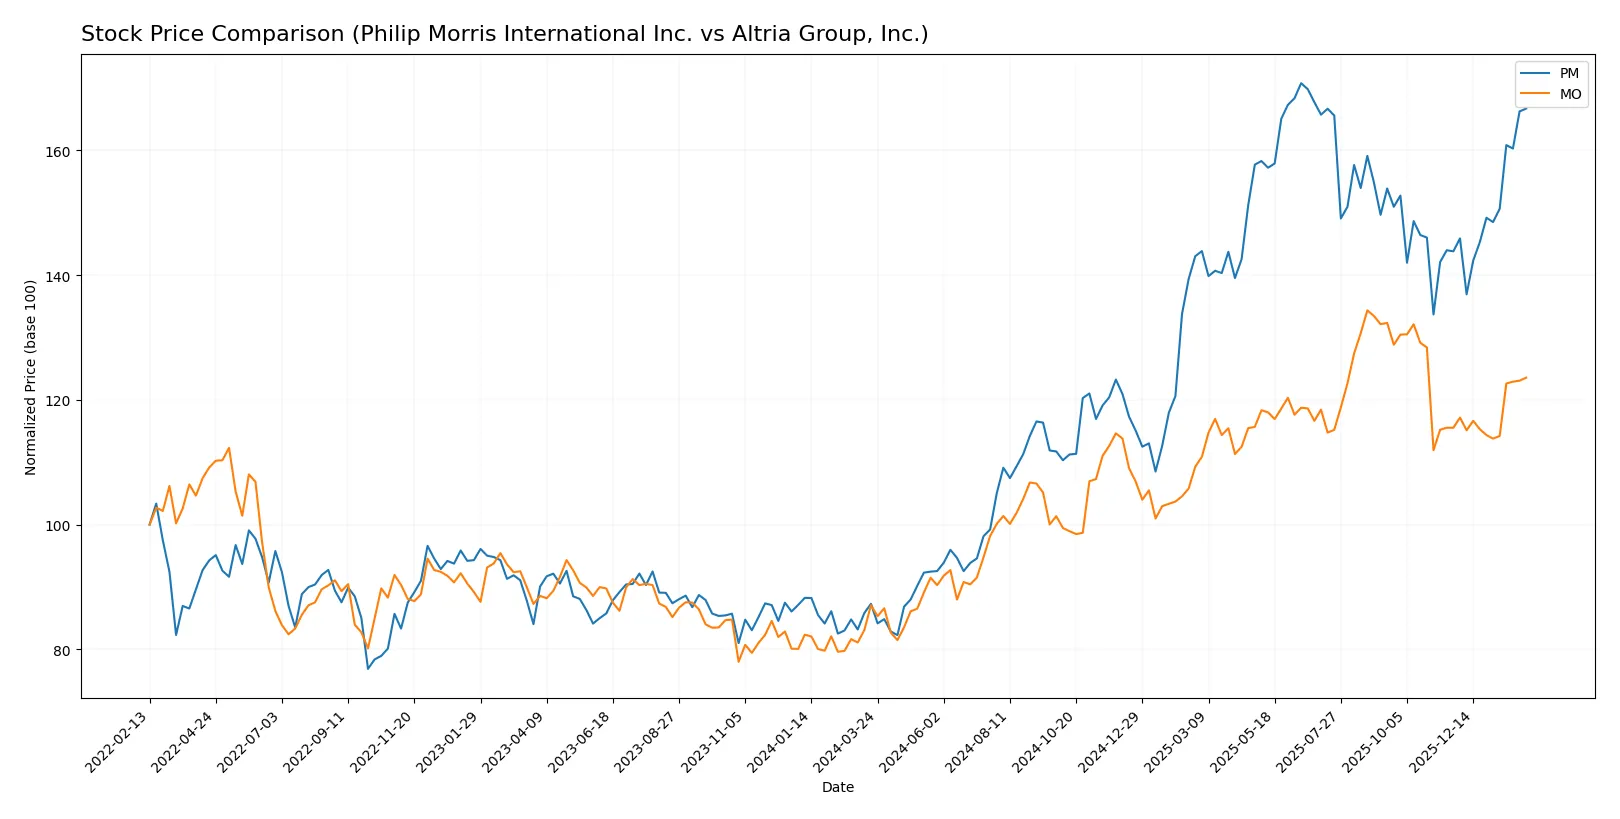
Trend Comparison
Philip Morris International’s stock rose 90.88% over 12 months, showing a bullish trend with accelerating gains and a high volatility level of 28.09%. The price ranged from 88.85 to 184.33.
Altria Group’s stock increased 41.85% over the same period, also bullish with acceleration but lower volatility at 6.69%. Its price moved between 41.05 and 67.67.
Philip Morris outperformed Altria, delivering more than double the market return, supported by stronger buyer dominance and increasing volume trends.
Target Prices
Analysts present a confident target price consensus for Philip Morris International and Altria Group.
| Company | Target Low | Target High | Consensus |
|---|---|---|---|
| Philip Morris International Inc. | 175 | 180 | 178.33 |
| Altria Group, Inc. | 47 | 68 | 60.67 |
Philip Morris trades near its $179.94 price, aligning closely with the $178.33 consensus, reflecting stable expectations. Altria’s consensus at $60.67 suggests moderate upside from its $62.23 current price, indicating balanced market sentiment.

Don’t Let Luck Decide Your Entry Point
Optimize your entry points with our advanced ProRealTime indicators. You’ll get efficient buy signals with precise price targets for maximum performance. Start outperforming now!
How do institutions grade them?
Here is a comparison of the latest institutional grades for Philip Morris International Inc. and Altria Group, Inc.:
Philip Morris International Inc. Grades
The table below summarizes recent grades from major financial institutions for Philip Morris International Inc.:
| Grading Company | Action | New Grade | Date |
|---|---|---|---|
| Jefferies | Downgrade | Hold | 2026-01-20 |
| JP Morgan | Maintain | Overweight | 2025-11-26 |
| Barclays | Maintain | Overweight | 2025-11-17 |
| UBS | Maintain | Neutral | 2025-09-05 |
| Barclays | Maintain | Overweight | 2025-07-30 |
| Needham | Maintain | Buy | 2025-07-23 |
| UBS | Maintain | Neutral | 2025-07-14 |
| Barclays | Maintain | Overweight | 2025-07-10 |
| JP Morgan | Maintain | Overweight | 2025-07-10 |
| Citigroup | Maintain | Buy | 2025-07-10 |
Altria Group, Inc. Grades
The table below summarizes recent grades from major financial institutions for Altria Group, Inc.:
| Grading Company | Action | New Grade | Date |
|---|---|---|---|
| Stifel | Maintain | Buy | 2026-01-30 |
| UBS | Maintain | Buy | 2026-01-26 |
| UBS | Upgrade | Buy | 2026-01-09 |
| UBS | Maintain | Neutral | 2025-10-31 |
| B of A Securities | Maintain | Buy | 2025-08-22 |
| Barclays | Maintain | Underweight | 2025-08-06 |
| Stifel | Maintain | Buy | 2025-07-31 |
| Morgan Stanley | Maintain | Equal Weight | 2025-07-31 |
| B of A Securities | Maintain | Buy | 2025-07-30 |
| UBS | Upgrade | Neutral | 2025-07-02 |
Which company has the best grades?
Altria Group, Inc. holds consistently higher recent grades with multiple Buy ratings and upgrades. Philip Morris International Inc. shows mixed grades, including a notable downgrade to Hold. Investors may perceive Altria as favored by analysts, potentially impacting demand and valuation.
Risks specific to each company
The following categories identify the critical pressure points and systemic threats facing both firms in the 2026 market environment:
1. Market & Competition
Philip Morris International Inc.
- Faces global competition in smoke-free product innovation.
Altria Group, Inc.
- Competes mainly in the U.S. with strong Marlboro brand dominance.
2. Capital Structure & Debt
Philip Morris International Inc.
- High debt-to-assets ratio (74%) raises financial leverage concerns.
Altria Group, Inc.
- Similar high leverage with 73% debt-to-assets ratio.
3. Stock Volatility
Philip Morris International Inc.
- Low beta (0.41) indicates lower stock volatility versus market.
Altria Group, Inc.
- Slightly higher beta (0.50) implies moderate volatility.
4. Regulatory & Legal
Philip Morris International Inc.
- Faces strict regulatory scrutiny globally on tobacco and smoke-free products.
Altria Group, Inc.
- U.S. regulatory environment is intense, particularly on oral nicotine products.
5. Supply Chain & Operations
Philip Morris International Inc.
- Complex international supply chains subject to geopolitical risks.
Altria Group, Inc.
- Domestic supply chain, less exposed to global disruptions.
6. ESG & Climate Transition
Philip Morris International Inc.
- Committed to a smoke-free future, shifting portfolio to reduced-risk products.
Altria Group, Inc.
- Also expanding oral nicotine products but slower in smoke-free innovation.
7. Geopolitical Exposure
Philip Morris International Inc.
- Significant exposure to emerging markets with geopolitical instability.
Altria Group, Inc.
- Primarily U.S.-focused, limiting geopolitical risk but raising regulatory dependence.
Which company shows a better risk-adjusted profile?
Philip Morris International’s biggest risk is geopolitical exposure in volatile emerging markets. Altria’s main risk lies in regulatory and legal pressures in the U.S., intensified by its concentrated market. Despite similar leverage concerns, Philip Morris’s diversified global footprint and lower stock volatility give it a slightly better risk-adjusted profile. Notably, Philip Morris’s Altman Z-score of 4.23 signals stronger financial safety compared to Altria’s 3.04, reinforcing my caution on Altria’s concentrated domestic challenges.
Final Verdict: Which stock to choose?
Philip Morris International’s superpower lies in its robust capital efficiency, consistently generating returns well above its cost of capital. Its slight vulnerability is the declining ROIC trend, signaling a need for close monitoring. This company fits portfolios targeting steady cash flow with a moderate risk tolerance.
Altria Group excels with a durable competitive moat, marked by a strong and growing ROIC that reflects widening profitability. Its higher dividend yield and more stable financial metrics position it as a safer choice compared to Philip Morris. It suits investors seeking growth combined with reasonable income stability.
If you prioritize capital efficiency and steady cash generation, Philip Morris International is compelling due to its proven value creation despite some profitability erosion. However, if you seek a durable moat with superior stability and income potential, Altria Group outshines as the more conservative growth option commanding a premium for resilience.
Disclaimer: Investment carries a risk of loss of initial capital. The past performance is not a reliable indicator of future results. Be sure to understand risks before making an investment decision.
Go Further
I encourage you to read the complete analyses of Philip Morris International Inc. and Altria Group, Inc. to enhance your investment decisions: