Home > Comparison > Consumer Defensive > BTI vs MO
The strategic rivalry between British American Tobacco p.l.c. and Altria Group, Inc. shapes the tobacco sector’s trajectory. British American Tobacco operates a global portfolio with diversified nicotine products, while Altria focuses on smokeable and oral tobacco primarily in the U.S. This head-to-head pits international scale against domestic market dominance. This analysis aims to identify which company offers the superior risk-adjusted profile for inclusion in a diversified portfolio.

Table of contents
Companies Overview
British American Tobacco and Altria Group dominate the global and U.S. tobacco markets with strong brand portfolios and evolving product lines.
British American Tobacco p.l.c.: Global Tobacco Powerhouse
British American Tobacco leads as a diversified tobacco and nicotine products provider across multiple continents. Its core revenue engine blends combustible cigarettes, vapour, heated tobacco, and oral nicotine products. In 2026, the company strategically focuses on expanding its modern nicotine offerings under brands like Vuse and glo to capture evolving consumer preferences globally.
Altria Group, Inc.: U.S. Tobacco Market Leader
Altria Group commands the U.S. tobacco market with a concentrated portfolio of smokeable and oral tobacco products. Its revenue hinges on iconic cigarette brands like Marlboro, alongside cigars and oral nicotine pouches. The 2026 strategy centers on strengthening its smokeless and oral nicotine segment while maintaining its dominant cigarette market share domestically.
Strategic Collision: Similarities & Divergences
Both companies prioritize tobacco product innovation but differ in scope—British American Tobacco pursues a global footprint, while Altria focuses on the U.S. market. Their primary battleground is the expanding nicotine alternatives segment where consumer tastes shift rapidly. These contrasts create distinct investment profiles: British American Tobacco offers geographic diversification, whereas Altria provides concentrated exposure with strong domestic brand loyalty.
Income Statement Comparison
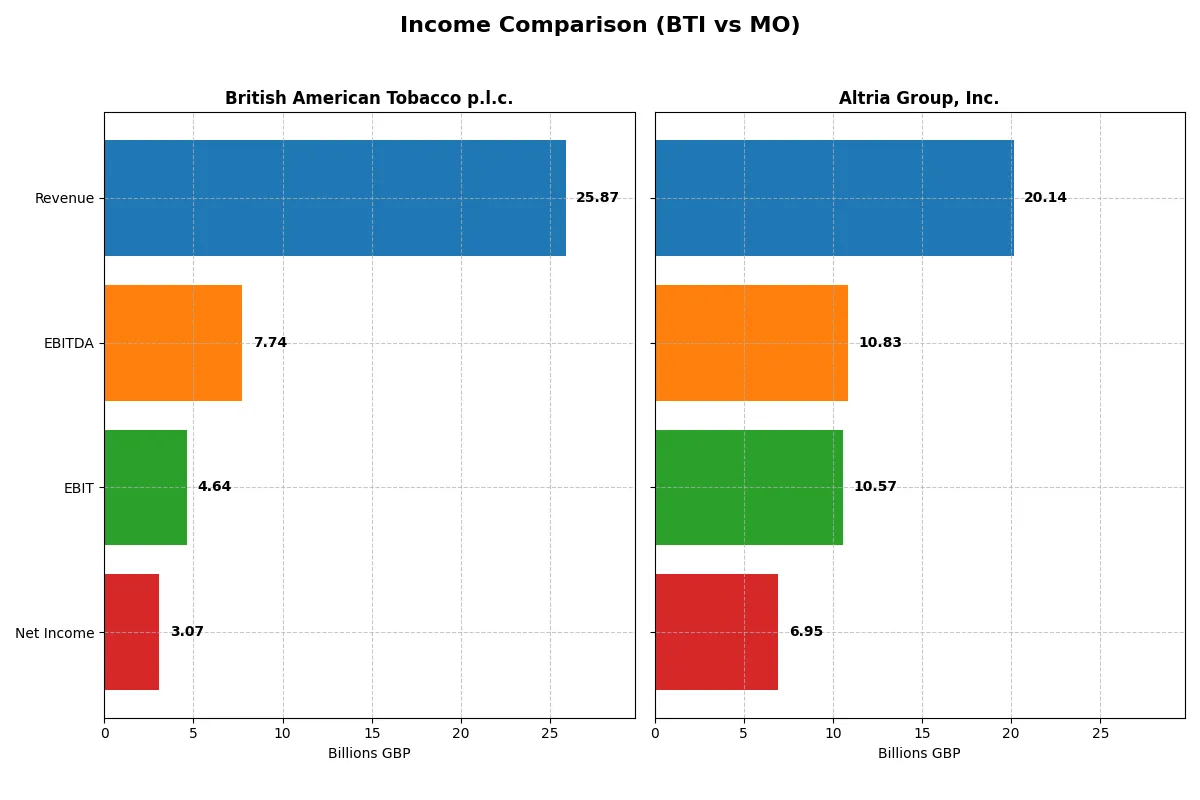
This data dissects the core profitability and scalability of both corporate engines to reveal who dominates the bottom line:
| Metric | British American Tobacco p.l.c. (BTI) | Altria Group, Inc. (MO) |
|---|---|---|
| Revenue | 25.9B GBP | 20.4B USD |
| Cost of Revenue | 4.4B GBP | 6.1B USD |
| Operating Expenses | 18.6B GBP | 3.1B USD |
| Gross Profit | 21.4B GBP | 14.4B USD |
| EBITDA | 7.7B GBP | 15.1B USD |
| EBIT | 4.6B GBP | 14.8B USD |
| Interest Expense | 1.1B GBP | 1.1B USD |
| Net Income | 3.1B GBP | 11.3B USD |
| EPS | 1.37 GBP | 6.54 USD |
| Fiscal Year | 2024 | 2024 |
Income Statement Analysis: The Bottom-Line Duel
This income statement comparison reveals each company’s ability to convert sales into profits and sustain operational efficiency through market cycles.
British American Tobacco p.l.c. Analysis
BTI’s revenue shows a slight decline to 25.9B GBP in 2024, down from 27.3B GBP in 2023, reflecting a -5.2% drop. Despite this, gross margin remains strong at 82.9%, with net income rebounding sharply to 3.1B GBP after a heavy loss in 2023. BTI’s net margin of 11.9% signals recovery but overall income growth remains weak, showing volatility in operational efficiency.
Altria Group, Inc. Analysis
MO’s revenue edged down slightly to 20.1B USD in 2025 from 20.4B USD in 2024, a -1.5% dip. However, MO commands an impressive gross margin of 86.6% and a robust net margin at 34.5%. Net income decreased to 6.9B USD after a prior peak but remains solid. MO sustains high EBIT margins above 50%, indicating superior operational leverage and consistent profitability momentum.
Margin Dominance vs. Recovery Challenge
MO outperforms BTI in margin strength and net income scale, boasting a 34.5% net margin versus BTI’s 11.9%. BTI struggles with revenue contraction and income volatility despite favorable margin ratios. MO’s profile appeals more to investors seeking stable, high-margin cash flows, while BTI’s recovery phase suggests higher risk and less consistent earnings power.
Financial Ratios Comparison
These vital ratios act as a diagnostic tool to expose the underlying fiscal health, valuation premiums, and capital efficiency of each company:
| Ratios | British American Tobacco (BTI) | Altria Group (MO) |
|---|---|---|
| ROE | 6.2% | -198.4% |
| ROIC | 2.4% | 43.0% |
| P/E | 20.9 | 13.9 |
| P/B | 1.29 | -27.61 |
| Current Ratio | 0.76 | 0.61 |
| Quick Ratio | 0.52 | 0.49 |
| D/E (Debt-to-Equity) | 0.74 | -7.34 |
| Debt-to-Assets | 31.1% | 73.4% |
| Interest Coverage | 2.49 | 12.80 |
| Asset Turnover | 0.22 | 0.58 |
| Fixed Asset Turnover | 5.91 | 11.78 |
| Payout ratio | 170% | 100% |
| Dividend yield | 8.1% | 7.2% |
| Fiscal Year | 2024 | 2025 |
Efficiency & Valuation Duel: The Vital Signs
Financial ratios act as a company’s DNA, uncovering hidden operational strengths and risks crucial for informed investment decisions.
British American Tobacco p.l.c.
British American Tobacco’s profitability shows a modest 6.18% ROE and 11.86% net margin, indicating moderate earnings efficiency. Its P/E of 20.94 suggests a fairly valued stock, neither cheap nor stretched. The firm offers an 8.11% dividend yield, signaling steady shareholder returns rather than aggressive reinvestment in growth.
Altria Group, Inc.
Altria boasts a strong 34.5% net margin and a robust 42.95% ROIC, reflecting high operational efficiency. Its P/E of 13.92 points to an attractively valued stock. Despite a negative ROE, the company maintains a 7.2% dividend yield, prioritizing consistent payouts over reinvestment, supported by solid interest coverage and asset turnover.
Operational Efficiency vs. Valuation Appeal
Altria displays superior profitability and operational metrics with a more favorable valuation, balancing risk and reward effectively. British American Tobacco offers steady dividends but lags in returns on equity and invested capital. Investors seeking high efficiency and value may lean toward Altria, while those favoring stable income might consider British American Tobacco’s profile.
Which one offers the Superior Shareholder Reward?
I compare British American Tobacco (BTI) and Altria Group (MO) on dividends, buybacks, and sustainability. BTI yields 8.1%, but pays out 170% of dividends to free cash flow—an unsustainable level. MO yields 7.2%, with a payout ratio near 100%, reflecting solid FCF coverage. BTI’s buybacks appear modest; MO’s aggressive buybacks complement dividends, enhancing total returns. MO’s stronger margins and cash flow underpin a more sustainable shareholder reward model. I conclude Altria offers the superior total return profile in 2026, balancing yield, buybacks, and financial health.
Comparative Score Analysis: The Strategic Profile
The radar chart reveals the fundamental DNA and trade-offs of British American Tobacco p.l.c. and Altria Group, Inc., highlighting their operational strengths and valuation nuances:
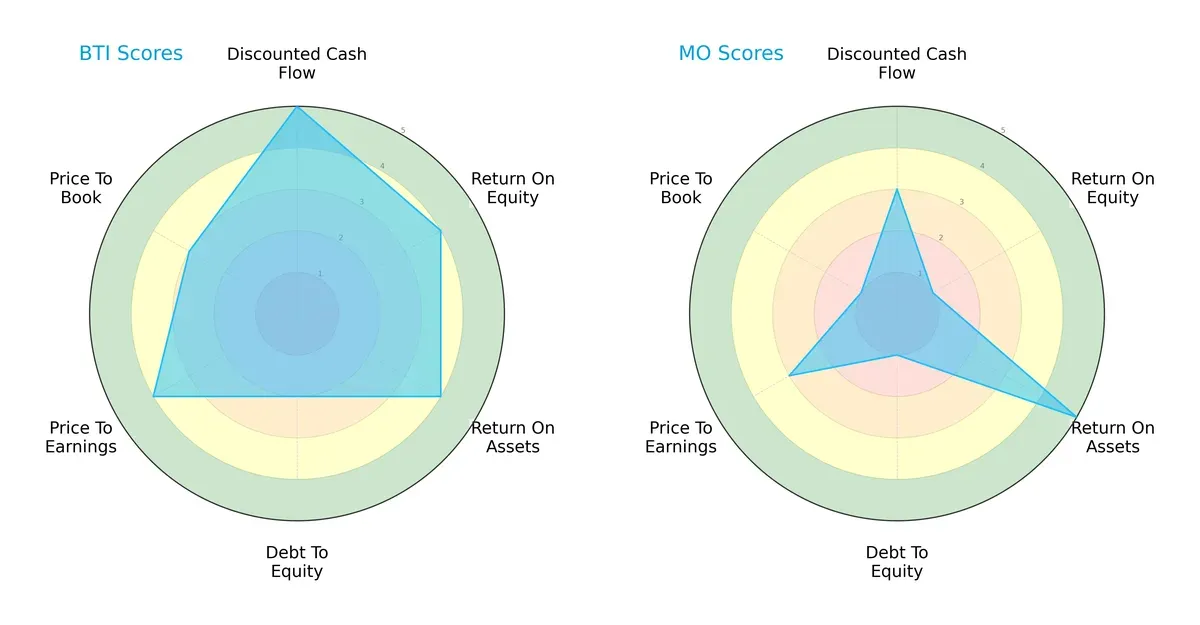
British American Tobacco (BTI) presents a more balanced profile with strong scores in DCF (5), ROE (4), and ROA (4), supported by moderate valuation metrics (PE 4, PB 3). Altria (MO) leans heavily on asset efficiency (ROA 5) but suffers from weak equity returns (ROE 1) and poor leverage control (Debt/Equity 1). BTI’s steadier capital allocation and valuation discipline position it as the more robust choice in this sector.
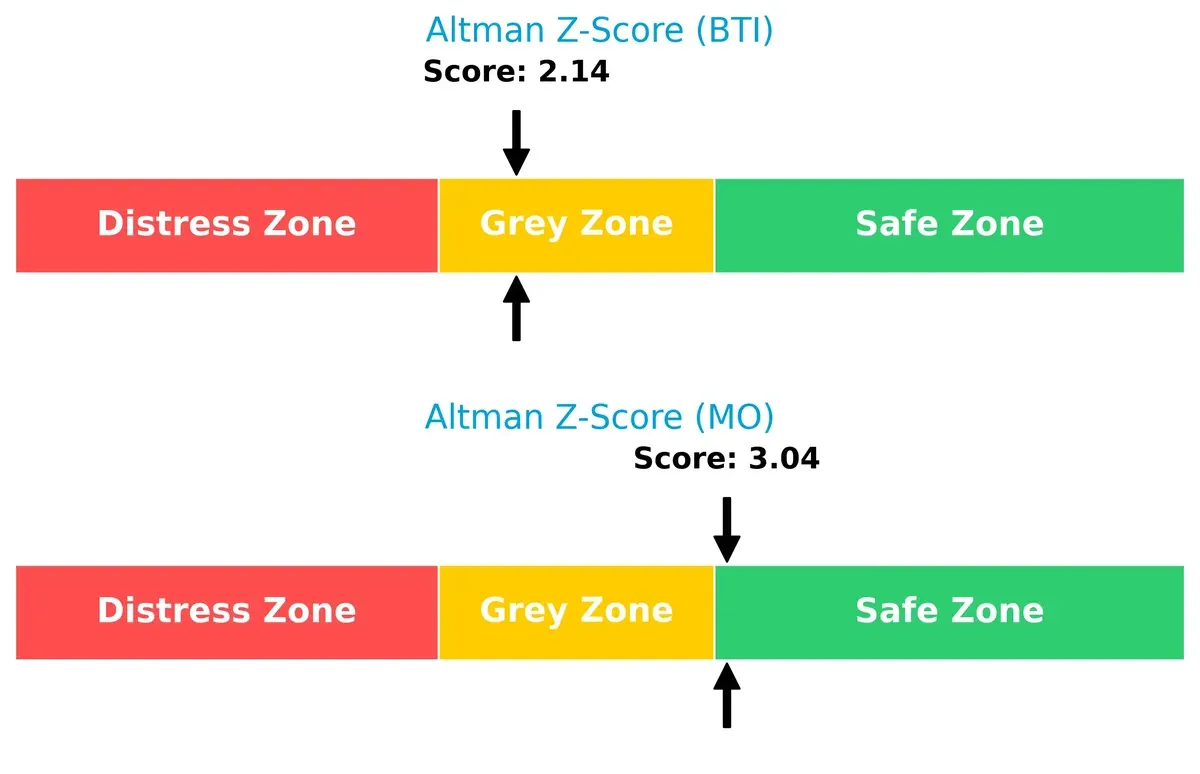
Bankruptcy Risk: Solvency Showdown
The Altman Z-Score gap favors Altria with a safer score (3.04) versus British American Tobacco’s moderate risk zone (2.14), signaling differing resilience to financial stress in this cycle:
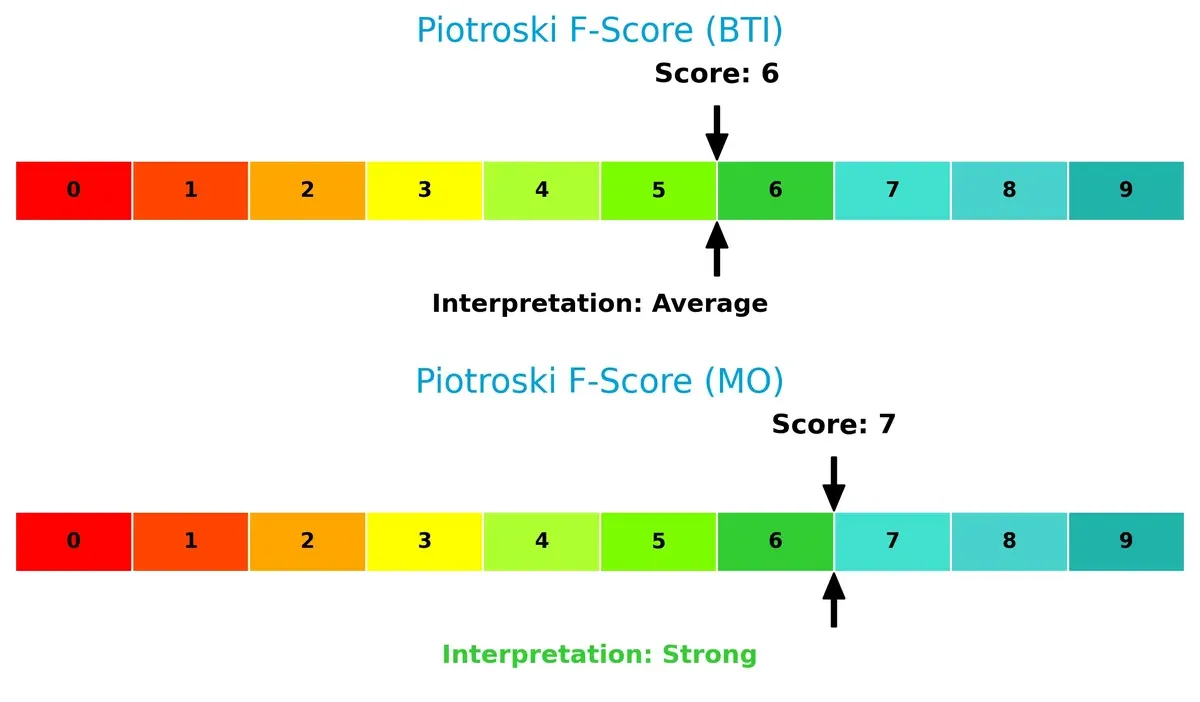
Financial Health: Quality of Operations
Altria edges ahead with a Piotroski F-Score of 7, indicating stronger operational quality than British American Tobacco’s 6, though both firms remain in acceptable financial health zones without glaring red flags:
How are the two companies positioned?
This section dissects the operational DNA of BTI and MO by comparing their revenue distribution and internal strengths and weaknesses. The goal is to confront their economic moats and identify which model offers the most resilient competitive advantage today.
Revenue Segmentation: The Strategic Mix
This visual comparison dissects how British American Tobacco and Altria Group diversify their income streams and where their primary sector bets lie:
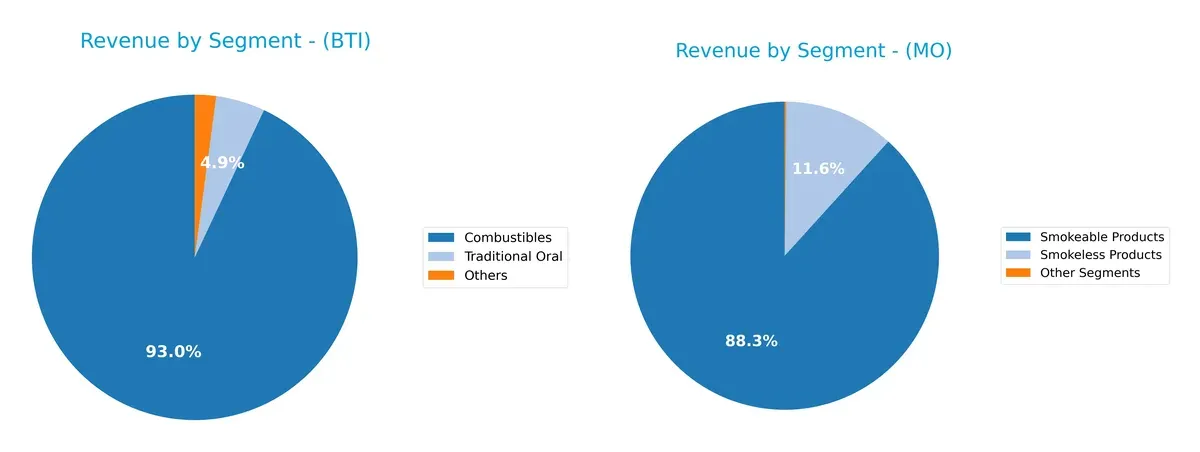
British American Tobacco anchors its revenue heavily in combustibles with £23B, supplemented modestly by traditional oral at £1.2B and others at £522M. Altria Group dwarfs with $21.2B from smokeable products but also pivots significantly on smokeless products at $2.78B, plus smaller contributions from other segments. BTI’s concentration signals reliance on legacy tobacco, while MO’s mix suggests strategic diversification into smokeless categories, reducing concentration risk and fostering ecosystem lock-in.
Strengths and Weaknesses Comparison
This table compares the Strengths and Weaknesses of British American Tobacco (BTI) and Altria Group (MO):
BTI Strengths
- Diverse product mix including combustibles, traditional and modern oral products
- Strong global presence with 27B GBP foreign revenue
- Favorable net margin at 11.9%
- Low WACC at 4.25% supports capital efficiency
- Favorable fixed asset turnover at 5.91
MO Strengths
- High profitability with 34.5% net margin
- Excellent ROIC of 42.95%, well above WACC
- Favorable debt-to-equity and interest coverage ratios
- Strong fixed asset turnover at 11.78
- Favorable valuation metrics including PE of 13.92
BTI Weaknesses
- Unfavorable ROE at 6.18% below cost of equity
- Low current and quick ratios indicating liquidity concerns
- Asset turnover low at 0.22, suggesting inefficiency
- Global ratios evaluation slightly unfavorable overall
MO Weaknesses
- Negative ROE at -198.37% signals profitability issues
- High debt-to-assets ratio at 73.4%, increasing financial risk
- Low current and quick ratios reflect liquidity risk
- Negative PB ratio unusual, may indicate accounting or market distortions
BTI shows strength in global diversification and steady product variety but faces efficiency and liquidity challenges. MO excels in profitability and capital returns but carries significant financial leverage and liquidity risks. Both companies must balance their operational strengths with structural weaknesses to sustain competitive advantage.
The Moat Duel: Analyzing Competitive Defensibility
A durable structural moat is the critical shield protecting long-term profits from relentless competitive erosion. Let’s dissect the competitive moats of these tobacco giants:
British American Tobacco p.l.c. (BTI): Global Scale Intangible Assets
I identify BTI’s moat in its broad geographic diversification and brand portfolio. Financials show mixed signals with declining ROIC and shrinking margins, signaling a weakening moat. The 2026 outlook is challenging as revenue contracts and profitability erodes, threatening its ability to defend global market share.
Altria Group, Inc. (MO): Strong Domestic Brand and Operational Efficiency
MO’s competitive edge lies in its dominant U.S. market presence and high operational margins. It delivers a robust ROIC well above WACC, indicating efficient capital use and value creation. The 2026 outlook remains positive with expanding profitability and potential to leverage new nicotine products domestically.
Geographic Reach vs. Operational Excellence: The Moat Faceoff
BTI’s global footprint offers scale but suffers from declining capital returns and margin pressure. MO’s concentrated U.S. focus drives superior profitability and growing ROIC. Based on current data, MO holds the deeper, more durable moat, better equipped to sustain and expand its competitive advantage in 2026.
Which stock offers better returns?
The past 12 months show strong upward momentum in both stocks, with British American Tobacco p.l.c. demonstrating notably higher gains and accelerating price appreciation.
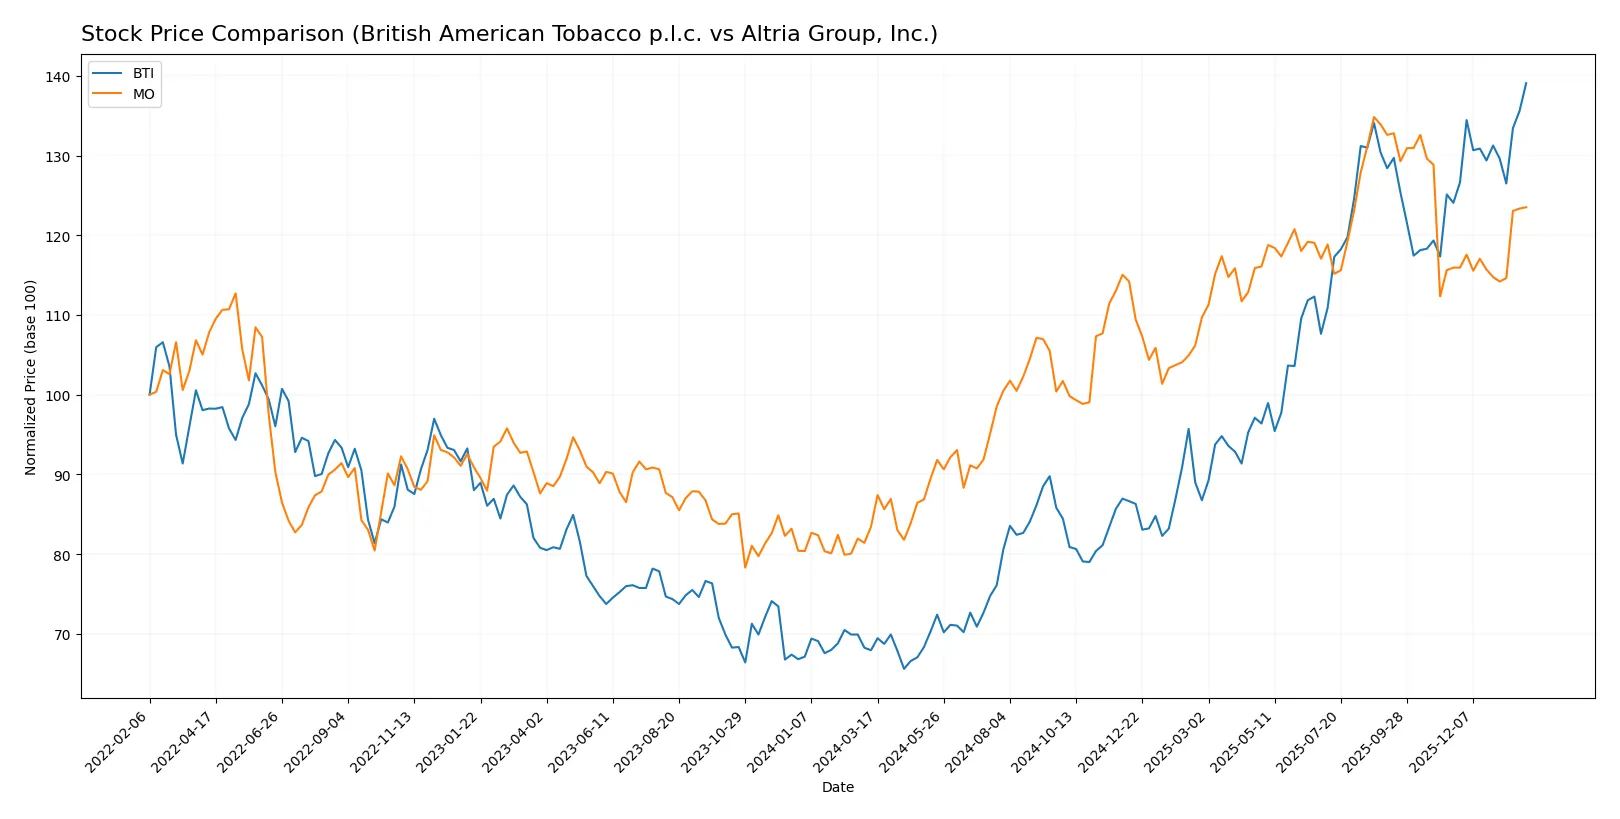
Trend Comparison
British American Tobacco p.l.c. gained 104.72% over the last year, marking a bullish trend with accelerating momentum and a high price range between 28.62 and 60.68.
Altria Group, Inc. rose 48.05% over the same period, also bullish with acceleration, but with lower volatility and a high-low price span of 41.05 to 67.67.
British American Tobacco p.l.c. clearly outperformed Altria Group, Inc., delivering the highest market returns and stronger price acceleration over the past year.
Target Prices
Analysts present a mixed target price outlook for British American Tobacco and Altria Group.
| Company | Target Low | Target High | Consensus |
|---|---|---|---|
| British American Tobacco p.l.c. | 40 | 40 | 40 |
| Altria Group, Inc. | 47 | 68 | 60.67 |
British American Tobacco’s target consensus at $40 sits significantly below its current price of $60.68, signaling potential downside risk. Altria’s consensus target of $60.67 is slightly below the current price of $61.99, indicating modest downside or a fairly valued status.

Don’t Let Luck Decide Your Entry Point
Optimize your entry points with our advanced ProRealTime indicators. You’ll get efficient buy signals with precise price targets for maximum performance. Start outperforming now!
How do institutions grade them?
The following tables summarize recent institutional grades for British American Tobacco p.l.c. and Altria Group, Inc.:
British American Tobacco p.l.c. Grades
This table shows the latest grade changes from reputable grading companies for BTI.
| Grading Company | Action | New Grade | Date |
|---|---|---|---|
| Argus Research | Buy | Buy | 2025-09-08 |
| UBS | Upgrade | Buy | 2025-01-27 |
| JP Morgan | Upgrade | Overweight | 2022-03-24 |
| JP Morgan | Upgrade | Overweight | 2022-03-23 |
| Jefferies | Upgrade | Buy | 2021-03-26 |
Altria Group, Inc. Grades
This table presents recent institutional ratings and updates for MO.
| Grading Company | Action | New Grade | Date |
|---|---|---|---|
| Stifel | Maintain | Buy | 2026-01-30 |
| UBS | Maintain | Buy | 2026-01-26 |
| UBS | Upgrade | Buy | 2026-01-09 |
| B of A Securities | Maintain | Buy | 2025-08-22 |
| Barclays | Maintain | Underweight | 2025-08-06 |
Which company has the best grades?
Altria Group holds a majority of recent Buy ratings from top firms, showing stable institutional confidence. British American Tobacco also earned strong upgrades but with older dates. Investors might view Altria’s current consensus as more favorable for near-term outlooks.
Risks specific to each company
The following categories identify critical pressure points and systemic threats facing British American Tobacco p.l.c. and Altria Group, Inc. in the 2026 market environment:
1. Market & Competition
British American Tobacco p.l.c.
- Faces intense global regulatory scrutiny limiting market expansion.
Altria Group, Inc.
- Dominates US market but faces stiff competition from vaping and cannabis sectors.
2. Capital Structure & Debt
British American Tobacco p.l.c.
- Moderate debt-to-equity ratio (0.74), stable but needs monitoring.
Altria Group, Inc.
- High debt-to-assets ratio (73.4%), signaling riskier leverage.
3. Stock Volatility
British American Tobacco p.l.c.
- Extremely low beta (0.041) indicates minimal market volatility.
Altria Group, Inc.
- Moderate beta (0.5) exposes stock to higher market swings.
4. Regulatory & Legal
British American Tobacco p.l.c.
- Global operations face diverse and tightening tobacco regulations.
Altria Group, Inc.
- US-focused, highly exposed to changing federal and state tobacco laws.
5. Supply Chain & Operations
British American Tobacco p.l.c.
- Complex global supply chain vulnerable to geopolitical disruptions.
Altria Group, Inc.
- More localized supply chain, reducing international operational risks.
6. ESG & Climate Transition
British American Tobacco p.l.c.
- Under pressure to improve ESG metrics globally amid climate concerns.
Altria Group, Inc.
- Faces increasing investor demand for sustainability in US market.
7. Geopolitical Exposure
British American Tobacco p.l.c.
- Exposure to emerging markets adds growth but increases geopolitical risk.
Altria Group, Inc.
- Primarily US-based, less exposed to international geopolitical volatility.
Which company shows a better risk-adjusted profile?
Altria faces significant leverage and regulatory risks but boasts a safer bankruptcy profile and stronger financial scores. British American Tobacco presents steadier stock volatility but struggles with weaker liquidity and lower returns on invested capital. Altria’s Altman Z-score in the safe zone (3.04) versus BTI’s grey zone (2.14) highlights its superior risk-adjusted stability despite higher debt. I find Altria’s stronger operational efficiency and financial resilience outweigh British American Tobacco’s global diversification risks at this stage.
Final Verdict: Which stock to choose?
British American Tobacco p.l.c. (BTI) excels as a resilient cash generator with a strong operational efficiency reflected in its ability to convert sales into free cash flow. Its point of vigilance remains a somewhat weak balance sheet liquidity, which may pressure short-term flexibility. BTI suits portfolios aiming for steady income with moderate risk tolerance.
Altria Group, Inc. (MO) boasts a durable competitive moat, demonstrated by a robust return on invested capital well above its cost of capital. Its strategic advantage lies in its efficient capital deployment and a safer balance sheet relative to BTI, appealing to investors who favor growth coupled with reasonable valuation discipline.
If you prioritize durable capital efficiency and a strong economic moat, MO is the compelling choice due to its superior value creation and improving profitability. However, if you seek a reliable cash flow profile with potential for income generation, BTI offers better stability but with caution on liquidity constraints. Both scenarios require close monitoring of sector dynamics and company-specific risks.
Disclaimer: Investment carries a risk of loss of initial capital. The past performance is not a reliable indicator of future results. Be sure to understand risks before making an investment decision.
Go Further
I encourage you to read the complete analyses of British American Tobacco p.l.c. and Altria Group, Inc. to enhance your investment decisions: