Home > Comparison > Technology > GOOGL vs SNAP
The strategic rivalry between Alphabet Inc. and Snap Inc. shapes the evolving landscape of digital media and technology. Alphabet, a sprawling technology titan, commands a diverse portfolio spanning cloud services, advertising, and consumer hardware. Snap, a nimble communication services firm, focuses on innovation in social media and visual engagement. This analysis contrasts their growth trajectories and capital deployment to identify which offers superior risk-adjusted returns for a balanced portfolio.
Table of contents
Companies Overview
Alphabet Inc. and Snap Inc. stand as pivotal players shaping the internet content and communication landscape in 2026.
Alphabet Inc.: Dominant Internet Ecosystem Leader
Alphabet Inc. commands the internet content & information sector with a vast portfolio including Google Services and Google Cloud. Its primary revenue stems from advertising across platforms like Search and YouTube, alongside cloud solutions and hardware sales. In 2026, Alphabet sharpens its focus on integrating AI across services and expanding cloud infrastructure to maintain its competitive edge.
Snap Inc.: Innovative Visual Communication Pioneer
Snap Inc. leads as a camera-centric social media company, monetizing through Snapchat’s ad formats and Spectacles eyewear. Its core revenue engine revolves around AR-enhanced ads and immersive visual communication features that attract younger demographics. In 2026, Snap intensifies investment in augmented reality technology and advertising innovation to deepen user engagement and advertiser appeal.
Strategic Collision: Similarities & Divergences
Both companies thrive in digital advertising and content delivery but diverge sharply in business philosophy; Alphabet builds a broad, integrated ecosystem, whereas Snap pursues a niche, visually-led platform. Their primary battleground is user attention in social and search domains. Alphabet offers a diversified investment profile with vast scale, while Snap presents a high-growth, innovation-focused profile with higher volatility.
Income Statement Comparison
This data dissects the core profitability and scalability of both corporate engines to reveal who dominates the bottom line:
| Metric | Alphabet Inc. (GOOGL) | Snap Inc. (SNAP) |
|---|---|---|
| Revenue | 403B | 5.93B |
| Cost of Revenue | 163B | 2.67B |
| Operating Expenses | 111B | 3.79B |
| Gross Profit | 240B | 3.26B |
| EBITDA | 180B | -169M |
| EBIT | 159B | -329M |
| Interest Expense | 143M | 89M |
| Net Income | 132B | -460M |
| EPS | 10.91 | -0.27 |
| Fiscal Year | 2025 | 2025 |
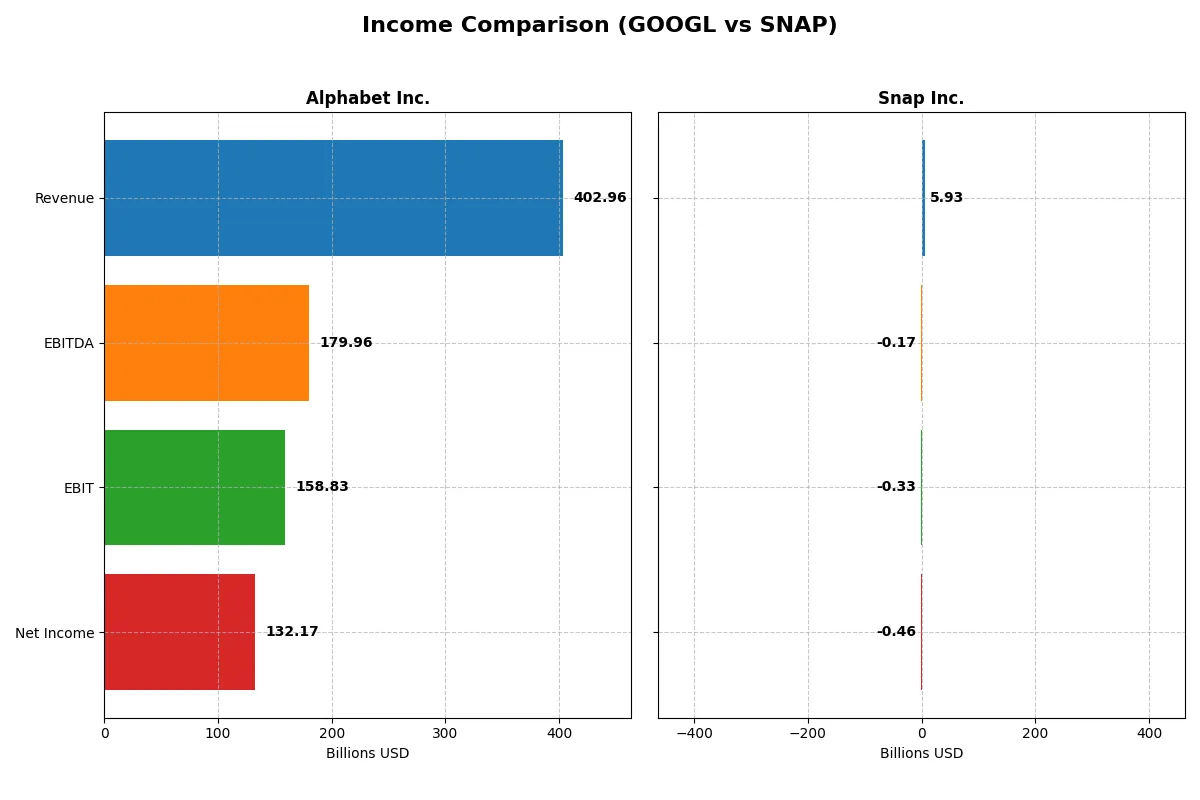
Income Statement Analysis: The Bottom-Line Duel
This income statement comparison reveals which company converts revenue into profit most efficiently, exposing the true strength of each corporate engine.
Alphabet Inc. Analysis
Alphabet’s revenue surged from 258B in 2021 to 403B in 2025, with net income climbing 74% to 132B. Its gross margin holds a robust 59.7%, and net margin reached a healthy 32.8% in 2025. The company demonstrates accelerating momentum, with a 15.1% revenue growth and a 34.5% EPS increase in the latest year.
Snap Inc. Analysis
Snap’s revenue expanded steadily from 4.1B in 2021 to 5.9B in 2025, but net income remains negative, narrowing losses to -460M in 2025. The gross margin is a decent 55%, yet the net margin stays unfavorable at -7.8%. Despite losses, Snap shows improving efficiency with a 10.6% revenue growth and a 35.7% EPS uplift year-over-year.
Margin Dominance vs. Growth Recovery
Alphabet outperforms Snap decisively, delivering strong profitability and margin expansion alongside solid revenue growth. Snap struggles to turn a profit but is gaining traction with improving margins and top-line growth. Alphabet’s profile suits investors seeking reliable earnings, while Snap appeals to those betting on a turnaround story.
Financial Ratios Comparison
These vital ratios act as a diagnostic tool to expose the underlying fiscal health, valuation premiums, and capital efficiency of the companies compared below:
| Ratios | Alphabet Inc. (GOOGL) | Snap Inc. (SNAP) |
|---|---|---|
| ROE | 31.8% | -20.2% |
| ROIC | 21.8% | -8.2% |
| P/E | 28.7 | -30.0 |
| P/B | 9.13 | 6.05 |
| Current Ratio | 2.01 | 3.56 |
| Quick Ratio | 2.01 | 3.56 |
| D/E | 0.14 | 2.06 |
| Debt-to-Assets | 9.96% | 61.2% |
| Interest Coverage | 0 | -5.98 |
| Asset Turnover | 0.68 | 0.77 |
| Fixed Asset Turnover | 1.54 | 5.47 |
| Payout ratio | 7.6% | 0 |
| Dividend yield | 0.26% | 0 |
| Fiscal Year | 2025 | 2025 |
Efficiency & Valuation Duel: The Vital Signs
Financial ratios act as a company’s DNA, revealing hidden risks and operational excellence critical for discerning investors.
Alphabet Inc.
Alphabet posts a strong ROE of 31.8% and a robust net margin of 32.8%, signaling high profitability. However, its P/E of 28.7 and P/B of 9.1 indicate a stretched valuation relative to earnings and book value. Despite a low 0.26% dividend yield, Alphabet reinvests heavily in R&D, fueling future growth.
Snap Inc.
Snap suffers from negative profitability with a -20.2% ROE and -7.8% net margin, reflecting operational challenges. The P/E ratio is negative, complicating valuation, while P/B stands at 6.1, suggesting some investor optimism despite losses. Snap pays no dividend and prioritizes R&D to drive product innovation and scale.
Premium Valuation vs. Operational Struggles
Alphabet offers superior profitability and a favorable overall ratio profile despite a high valuation. Snap’s weak profitability and unfavorable leverage ratios pose risks. Alphabet suits investors seeking operational safety; Snap appeals to those willing to embrace growth risk.
Which one offers the Superior Shareholder Reward?
I compare Alphabet Inc. and Snap Inc.’s distribution strategies. Alphabet yields a modest 0.32% dividend with a low 7.6% payout ratio, signaling a conservative dividend supported by strong free cash flow (6B FCF). It pairs this with aggressive buybacks, enhancing total returns sustainably. Snap pays no dividends and operates at losses, relying solely on reinvestment in growth and R&D. Its high debt levels (debt-to-equity 2.06) and negative margins raise sustainability concerns. Alphabet’s balanced dividends and robust buybacks offer a superior, more reliable total return profile for 2026 investors.
Comparative Score Analysis: The Strategic Profile
The radar chart reveals the fundamental DNA and trade-offs of Alphabet Inc. and Snap Inc., highlighting their strategic strengths and vulnerabilities:
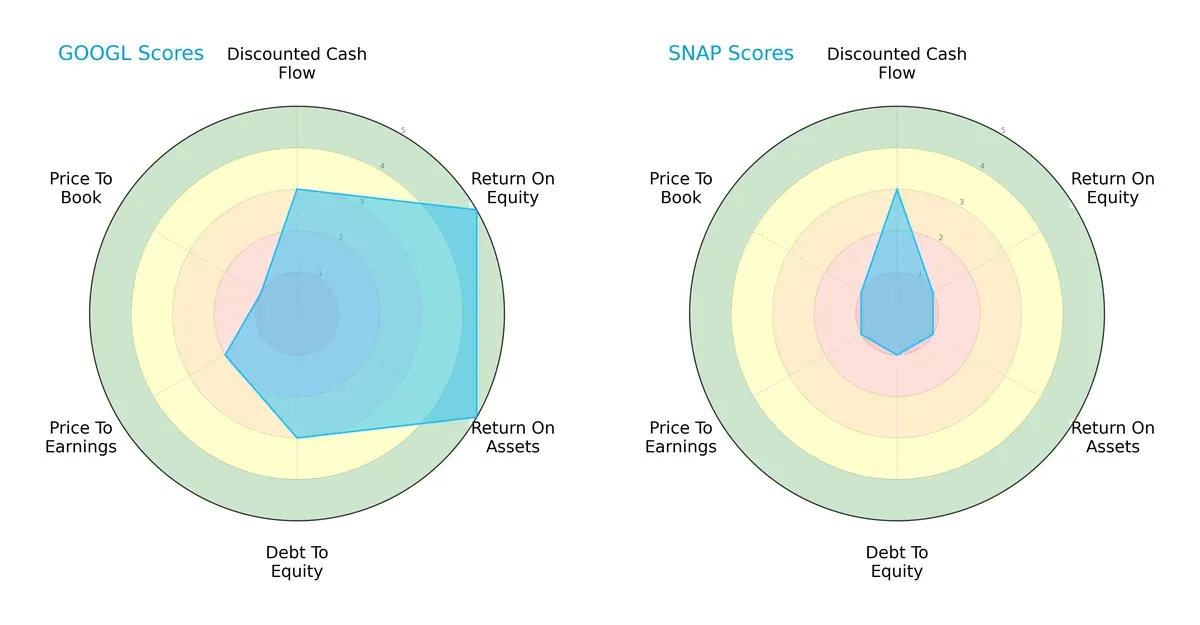
Alphabet shows a balanced profile with very favorable ROE and ROA scores, moderate DCF and debt-to-equity metrics, but struggles with valuation multiples. Snap relies heavily on moderate DCF but has weak profitability and financial stability scores, reflecting a concentrated but fragile edge.
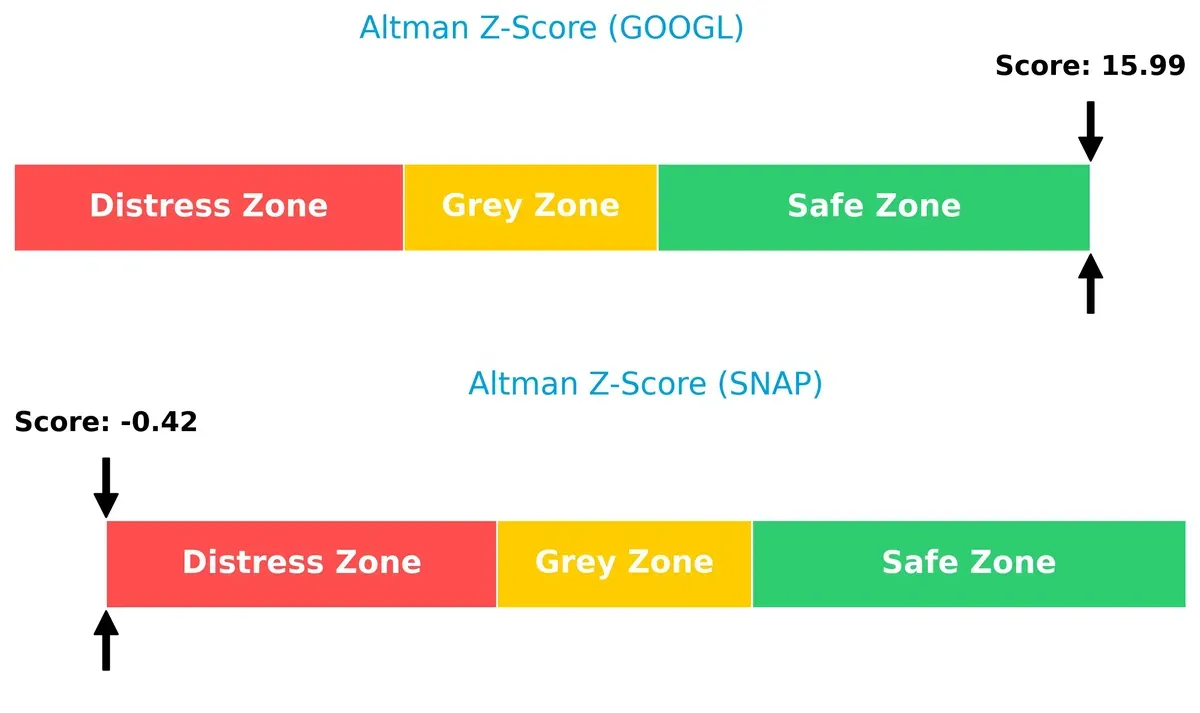
Bankruptcy Risk: Solvency Showdown
Alphabet’s Altman Z-Score of 16 places it securely in the safe zone, while Snap’s negative score signals distress and high bankruptcy risk in this cycle:
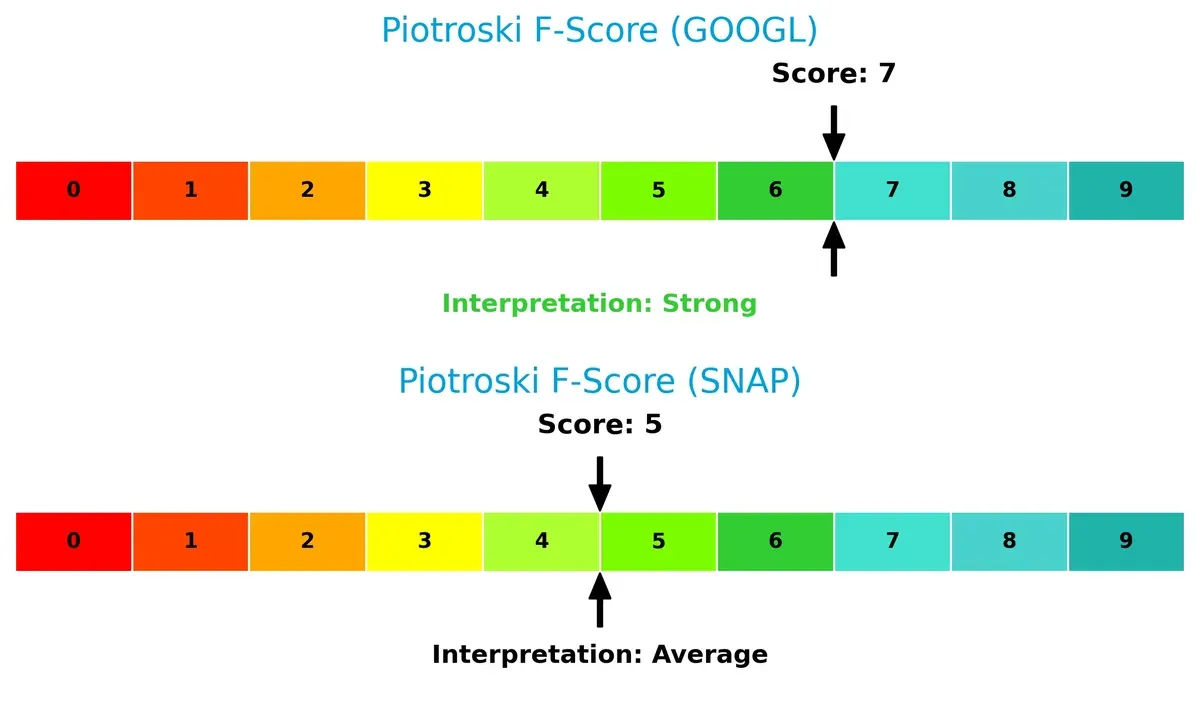
Financial Health: Quality of Operations
Alphabet’s strong Piotroski F-Score of 7 indicates robust financial health, whereas Snap’s average score of 5 suggests internal weaknesses and operational red flags:
How are the two companies positioned?
This section dissects Alphabet and Snap’s operational DNA by comparing their revenue distribution and internal dynamics. The goal is to confront their economic moats and identify which model offers the most resilient, sustainable advantage today.
Revenue Segmentation: The Strategic Mix
This visual comparison dissects how Alphabet Inc. and Snap Inc. diversify their income streams and where their primary sector bets lie:
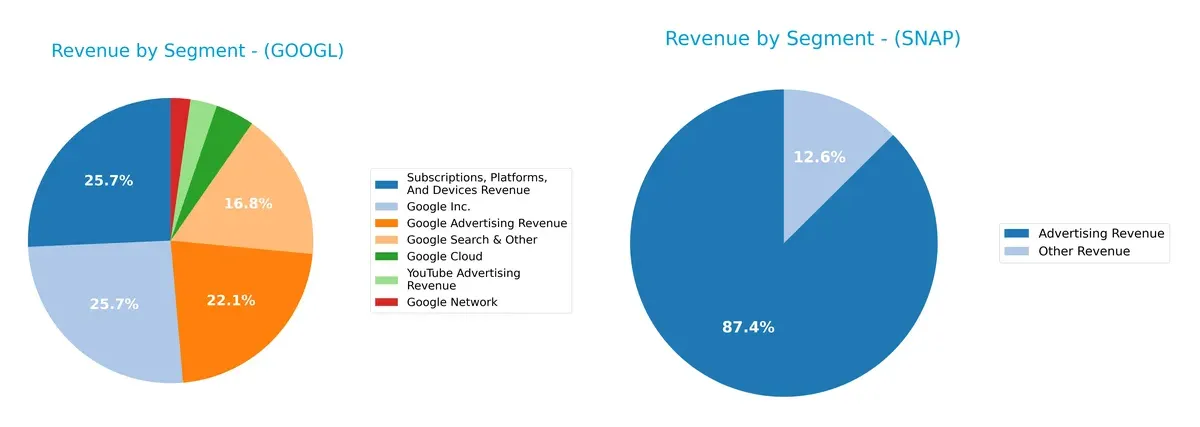
Alphabet’s revenue dwarfs Snap’s, anchored by a vast mix including $295B Google Advertising and $59B Google Cloud. Snap relies heavily on $5.2B Advertising Revenue with minimal diversification. Alphabet’s broad ecosystem lock-in across search, ads, cloud, and devices reduces concentration risk. Snap’s dependence on advertising creates vulnerability to ad market cycles and competitive pressures. This contrast highlights Alphabet’s infrastructure dominance versus Snap’s focused ad-driven model.
Strengths and Weaknesses Comparison
This table compares the Strengths and Weaknesses of Alphabet Inc. and Snap Inc.:
Alphabet Inc. Strengths
- High profitability with net margin 32.81% ROE 31.83%
- Favorable capital structure with low debt-to-assets 9.96%
- Strong global presence across US, EMEA, Asia Pacific
- Diverse revenue streams including advertising and cloud services
- Solid liquidity ratios with current ratio 2.01
Snap Inc. Strengths
- Favorable WACC of 6.22% indicating low capital costs
- High fixed asset turnover at 5.47 suggests efficient asset use
- Quick ratio 3.56 reflects good short-term liquidity
- Growing revenue in North America and Europe regions
- Some profitability challenges but stable market niche
Alphabet Inc. Weaknesses
- Unfavorable valuation metrics with PE 28.69 PB 9.13
- Low dividend yield 0.26% limits income appeal
- Neutral asset turnover indicates room for efficiency gains
- High price-to-book may deter value investors
Snap Inc. Weaknesses
- Negative profitability ratios: net margin -7.76% ROE -20.18%
- High debt-to-assets ratio 61.23% increases financial risk
- Negative interest coverage ratio -3.7 raises solvency concerns
- Current ratio 3.56 flagged as unfavorable, possibly due to asset structure
- Lower global diversification and smaller market share
Alphabet’s strengths lie in robust profitability and global scale, while Snap struggles with profitability and financial leverage. These contrasts highlight different strategic challenges each company faces in balancing growth, efficiency, and risk.
The Moat Duel: Analyzing Competitive Defensibility
A structural moat is the only reliable shield protecting long-term profits from relentless competitive erosion. Let’s dissect two tech giants’ moats:
Alphabet Inc.: Dominant Network Effects and Intangible Assets
Alphabet’s moat centers on vast network effects and powerful intangible assets like its search algorithm and YouTube ecosystem. This delivers a robust 13% ROIC premium over WACC and margin stability. Expansion in cloud and AI services may deepen this moat, but a slight ROIC decline signals growing competitive pressures in 2026.
Snap Inc.: Emerging User Engagement and Innovation
Snap’s moat leans on innovative camera technology and strong user engagement, distinct from Alphabet’s scale. Despite a negative ROIC spread (-14%), Snap shows a rising ROIC trend and improving profitability. Growth in AR ads and Spectacles offers upside, yet it remains vulnerable to Alphabet’s dominance and scale advantages.
Network Effects vs. Innovation Momentum: Who Holds the Stronger Moat?
Alphabet commands a wider, deeper moat through entrenched network effects and consistent value creation. Snap’s improving ROIC trend signals potential but not yet a durable moat. Alphabet remains better equipped to defend and extend market share amid intensifying competition.
Which stock offers better returns?
The past year reveals stark contrasts: Alphabet Inc. surged sharply before slowing, while Snap Inc. declined steadily, both showing shifting buyer-seller dynamics.
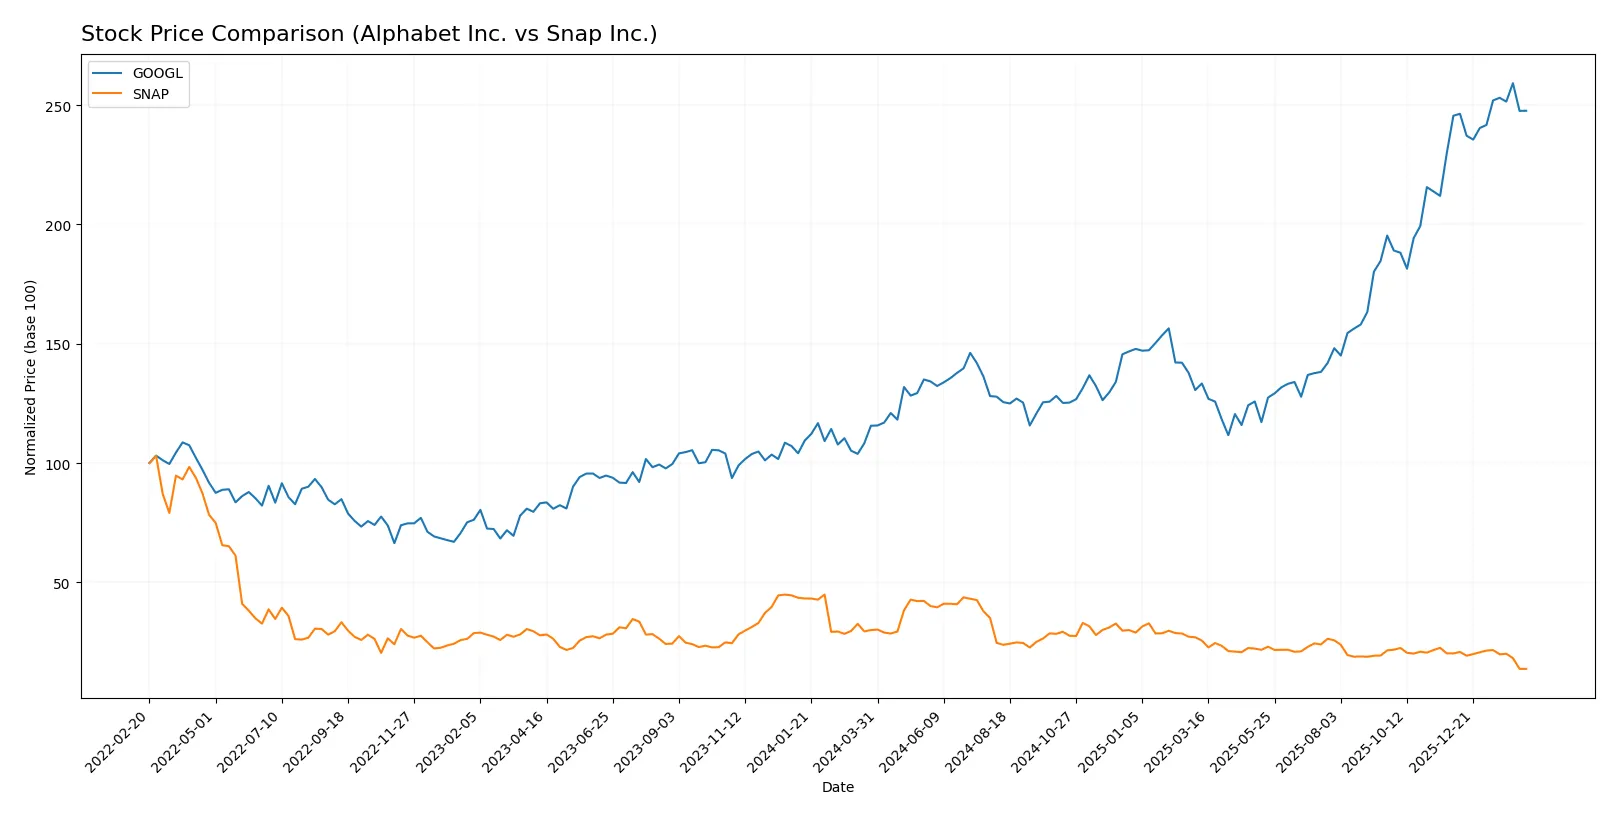
Trend Comparison
Alphabet Inc. gained 114.17% over 12 months, marking a strong bullish trend despite decelerating momentum. Prices ranged from 145.6 to 338.0 with high volatility (54.17 std deviation).
Snap Inc. fell 54.25% over the same period, confirming a bearish trend with deceleration. Price fluctuations were narrower, between 5.21 and 16.61, and volatility was low (2.68 std deviation).
Alphabet’s robust 114.17% rise outperformed Snap’s 54.25% decline, delivering far superior market returns over the past year.
Target Prices
Analysts present a cautiously optimistic consensus for Alphabet Inc. and Snap Inc.
| Company | Target Low | Target High | Consensus |
|---|---|---|---|
| Alphabet Inc. | 270 | 415 | 351.77 |
| Snap Inc. | 5.5 | 9.5 | 7.69 |
For Alphabet, the target consensus at 351.77 exceeds the current price of 322.33, signaling moderate upside potential. Snap’s consensus of 7.69 also suggests upside from 5.19, but with a tighter margin.

Don’t Let Luck Decide Your Entry Point
Optimize your entry points with our advanced ProRealTime indicators. You’ll get efficient buy signals with precise price targets for maximum performance. Start outperforming now!
How do institutions grade them?
Alphabet Inc. Grades
The following table summarizes the latest institutional grades for Alphabet Inc.:
| Grading Company | Action | New Grade | Date |
|---|---|---|---|
| Citigroup | Maintain | Buy | 2026-02-06 |
| Argus Research | Maintain | Buy | 2026-02-06 |
| Needham | Maintain | Buy | 2026-02-05 |
| Barclays | Maintain | Overweight | 2026-02-05 |
| Citizens | Maintain | Market Outperform | 2026-02-05 |
| Cantor Fitzgerald | Maintain | Overweight | 2026-02-05 |
| JP Morgan | Maintain | Overweight | 2026-02-05 |
| Roth Capital | Maintain | Buy | 2026-02-05 |
| DA Davidson | Maintain | Neutral | 2026-02-05 |
| Rosenblatt | Maintain | Neutral | 2026-02-05 |
Snap Inc. Grades
The following table summarizes the latest institutional grades for Snap Inc.:
| Grading Company | Action | New Grade | Date |
|---|---|---|---|
| Stifel | Upgrade | Hold | 2026-02-06 |
| Piper Sandler | Maintain | Neutral | 2026-02-05 |
| B. Riley Securities | Upgrade | Buy | 2026-02-05 |
| Mizuho | Maintain | Neutral | 2026-02-05 |
| Susquehanna | Maintain | Neutral | 2026-02-05 |
| TD Cowen | Maintain | Hold | 2026-02-05 |
| Evercore ISI Group | Maintain | In Line | 2026-02-05 |
| JP Morgan | Maintain | Underweight | 2026-02-05 |
| Rosenblatt | Maintain | Neutral | 2026-02-05 |
| Cantor Fitzgerald | Maintain | Neutral | 2026-02-05 |
Which company has the best grades?
Alphabet Inc. consistently receives buy or overweight ratings from major firms, reflecting strong institutional confidence. Snap Inc. shows mixed grades, including neutral and hold, indicating more cautious sentiment. This disparity may influence investor perception of stability and growth prospects.
Risks specific to each company
The following categories identify the critical pressure points and systemic threats facing both firms in the 2026 market environment:
1. Market & Competition
Alphabet Inc.
- Dominates with diversified platforms and global reach in Internet Content & Information.
Snap Inc.
- Faces intense competition with limited product diversification and smaller market cap.
2. Capital Structure & Debt
Alphabet Inc.
- Maintains low debt-to-equity ratio (0.14) and strong interest coverage (1110.67).
Snap Inc.
- High debt-to-equity ratio (2.06) and negative interest coverage (-3.7) signal financial risk.
3. Stock Volatility
Alphabet Inc.
- Beta of 1.086 indicates moderate volatility, tracking broader tech sector trends.
Snap Inc.
- Lower beta (0.796) suggests less volatility but also less market confidence.
4. Regulatory & Legal
Alphabet Inc.
- Subject to global regulatory scrutiny due to size and data handling; risks from antitrust actions.
Snap Inc.
- Faces regulatory pressures mainly in privacy and advertising but on a smaller scale.
5. Supply Chain & Operations
Alphabet Inc.
- Large-scale operations with diversified supply chains reduce operational risks.
Snap Inc.
- Smaller scale and reliance on hardware like Spectacles increase operational vulnerability.
6. ESG & Climate Transition
Alphabet Inc.
- Strong ESG initiatives aligned with industry leaders, supporting long-term sustainability.
Snap Inc.
- ESG efforts less mature, posing potential reputational and regulatory risks.
7. Geopolitical Exposure
Alphabet Inc.
- Extensive international presence exposes it to geopolitical tensions and trade risks.
Snap Inc.
- More regional focus reduces geopolitical exposure but limits growth opportunities.
Which company shows a better risk-adjusted profile?
Alphabet’s dominant market position and strong financial health mitigate many risks that weigh heavily on Snap. Snap’s high leverage and negative profitability are red flags. Alphabet’s Altman Z-score (16.0) places it firmly in the safe zone, while Snap falls in distress (-0.42). Alphabet’s diversified revenue and solid capital structure justify its better risk-adjusted profile amid 2026’s market uncertainties.
Final Verdict: Which stock to choose?
Alphabet Inc. wields unmatched efficiency as a cash-generating powerhouse with a robust economic moat. Its slight decline in return on invested capital is a point of vigilance. This stock suits portfolios targeting aggressive growth backed by strong fundamentals and a dominant market position.
Snap Inc. offers a strategic moat centered on innovation and user engagement, with a growing return on invested capital signaling improving profitability. It carries a higher risk profile than Alphabet but may fit growth-at-a-reasonable-price (GARP) portfolios seeking upside from operational turnarounds and product expansion.
If you prioritize durable value creation and stable cash flows, Alphabet outshines due to its commanding market presence and financial strength. However, if you seek high-growth potential with increasing profitability despite elevated risks, Snap offers a scenario worth monitoring for a turnaround investor willing to accept volatility.
Disclaimer: Investment carries a risk of loss of initial capital. The past performance is not a reliable indicator of future results. Be sure to understand risks before making an investment decision.
Go Further
I encourage you to read the complete analyses of Alphabet Inc. and Snap Inc. to enhance your investment decisions: