In the dynamic utilities sector, Xcel Energy Inc. (XEL) and Alliant Energy Corporation (LNT) stand out as prominent regulated electric companies with significant market presence in the United States. Both firms emphasize a diversified energy mix and innovation in sustainable power generation, serving millions of customers across multiple states. This article will carefully analyze their strengths and challenges to help you decide which stock may be the smarter addition to your investment portfolio.
Table of contents
Companies Overview
I will begin the comparison between Xcel Energy Inc. and Alliant Energy Corporation by providing an overview of these two companies and their main differences.
Xcel Energy Inc. Overview
Xcel Energy Inc. operates as a regulated electric utility company, generating and distributing electricity and natural gas across multiple states including Colorado, Michigan, and Texas. The company utilizes diverse energy sources such as coal, nuclear, natural gas, and renewables like wind and solar. Serving approximately 3.7M electricity and 2.1M natural gas customers, Xcel has a strong market presence with a market cap of $43.9B and is headquartered in Minneapolis, Minnesota.
Alliant Energy Corporation Overview
Alliant Energy Corporation is a utility holding company providing regulated electricity and natural gas services primarily in Iowa and Wisconsin. Its subsidiaries operate electric and gas utilities, serving retail customers across farming, industrial, and manufacturing sectors. With a market cap of $16.7B and about 1.4M combined electric and gas customers, Alliant also operates freight and logistics services. The company is based in Madison, Wisconsin, and focuses on both retail and wholesale power markets.
Key similarities and differences
Both companies operate in the regulated electric utility sector, serving residential, commercial, and industrial customers with electricity and natural gas. Xcel Energy has a broader geographic footprint and a larger customer base compared to Alliant Energy. While both invest in renewable energy, Xcel emphasizes a wider variety of energy sources. Alliant Energy, in addition to utilities, operates freight and logistics services, marking a notable diversification not present in Xcel’s business model.
Income Statement Comparison
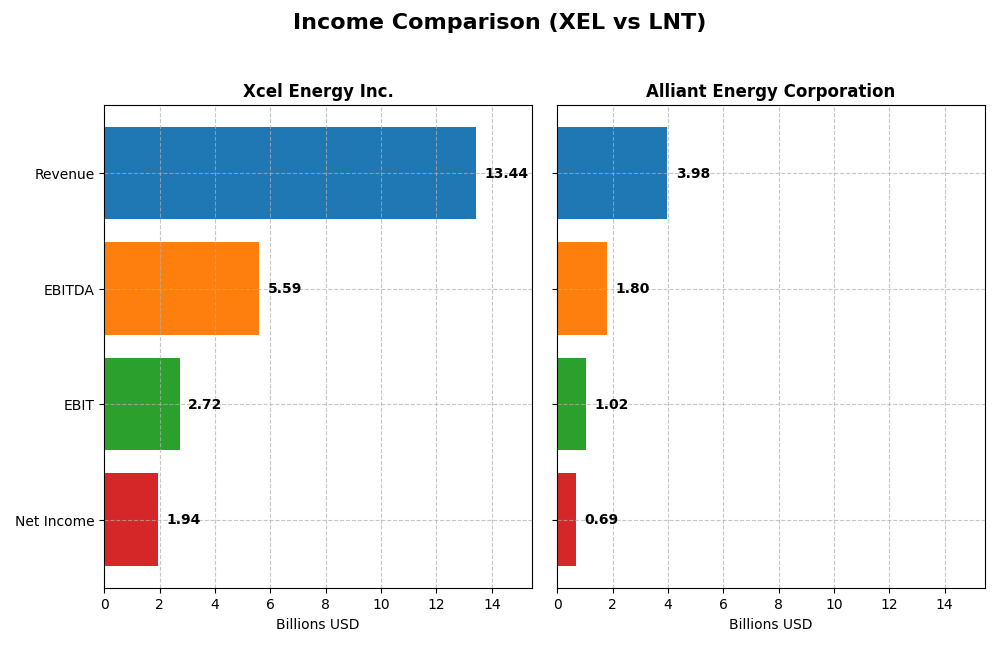
The following table compares key income statement metrics for Xcel Energy Inc. and Alliant Energy Corporation for the fiscal year 2024.
| Metric | Xcel Energy Inc. (XEL) | Alliant Energy Corporation (LNT) |
|---|---|---|
| Market Cap | 43.9B | 16.7B |
| Revenue | 13.44B | 3.98B |
| EBITDA | 5.59B | 1.80B |
| EBIT | 2.72B | 1.03B |
| Net Income | 1.94B | 690M |
| EPS | 3.44 | 2.69 |
| Fiscal Year | 2024 | 2024 |
Income Statement Interpretations
Xcel Energy Inc.
Xcel Energy’s revenue showed a favorable overall growth of 16.61% from 2020 to 2024, with net income increasing by 31.43% over the same period. Margins improved, as indicated by a gross margin of 45.74% and a net margin of 14.4%, both considered favorable. However, revenue declined by 5.39% in 2024, though net margin and EPS grew by 15.54% and 7.17%, respectively, signaling improved profitability despite slower top-line growth.
Alliant Energy Corporation
Alliant Energy experienced a similar overall revenue growth of 16.54% over five years, with net income rising 10.58%. Gross margin remained stable at 44.71%, while EBIT and net margins stood at 25.75% and 17.33%, respectively, both favorable except for an unfavorable interest expense ratio of 11.28%. The latest year showed a slight revenue decline of 1.14%, with EBIT, net margin, and EPS decreasing, indicating weakening profitability.
Which one has the stronger fundamentals?
Xcel Energy presents stronger fundamentals overall, supported by favorable margin expansions and solid net income growth, despite a recent revenue dip. Alliant Energy, while showing steady revenue and net income growth, faces margin pressure and declining profitability metrics in the latest year. The global income statement evaluation rates Xcel Energy favorably, contrasting with Alliant Energy’s unfavorable assessment, reflecting better income statement health for Xcel.
Financial Ratios Comparison
Below is a comparison of key financial ratios for Xcel Energy Inc. (XEL) and Alliant Energy Corporation (LNT) based on their most recent fiscal year data from 2024.
| Ratios | Xcel Energy Inc. (XEL) | Alliant Energy Corporation (LNT) |
|---|---|---|
| ROE | 9.92% | 9.85% |
| ROIC | 4.59% | 4.88% |
| P/E | 19.64 | 21.98 |
| P/B | 1.95 | 2.17 |
| Current Ratio | 0.67 | 0.44 |
| Quick Ratio | 0.57 | 0.33 |
| D/E (Debt-to-Equity) | 1.55 | 1.49 |
| Debt-to-Assets | 43.13% | 45.81% |
| Interest Coverage | 2.02 | 1.97 |
| Asset Turnover | 0.19 | 0.18 |
| Fixed Asset Turnover | 0.23 | 0.21 |
| Payout Ratio | 60.7% | 71.3% |
| Dividend Yield | 3.09% | 3.24% |
Interpretation of the Ratios
Xcel Energy Inc.
Xcel Energy shows mixed financial ratios with a favorable net margin of 14.4% but unfavorable returns on equity (9.92%) and invested capital (4.59%). Liquidity ratios are weak, with a current ratio of 0.67 and quick ratio of 0.57, indicating potential short-term risk. The dividend yield is solid at 3.09%, supported by dividend payments, though coverage by free cash flow is negative, signaling caution regarding sustainability.
Alliant Energy Corporation
Alliant Energy reports a stronger net margin of 17.33%, yet its return on equity (9.85%) and return on invested capital (4.88%) remain unfavorable. Liquidity is also weak, with a current ratio of 0.44 and quick ratio of 0.33. The dividend yield stands at 3.24%, reflecting consistent dividend distributions, but negative free cash flow coverage suggests possible risks to ongoing payouts or share repurchase programs.
Which one has the best ratios?
Both companies exhibit a similar ratio profile with about 21.43% favorable and 50% unfavorable ratios, resulting in a slightly unfavorable overall evaluation. Xcel Energy has a marginally better liquidity position and a slightly lower dividend yield, while Alliant Energy shows a higher net margin and dividend yield but weaker liquidity. Neither company distinctly outperforms the other in this ratio comparison.
Strategic Positioning
This section compares the strategic positioning of Xcel Energy Inc. and Alliant Energy Corporation, including their Market position, Key segments, and exposure to disruption:
Xcel Energy Inc.
- Large market cap of $44B with diversified geographic presence in eight states.
- Revenue driven by regulated electric ($22.3B) and natural gas ($4.5B) segments.
- Mixed energy sources including coal, nuclear, natural gas, hydro, solar, wind, and biomass.
Alliant Energy Corporation
- Smaller market cap of $17B, focused mainly in Iowa and Wisconsin.
- Revenue primarily from electric ($3.4B) and gas ($0.5B) utility operations.
- Owns gas-fired unit and wind farm; utility services concentrated in Midwest.
Xcel Energy Inc. vs Alliant Energy Corporation Positioning
Xcel Energy pursues a broadly diversified energy mix and geographic footprint, supporting multiple regulated segments. Alliant Energy concentrates on regional utility operations with less diversification in energy sources and markets, reflecting different scale and scope dynamics.
Which has the best competitive advantage?
Both companies are currently shedding value with ROIC below WACC. Xcel shows growing profitability, indicating a slightly unfavorable moat, while Alliant maintains stable but unfavorable profitability, suggesting Xcel holds a marginally stronger competitive advantage.
Stock Comparison
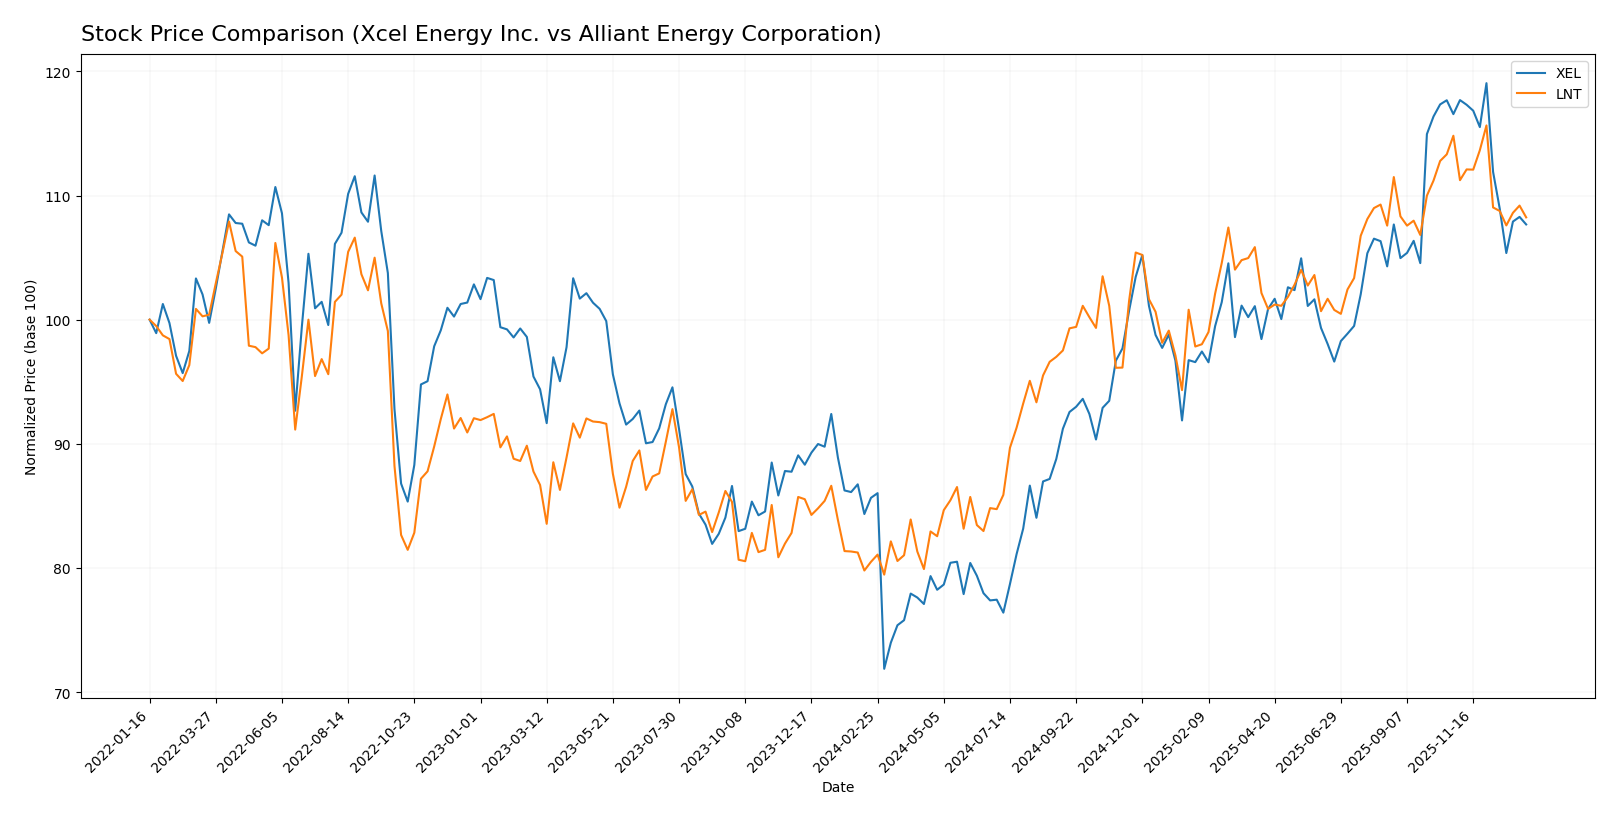
The stock price movements of Xcel Energy Inc. and Alliant Energy Corporation over the past 12 months show strong bullish trends with decelerating growth, punctuated by recent short-term declines in both equities.
Trend Analysis
Xcel Energy Inc. (XEL) exhibited a 25.72% price increase over the past year, confirming a bullish trend with decelerating momentum and a high price peak at 82.11. Recent months show a 7.63% decline, indicating short-term bearish reversal.
Alliant Energy Corporation (LNT) posted a 34.48% gain over the same period, also bullish with decelerating acceleration. The stock reached a high of 69.47 but experienced a 5.73% drop recently, signaling a moderate short-term downturn.
Comparing both, Alliant Energy outperformed Xcel Energy with a higher annual return of 34.48% versus 25.72%. Both stocks have shown strong long-term bullish trends but face recent corrective phases.
Target Prices
Analysts present a clear target consensus for Xcel Energy Inc. and Alliant Energy Corporation.
| Company | Target High | Target Low | Consensus |
|---|---|---|---|
| Xcel Energy Inc. | 96 | 81 | 87 |
| Alliant Energy Corporation | 78 | 65 | 73 |
The consensus target prices for both utilities are notably above their current stock prices, indicating moderate optimism from analysts about potential upside. This suggests these stocks may offer some appreciation potential relative to today’s valuations.
Analyst Opinions Comparison
This section compares analysts’ ratings and grades for Xcel Energy Inc. (XEL) and Alliant Energy Corporation (LNT):
Rating Comparison
XEL Rating
- Rating: C+, considered Very Favorable overall.
- Discounted Cash Flow Score: 4, Favorable valuation.
- ROE Score: 3, Moderate efficiency in using equity.
- ROA Score: 2, Moderate asset utilization.
- Debt To Equity Score: 1, Very Unfavorable leverage.
- Overall Score: 2, Moderate financial standing.
LNT Rating
- Rating: C+, considered Very Favorable overall.
- Discounted Cash Flow Score: 3, Moderate valuation.
- ROE Score: 1, Very Unfavorable efficiency.
- ROA Score: 4, Favorable asset utilization.
- Debt To Equity Score: 1, Very Unfavorable leverage.
- Overall Score: 2, Moderate financial standing.
Which one is the best rated?
Both XEL and LNT share the same overall rating and score, but XEL scores better on discounted cash flow and return on equity. Conversely, LNT excels in return on assets. Both have equally unfavorable debt-to-equity scores.
Scores Comparison
Here is the comparison of financial scores for Xcel Energy Inc. (XEL) and Alliant Energy Corporation (LNT):
XEL Scores
- Altman Z-Score: 0.89, indicating distress zone and high bankruptcy risk.
- Piotroski Score: 5, reflecting average financial strength.
LNT Scores
- Altman Z-Score: unavailable for LNT.
- Piotroski Score: 5, reflecting average financial strength.
Which company has the best scores?
Based on the available data, XEL has a low Altman Z-Score indicating financial distress, while LNT’s Altman Z-Score is unavailable. Both have the same average Piotroski Score of 5. Therefore, neither company shows a clear advantage in scores.
Grades Comparison
Here is a detailed comparison of recent grades and ratings from reputable grading companies for both companies:
Xcel Energy Inc. Grades
The table below summarizes recent grades and recommendations from recognized financial institutions:
| Grading Company | Action | New Grade | Date |
|---|---|---|---|
| UBS | Maintain | Neutral | 2025-12-17 |
| Keybanc | Maintain | Overweight | 2025-12-12 |
| JP Morgan | Maintain | Overweight | 2025-12-11 |
| Barclays | Maintain | Overweight | 2025-11-05 |
| Citigroup | Maintain | Buy | 2025-11-03 |
| UBS | Maintain | Neutral | 2025-10-31 |
| Mizuho | Maintain | Outperform | 2025-10-27 |
| Jefferies | Maintain | Buy | 2025-10-16 |
| Keybanc | Maintain | Overweight | 2025-10-15 |
| BMO Capital | Maintain | Outperform | 2025-10-15 |
Xcel Energy shows a consistent pattern of buy, overweight, and outperform ratings, indicating generally positive analyst sentiment over recent months.
Alliant Energy Corporation Grades
The following table lists recent grades and actions by verified grading companies:
| Grading Company | Action | New Grade | Date |
|---|---|---|---|
| Argus Research | Downgrade | Hold | 2026-01-09 |
| UBS | Maintain | Buy | 2025-12-17 |
| UBS | Upgrade | Buy | 2025-10-24 |
| B of A Securities | Maintain | Buy | 2025-10-17 |
| BMO Capital | Maintain | Market Perform | 2025-10-17 |
| Barclays | Maintain | Underweight | 2025-10-14 |
| UBS | Maintain | Neutral | 2025-10-10 |
| B of A Securities | Maintain | Buy | 2025-08-14 |
| BMO Capital | Maintain | Market Perform | 2025-08-11 |
| UBS | Maintain | Neutral | 2025-07-11 |
Alliant Energy’s recent grades are mixed, ranging from buy to hold and underweight, including a recent downgrade to hold, reflecting some analyst caution.
Which company has the best grades?
Xcel Energy Inc. has received more consistent positive grades, including multiple “Buy,” “Overweight,” and “Outperform” ratings, while Alliant Energy shows a wider spread with some downgrades and neutral ratings. This suggests Xcel Energy currently enjoys stronger analyst confidence, which may influence investor sentiment in favor of stability and growth expectations.
Strengths and Weaknesses
Below is a comparative overview of key strengths and weaknesses for Xcel Energy Inc. (XEL) and Alliant Energy Corporation (LNT) based on their latest financial and operational data.
| Criterion | Xcel Energy Inc. (XEL) | Alliant Energy Corporation (LNT) |
|---|---|---|
| Diversification | Strong diversification with $22.3B in regulated electric and $4.5B in natural gas revenues in 2024 | More concentrated, primarily electric ($3.37B) with smaller gas and other utility segments |
| Profitability | Net margin favorable at 14.4%, but ROIC (4.59%) below WACC (5.1%), indicating value destruction | Higher net margin of 17.3%, but ROIC (4.88%) also below WACC (5.91%), value destroying as well |
| Innovation | Increasing ROIC trend (+10% over 5 years) suggests improving operational efficiency | ROIC trend stable but flat (+0.8%), showing limited improvement in capital efficiency |
| Global presence | Primarily U.S. regulated markets, limiting global exposure but reducing geopolitical risk | Similar U.S.-focused footprint with limited global presence, focused on Midwest utilities |
| Market Share | Large regulated electric market share with $22.3B revenue, strong in regulated natural gas | Smaller market share with $3.37B electric revenue; less diversified in gas segment |
Xcel Energy shows stronger diversification and a growing profitability trend despite currently destroying value, while Alliant Energy maintains higher margins but lacks improvement in capital efficiency. Both face challenges in generating returns above their cost of capital, suggesting cautious investment consideration.
Risk Analysis
Below is a comparative table of key risks for Xcel Energy Inc. (XEL) and Alliant Energy Corporation (LNT) based on 2024 data:
| Metric | Xcel Energy Inc. (XEL) | Alliant Energy Corporation (LNT) |
|---|---|---|
| Market Risk | Low beta 0.469, less volatile | Moderate beta 0.671, higher volatility |
| Debt Level | DE ratio 1.55 (unfavorable), debt/assets 43.13% (neutral) | DE ratio 1.49 (unfavorable), debt/assets 45.81% (neutral) |
| Regulatory Risk | High, due to regulated utilities with environmental policies | High, similar regulated environment |
| Operational Risk | Moderate, asset turnover low (0.19), fixed asset turnover 0.23 | Moderate, asset turnover 0.18, fixed asset turnover 0.21 |
| Environmental Risk | Exposure to coal and natural gas generation; transition risks present | Exposure to fossil fuels but owns wind farm; transition risks present |
| Geopolitical Risk | Moderate, operates mainly in US with some regional exposure | Moderate, operations focused in Midwest US |
The most impactful and likely risks for both companies include regulatory pressures related to environmental policies and their relatively high debt levels, which pose financial risks. Xcel Energy’s Altman Z-Score of 0.89 places it in the distress zone, signaling potential financial distress. Both firms face transition risks as the energy sector shifts toward renewables, but they maintain moderate operational efficiency and dividend yields that may cushion some risks.
Which Stock to Choose?
Xcel Energy Inc. (XEL) shows favorable income growth with a 16.61% revenue increase over five years and strong net margin at 14.4%. Financial ratios reveal mixed signals, with favorable net margin and dividend yield but unfavorable returns on equity and capital. Debt ratios and liquidity are neutral to unfavorable, and the overall rating is very favorable (C+). The company’s MOAT analysis indicates value destruction despite improving ROIC trends.
Alliant Energy Corporation (LNT) demonstrates moderate income growth with 16.54% revenue growth overall but recent declines in EBIT and net margin. Its financial ratios mirror XEL’s with favorable net margin and dividend yield but weak return on equity and liquidity ratios. The rating is also very favorable (C+), though MOAT analysis shows stable profitability with value destruction and a neutral ROIC trend.
Investors favoring growth might find XEL’s improving profitability and income growth appealing, while those prioritizing stable returns and current income could interpret LNT’s consistent dividend yield and overall steady ratios as preferable. Both companies exhibit slightly unfavorable financial ratios and value destruction, suggesting cautious evaluation depending on risk tolerance and investment strategy.
Disclaimer: Investment carries a risk of loss of initial capital. The past performance is not a reliable indicator of future results. Be sure to understand risks before making an investment decision.
Go Further
I encourage you to read the complete analyses of Xcel Energy Inc. and Alliant Energy Corporation to enhance your investment decisions: