In the evolving utilities sector, WEC Energy Group, Inc. (WEC) and Alliant Energy Corporation (LNT) stand out as key players delivering regulated electric and natural gas services. Both companies emphasize innovation in renewable energy and serve overlapping Midwestern markets, making their strategies and performance highly comparable. This article will explore their strengths and risks to help you decide which utility stock could be a more compelling addition to your investment portfolio.
Table of contents
Companies Overview
I will begin the comparison between WEC Energy Group and Alliant Energy by providing an overview of these two companies and their main differences.
WEC Overview
WEC Energy Group, Inc. operates in the regulated electric industry, providing natural gas, electricity, and renewable energy services across multiple states in the US. The company focuses on generation and distribution from diverse sources including coal, natural gas, and renewables, alongside electric transmission and natural gas transportation. Headquartered in Milwaukee, Wisconsin, WEC manages extensive infrastructure with over 35,000 miles of distribution lines and serves a broad customer base through its six operating segments.
LNT Overview
Alliant Energy Corporation is a utility holding company delivering regulated electricity and natural gas services primarily in Iowa and Wisconsin. Through subsidiaries like Interstate Power and Light and Wisconsin Power and Light, it serves retail and wholesale customers, supporting industries such as agriculture and manufacturing. Alliant also operates freight services and holds stakes in natural gas and wind power generation assets. The company is headquartered in Madison, Wisconsin, with a focus on regulated utility operations.
Key similarities and differences
Both WEC and LNT operate within the regulated electric and natural gas sectors, serving retail customers with a mix of energy sources including renewables. However, WEC has a broader geographic footprint and more diversified energy infrastructure, including electric transmission services. LNT, while smaller in scale, integrates freight logistics and holds specific interests in power generation assets. Employee counts and market capitalizations also differ, reflecting their scale and operational scope.
Income Statement Comparison
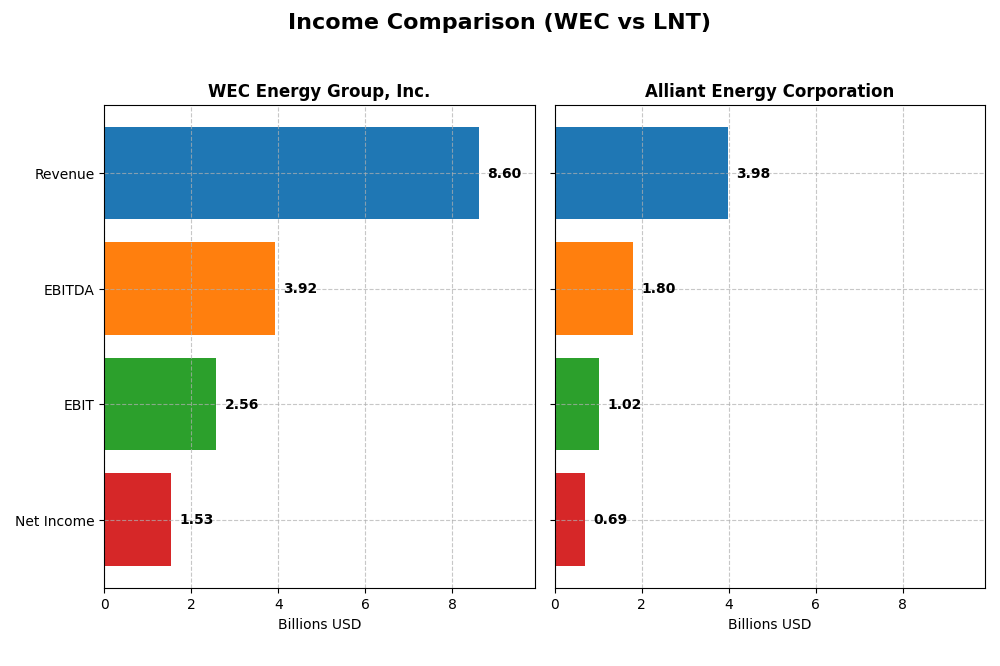
The following table presents a side-by-side comparison of key income statement metrics for WEC Energy Group, Inc. and Alliant Energy Corporation for the fiscal year 2024.
| Metric | WEC Energy Group, Inc. | Alliant Energy Corporation |
|---|---|---|
| Market Cap | 33.5B | 16.7B |
| Revenue | 8.6B | 4.0B |
| EBITDA | 3.9B | 1.8B |
| EBIT | 2.6B | 1.0B |
| Net Income | 1.53B | 690M |
| EPS | 4.81 | 2.69 |
| Fiscal Year | 2024 | 2024 |
Income Statement Interpretations
WEC Energy Group, Inc.
WEC Energy Group’s revenue grew 18.76% overall from 2020 to 2024 but declined by 3.3% in the most recent year. Net income increased 27.25% over the full period and 14.45% year-over-year, reflecting improved profitability. Margins remained stable with a favorable gross margin near 44% and an increasing net margin, reaching 17.77% in 2024, indicating efficient cost management and margin expansion.
Alliant Energy Corporation
Alliant Energy showed a 16.54% revenue increase from 2020 to 2024 but experienced a slight 1.14% revenue decline last year. Net income rose 10.58% over five years but fell 3.24% in 2024, with net margin decreasing by 0.72% year-over-year. While gross margin remained favorable at 44.71%, EBIT margin was lower than WEC’s, and interest expense impact was unfavorable, highlighting some pressure on profitability.
Which one has the stronger fundamentals?
WEC Energy Group exhibits stronger fundamentals with consistent revenue and net income growth, expanding margins, and a favorable overall income statement evaluation. Conversely, Alliant Energy faces recent declines in key earnings metrics and an unfavorable income statement opinion, despite solid gross margins. WEC’s superior margin stability and growth profile suggest more robust income statement health.
Financial Ratios Comparison
Below is a comparison of key financial ratios for WEC Energy Group, Inc. and Alliant Energy Corporation for the fiscal year 2024.
| Ratios | WEC Energy Group, Inc. | Alliant Energy Corporation |
|---|---|---|
| ROE | 12.3% | 9.85% |
| ROIC | 4.14% | 4.88% |
| P/E | 19.46 | 21.98 |
| P/B | 2.39 | 2.17 |
| Current Ratio | 0.60 | 0.44 |
| Quick Ratio | 0.43 | 0.33 |
| D/E | 1.64 | 1.49 |
| Debt-to-Assets | 42.9% | 45.8% |
| Interest Coverage | 2.64 | 1.97 |
| Asset Turnover | 0.18 | 0.18 |
| Fixed Asset Turnover | 0.25 | 0.21 |
| Payout ratio | 69.1% | 71.3% |
| Dividend yield | 3.55% | 3.24% |
Interpretation of the Ratios
WEC Energy Group, Inc.
WEC Energy Group shows a mix of ratio strengths and weaknesses. Its net margin of 17.77% and dividend yield of 3.55% are favorable, indicating profitability and shareholder returns. However, weak current and quick ratios (0.6 and 0.43) and a high debt-to-equity ratio of 1.64 raise liquidity and leverage concerns. The payout is supported but free cash flow to equity is negative, implying risks in distribution sustainability.
Alliant Energy Corporation
Alliant Energy displays favorable net margin at 17.33% and dividend yield of 3.24%, reflecting decent profitability and shareholder income. Yet, its return on equity is lower at 9.85%, and liquidity ratios remain low, with a current ratio of 0.44 and quick ratio of 0.33. Debt levels are moderately high with a debt-to-equity ratio of 1.49. Negative free cash flow to equity suggests caution on dividend coverage and capital allocation.
Which one has the best ratios?
Both companies face challenges with liquidity and leverage ratios, but WEC has a slightly higher return on equity and a better dividend yield. Alliant’s lower ROE and more unfavorable ratios in debt management weigh against it. Overall, both have a slightly unfavorable global ratio profile, with WEC showing marginally better balance in profitability and shareholder returns.
Strategic Positioning
This section compares the strategic positioning of WEC Energy Group, Inc. and Alliant Energy Corporation, including Market position, Key segments, and exposure to disruption:
WEC
- Leading regulated electric utility with larger market cap and lower beta, facing moderate competition.
- Diversified segments: Wisconsin, Illinois, Other States, Non-Utility Energy Infrastructure.
- Operates multiple generation sources including renewables and transmission services, moderate exposure.
LNT
- Mid-sized regulated electric utility with moderate market cap, slightly higher beta, under competitive pressure.
- Concentrated segments: Electric, Gas, and Other Utility services mainly in Iowa and Wisconsin.
- Focuses on regulated electric and gas utility services, limited diversification, less exposed to tech disruption.
WEC vs LNT Positioning
WEC adopts a diversified geographic and business segment strategy spanning multiple states and energy infrastructures, while LNT focuses on fewer segments and states. WEC’s broader base may offer resilience; LNT’s concentrated focus simplifies its operational scope but could limit growth avenues.
Which has the best competitive advantage?
Both companies currently shed value as ROIC is below WACC; WEC’s slightly unfavorable moat with growing ROIC contrasts with LNT’s unfavorable moat and stable profitability, indicating WEC has a marginally better competitive advantage based on recent trends.
Stock Comparison
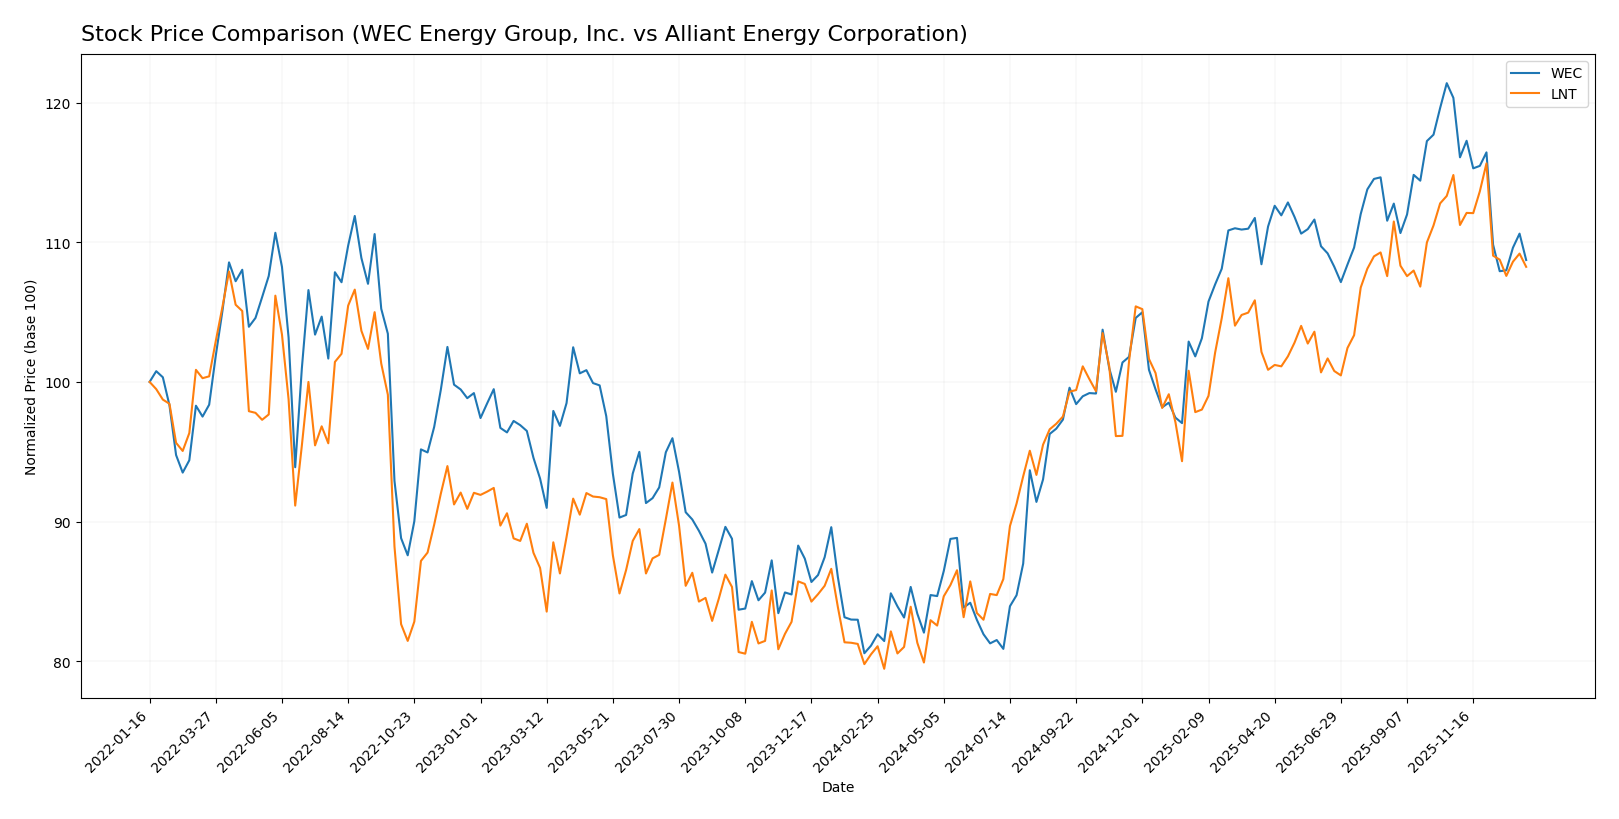
The stock prices of WEC Energy Group, Inc. and Alliant Energy Corporation have both shown significant bullish trends over the past 12 months, with a noticeable deceleration in momentum and recent mild declines in trading activity.
Trend Analysis
WEC Energy Group, Inc. experienced a 34.05% price increase over the past year, characterizing a bullish trend with decelerating momentum and a high volatility reflected by an 11.44 standard deviation.
Alliant Energy Corporation’s stock rose by 34.48% in the same period, displaying a bullish trend with deceleration and lower volatility at a 5.9 standard deviation.
Comparing both, Alliant Energy outperformed WEC slightly with a 34.48% gain versus 34.05%, although both showed recent price declines and seller dominance in recent trading volumes.
Target Prices
The consensus target prices from verified analysts indicate modest upside potential for both WEC Energy Group, Inc. and Alliant Energy Corporation.
| Company | Target High | Target Low | Consensus |
|---|---|---|---|
| WEC Energy Group, Inc. | 136 | 105 | 122.67 |
| Alliant Energy Corporation | 78 | 65 | 73 |
Analysts expect WEC’s stock to rise above its current price of 104.65 USD, while Alliant Energy’s consensus target is also above its current price of 65.02 USD, suggesting potential appreciation for both utilities.
Analyst Opinions Comparison
This section compares analysts’ ratings and financial scores for WEC Energy Group, Inc. (WEC) and Alliant Energy Corporation (LNT):
Rating Comparison
WEC Rating
- Rating: B-, considered Very Favorable overall.
- Discounted Cash Flow Score: 1, rated Very Unfavorable, indicating caution.
- ROE Score: 4, rated Favorable for efficient profit generation.
- ROA Score: 4, rated Favorable for effective asset utilization.
- Debt To Equity Score: 2, rated Moderate, reflecting balanced financial risk.
- Overall Score: 3, rated Moderate, reflecting average financial standing.
LNT Rating
- Rating: C+, considered Very Favorable overall.
- Discounted Cash Flow Score: 3, rated Moderate, indicating fair valuation.
- ROE Score: 1, rated Very Unfavorable, suggesting weak equity returns.
- ROA Score: 4, rated Favorable, showing effective asset utilization.
- Debt To Equity Score: 1, rated Very Unfavorable, indicating higher risk.
- Overall Score: 2, rated Moderate, reflecting below average financial standing.
Which one is the best rated?
Based strictly on provided data, WEC holds a better overall rating (B- vs. C+) and superior scores in ROE and debt management. LNT scores higher on discounted cash flow but has weaker equity returns and financial risk metrics.
Scores Comparison
Here is a comparison of the Altman Z-Score and Piotroski Score for WEC and LNT:
WEC Scores
- Altman Z-Score: 1.14, in the distress zone, indicating high bankruptcy risk.
- Piotroski Score: 6, categorized as average financial strength.
LNT Scores
- Altman Z-Score: unavailable, no data provided.
- Piotroski Score: 5, also categorized as average financial strength.
Which company has the best scores?
WEC has a clearly defined Altman Z-Score in the distress zone, while LNT’s score is unavailable. Both have average Piotroski Scores, with WEC slightly higher at 6 versus 5 for LNT.
Grades Comparison
The following analysis compares the grading trends and ratings from recognized grading companies for WEC Energy Group, Inc. and Alliant Energy Corporation:
WEC Energy Group, Inc. Grades
This table summarizes recent grades assigned to WEC Energy Group by credible grading companies.
| Grading Company | Action | New Grade | Date |
|---|---|---|---|
| B of A Securities | Maintain | Neutral | 2025-12-31 |
| UBS | Maintain | Neutral | 2025-12-17 |
| Barclays | Maintain | Underweight | 2025-12-16 |
| Keybanc | Maintain | Overweight | 2025-12-12 |
| JP Morgan | Maintain | Neutral | 2025-12-11 |
| Scotiabank | Maintain | Sector Outperform | 2025-10-31 |
| BMO Capital | Maintain | Market Perform | 2025-10-21 |
| Barclays | Maintain | Equal Weight | 2025-10-21 |
| Keybanc | Maintain | Overweight | 2025-10-15 |
| UBS | Maintain | Neutral | 2025-10-10 |
Overall, WEC’s grades reflect a mixed but generally neutral to slightly positive stance, with multiple firms maintaining their ratings and some overweight or outperform views.
Alliant Energy Corporation Grades
This table shows recent grades assigned to Alliant Energy Corporation by established grading firms.
| Grading Company | Action | New Grade | Date |
|---|---|---|---|
| Argus Research | Downgrade | Hold | 2026-01-09 |
| UBS | Maintain | Buy | 2025-12-17 |
| UBS | Upgrade | Buy | 2025-10-24 |
| B of A Securities | Maintain | Buy | 2025-10-17 |
| BMO Capital | Maintain | Market Perform | 2025-10-17 |
| Barclays | Maintain | Underweight | 2025-10-14 |
| UBS | Maintain | Neutral | 2025-10-10 |
| B of A Securities | Maintain | Buy | 2025-08-14 |
| BMO Capital | Maintain | Market Perform | 2025-08-11 |
| UBS | Maintain | Neutral | 2025-07-11 |
Overall, Alliant Energy’s grades show a leaning toward Buy ratings with some downgrades, indicating a generally positive but cautious sentiment.
Which company has the best grades?
Alliant Energy Corporation has received more Buy ratings and fewer Hold or Sell ratings compared to WEC Energy Group’s predominantly Neutral and Hold consensus. This suggests a more favorable outlook from analysts, potentially influencing investor confidence and portfolio decisions.
Strengths and Weaknesses
Below is a comparative overview of the strengths and weaknesses of WEC Energy Group, Inc. (WEC) and Alliant Energy Corporation (LNT), based on their recent financial and operational data.
| Criterion | WEC Energy Group, Inc. (WEC) | Alliant Energy Corporation (LNT) |
|---|---|---|
| Diversification | Moderate, with revenue spread across Wisconsin (6.33B), Illinois (1.6B), other states, and non-utility infrastructure | Moderate, mainly electric (3.37B) and gas (465M) utilities with smaller other segments |
| Profitability | Net margin 17.77% (favorable); ROIC 4.14% (unfavorable, below WACC 5.3%) | Net margin 17.33% (favorable); ROIC 4.88% (unfavorable, below WACC 5.91%) |
| Innovation | Growing ROIC trend indicating improving profitability despite current value destruction | Neutral ROIC trend with stable profitability but value destruction persists |
| Global presence | Regional focus mainly in Midwest US, limited global exposure | Regional US utility focus, no global presence |
| Market Share | Strong in Wisconsin and Illinois markets with steady revenue growth | Solid presence in electric and gas utility markets, steady revenue but slower growth |
Key takeaways: Both companies operate with moderate diversification and strong regional market shares in utilities. WEC shows improving profitability trends despite current value destruction, while LNT maintains stable but less dynamic profitability. Both firms exhibit slightly unfavorable ROIC relative to their cost of capital, signaling caution for investors.
Risk Analysis
Below is a comparative table highlighting the key risk factors for WEC Energy Group, Inc. (WEC) and Alliant Energy Corporation (LNT) based on the most recent 2024 financial data and operational context:
| Metric | WEC Energy Group, Inc. (WEC) | Alliant Energy Corporation (LNT) |
|---|---|---|
| Market Risk | Moderate (Beta 0.573, stable utility sector) | Moderate (Beta 0.671, slightly more volatile) |
| Debt level | Elevated (Debt/Equity 1.64, interest coverage 3.14) | Elevated (Debt/Equity 1.49, interest coverage 2.28) |
| Regulatory Risk | Moderate (regulated electric utility, exposure to policy changes) | Moderate (regulated utility, similar regulatory environment) |
| Operational Risk | Medium (diversified energy sources; infrastructure aging concerns) | Medium (diversified utility operations, includes freight services) |
| Environmental Risk | Medium (coal and natural gas reliance, transition risks) | Medium (natural gas and wind generation, renewable transition ongoing) |
| Geopolitical Risk | Low (primarily US-based operations in stable regions) | Low (primarily US-based operations in stable regions) |
The most impactful risks for both companies stem from elevated debt levels coupled with moderate regulatory and environmental risks linked to the energy transition. WEC’s Altman Z-Score indicates financial distress risk, signaling caution, while LNT’s financial distress score is unavailable but shows a similar risk profile in leverage and coverage. Investors should closely monitor regulatory shifts and debt management strategies.
Which Stock to Choose?
WEC Energy Group, Inc. shows a generally favorable income evolution with net margin at 17.77% and positive growth in earnings per share by 14.45% over one year. Financial ratios reveal strengths in net margin and dividend yield but weaknesses in liquidity and asset turnover. The company carries moderate debt with a net debt to EBITDA of 5.19, and its rating is very favorable with a B- grade.
Alliant Energy Corporation reports a slightly less positive income trend, with a net margin of 17.33% but unfavorable growth in EBIT and net margin over the last year. Its financial ratios highlight favorable net margin and WACC but show multiple unfavorable liquidity and leverage metrics. The company has a higher debt burden relative to EBITDA at 5.75 and a very favorable rating with a C+ grade.
For investors, WEC’s favorable income growth and stronger rating might appeal to those prioritizing quality and growth, while LNT’s stable profitability despite value destruction could be more suitable for risk-tolerant investors focusing on potential turnaround or value opportunities. Both companies have slightly unfavorable global ratio evaluations and show signs of value destruction, suggesting prudence.
Disclaimer: Investment carries a risk of loss of initial capital. The past performance is not a reliable indicator of future results. Be sure to understand risks before making an investment decision.
Go Further
I encourage you to read the complete analyses of WEC Energy Group, Inc. and Alliant Energy Corporation to enhance your investment decisions: