The Southern Company (SO) and Alliant Energy Corporation (LNT) are two key players in the regulated electric utility sector, serving millions of customers across several U.S. states. Both companies emphasize innovation through renewable energy and infrastructure development, making them compelling choices for investors focused on sustainable growth. In this article, I will analyze their strengths and risks to help you decide which company offers the best investment potential in 2026.
Table of contents
Companies Overview
I will begin the comparison between The Southern Company and Alliant Energy Corporation by providing an overview of these two companies and their main differences.
The Southern Company Overview
The Southern Company operates in the regulated electric industry, focusing on the generation, transmission, and distribution of electricity and natural gas. It serves about 8.7M electric and gas utility customers, managing diverse energy assets including hydroelectric, fossil fuel, nuclear, solar, wind, and battery storage facilities. Headquartered in Atlanta, it also offers digital wireless communications and fiber optics services, positioning itself as a broad energy and utility provider.
Alliant Energy Corporation Overview
Alliant Energy Corporation is a utility holding company that provides regulated electricity and natural gas services primarily in Iowa and Wisconsin. It serves roughly 1.4M retail customers through subsidiaries IPL and WPL, operating in electric and gas utility segments and also offering freight and logistics services. Its generation portfolio includes natural gas and wind power assets. Headquartered in Madison, it targets diverse industries including agriculture and industrial manufacturing.
Key similarities and differences
Both companies operate in the regulated electric utility sector providing electricity and natural gas to retail customers. Southern Company is significantly larger with a wider geographic reach and broader energy asset base including nuclear and solar, while Alliant Energy focuses more regionally in the Midwest with smaller scale operations and additional freight services. Southern Company also has a larger workforce and offers telecommunications services, highlighting a more diversified utility business model.
Income Statement Comparison
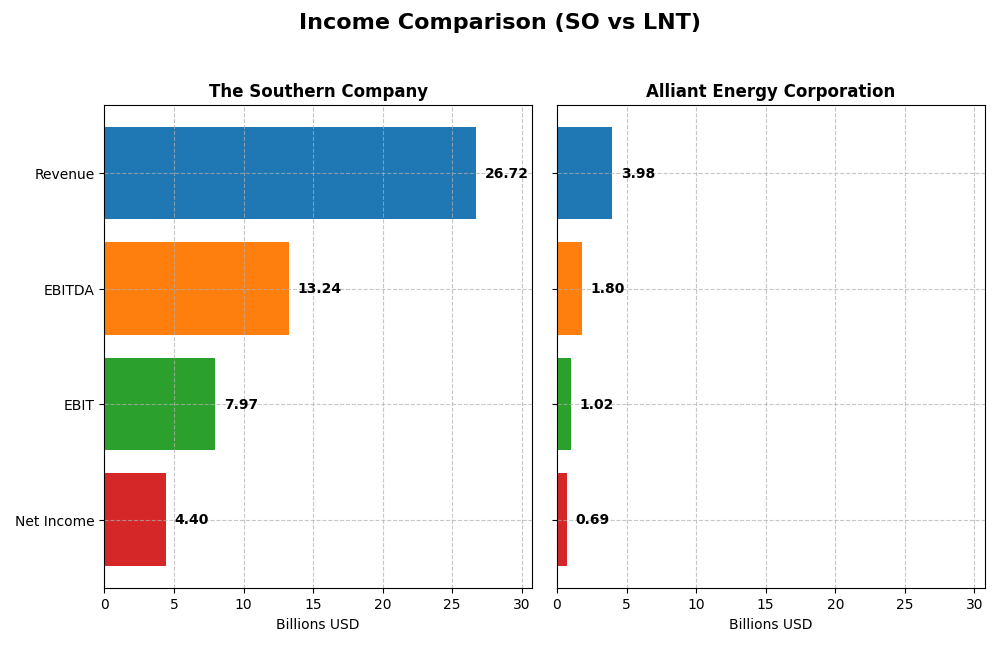
Below is a side-by-side comparison of key income statement metrics for The Southern Company and Alliant Energy Corporation for the fiscal year 2024.
| Metric | The Southern Company (SO) | Alliant Energy Corporation (LNT) |
|---|---|---|
| Market Cap | 95.7B | 16.7B |
| Revenue | 26.7B | 3.98B |
| EBITDA | 13.2B | 1.80B |
| EBIT | 7.97B | 1.03B |
| Net Income | 4.40B | 690M |
| EPS | 4.02 | 2.69 |
| Fiscal Year | 2024 | 2024 |
Income Statement Interpretations
The Southern Company
The Southern Company’s revenue increased steadily from $20.4B in 2020 to $26.7B in 2024, while net income grew from $3.1B to $4.4B over the same period. Margins improved notably, with a gross margin near 50% and net margin at 16.5% in 2024. The latest year showed moderate revenue growth of 5.8%, with favorable gains in gross profit and EBIT margins.
Alliant Energy Corporation
Alliant Energy’s revenue rose from $3.4B in 2020 to $4.0B in 2024, but dipped slightly by 1.1% in the last year. Net income increased from $614M to $690M overall, though the recent period saw declines in EBIT and net margin by around 0.7%. Gross and EBIT margins remain solid at 44.7% and 25.8%, but recent margin trends are less favorable.
Which one has the stronger fundamentals?
The Southern Company exhibits stronger fundamentals with consistent revenue and net income growth, expanding margins, and positive one-year momentum in profitability metrics. Conversely, Alliant Energy faces recent revenue and margin contractions, with an overall less favorable income statement evaluation. Southern’s higher favorable statement percentage signals more robust financial health.
Financial Ratios Comparison
The table below compares key financial ratios for The Southern Company (SO) and Alliant Energy Corporation (LNT) based on their most recent fiscal year data (2024).
| Ratios | The Southern Company (SO) | Alliant Energy Corporation (LNT) |
|---|---|---|
| ROE | 13.3% | 9.9% |
| ROIC | 4.3% | 4.9% |
| P/E | 20.5 | 22.0 |
| P/B | 2.72 | 2.17 |
| Current Ratio | 0.67 | 0.44 |
| Quick Ratio | 0.46 | 0.33 |
| D/E (Debt to Equity) | 2.00 | 1.49 |
| Debt-to-Assets | 45.7% | 45.8% |
| Interest Coverage | 2.58 | 1.97 |
| Asset Turnover | 0.18 | 0.18 |
| Fixed Asset Turnover | 0.25 | 0.21 |
| Payout ratio | 67.1% | 71.3% |
| Dividend yield | 3.27% | 3.24% |
Interpretation of the Ratios
The Southern Company
The Southern Company shows a mix of ratio strengths and weaknesses. Its net margin of 16.47% is favorable, though return on invested capital (4.25%) and liquidity ratios are weak, indicating potential operational and short-term financial challenges. The dividend yield is attractive at 3.27%, supported by regular dividends and stable shareholder returns, though some caution is warranted given mixed coverage by free cash flow.
Alliant Energy Corporation
Alliant Energy exhibits favorable net margin (17.33%) but weaker return on equity (9.85%) and return on invested capital (4.88%), signaling some operational inefficiencies. Liquidity and leverage ratios also appear unfavorable. The company offers a dividend yield of 3.24%, maintaining consistent payouts to shareholders, but free cash flow coverage and capital structure pose moderate risks.
Which one has the best ratios?
Both companies face challenges with liquidity and asset turnover, while maintaining favorable net margins and dividend yields near 3.2%. The Southern Company has a slightly better return on equity and interest coverage, but Alliant Energy shows a lower debt-to-equity ratio. Overall, both display slightly unfavorable global ratio profiles, with neither decisively outperforming the other.
Strategic Positioning
This section compares the strategic positioning of The Southern Company and Alliant Energy Corporation, focusing on market position, key segments, and exposure to technological disruption:
The Southern Company
- Leading regulated electric utility with significant market cap of 95.7B and low beta, facing stable competitive pressure.
- Diverse segments including gas distribution, marketing, pipeline investments, electric utilities, and renewable energy projects.
- Operates multiple renewable energy facilities and advanced digital communications, indicating moderate exposure to technological changes.
Alliant Energy Corporation
- Smaller regulated electric utility with market cap of 16.7B and moderate beta, under steady competitive pressure.
- Focused on electric and gas utility operations with additional freight and logistics services in Iowa and Wisconsin.
- Owns wind and natural gas generation units, suggesting some exposure to renewable energy transition and technology.
The Southern Company vs Alliant Energy Corporation Positioning
The Southern Company pursues a diversified strategy across gas, electric, and renewable segments, offering broader revenue sources. Alliant Energy focuses more narrowly on electric and gas utilities, with regional freight operations, implying more concentrated business drivers and potentially less diversification.
Which has the best competitive advantage?
Both companies are currently shedding value as ROIC is below WACC. Southern’s growing ROIC contrasts with Alliant’s stable but unfavorable trend, indicating Southern may be improving profitability despite value destruction.
Stock Comparison
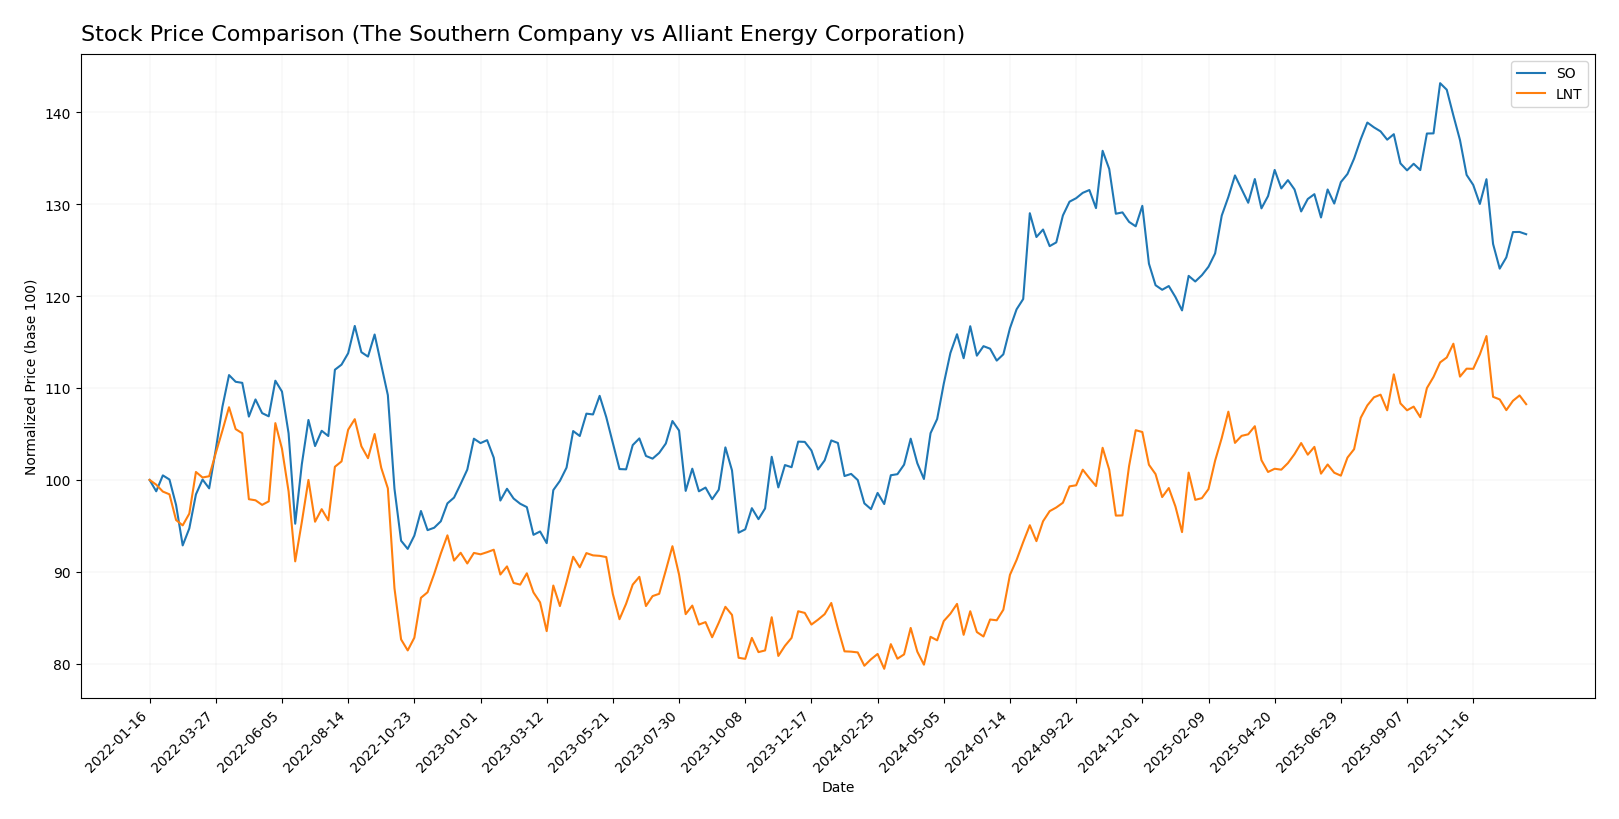
The stock price movements of The Southern Company (SO) and Alliant Energy Corporation (LNT) over the past year reveal strong bullish trends with recent deceleration and short-term declines in both shares.
Trend Analysis
The Southern Company’s stock posted a 30.88% increase over the past 12 months, indicating a bullish trend with decelerating momentum. The price ranged from a low of 66.48 to a high of 98.29, with volatility reflected in a 7.54 std deviation. Recent months show a 9.25% drop and a negative slope, signaling short-term weakness.
Alliant Energy Corporation recorded a 34.48% rise in the last year, confirming a bullish trend with deceleration. The stock fluctuated between 47.73 and 69.47, with a 5.9 std deviation. Its recent 5.73% decline and moderate negative slope suggest a mild pullback phase.
Comparing both stocks, Alliant Energy outperformed The Southern Company with a higher overall gain of 34.48% versus 30.88%. Both experienced recent downward corrections, but LNT delivered the strongest yearly market performance.
Target Prices
Analysts present a clear consensus on target prices for The Southern Company and Alliant Energy Corporation, indicating moderate upside potential.
| Company | Target High | Target Low | Consensus |
|---|---|---|---|
| The Southern Company | 103 | 76 | 93.1 |
| Alliant Energy Corporation | 78 | 65 | 73 |
The Southern Company’s consensus target of 93.1 surpasses its current price of 87.01, suggesting potential growth. Alliant Energy’s consensus target of 73 is notably above its current 65.02 price, reflecting positive analyst expectations.
Analyst Opinions Comparison
This section compares analysts’ ratings and grades for The Southern Company and Alliant Energy Corporation:
Rating Comparison
The Southern Company Rating
- Rating: B-, considered very favorable overall.
- Discounted Cash Flow Score: Moderate at 3, indicating fair valuation.
- ROE Score: Favorable at 4, showing efficient profit generation from equity.
- ROA Score: Moderate at 3, reflecting average asset utilization.
- Debt To Equity Score: Very unfavorable at 1, signaling high financial risk.
- Overall Score: Moderate at 3, summarizing financial standing.
Alliant Energy Corporation Rating
- Rating: C+, considered very favorable overall.
- Discounted Cash Flow Score: Moderate at 3, indicating fair valuation.
- ROE Score: Very unfavorable at 1, indicating weak equity profit efficiency.
- ROA Score: Favorable at 4, reflecting strong asset utilization.
- Debt To Equity Score: Very unfavorable at 1, signaling high financial risk.
- Overall Score: Moderate at 2, summarizing financial standing.
Which one is the best rated?
Based strictly on provided data, The Southern Company holds a higher overall rating (B-) and better scores in ROE and overall financial standing, whereas Alliant Energy Corporation scores higher only in ROA but has a lower overall score.
Scores Comparison
Here is a comparison of the financial scores for The Southern Company and Alliant Energy Corporation:
SO Scores
- Altman Z-Score: 0.98, in the distress zone, indicating high bankruptcy risk.
- Piotroski Score: 6, classified as average financial strength.
LNT Scores
- Altman Z-Score: unavailable, no data provided.
- Piotroski Score: 5, also classified as average financial strength.
Which company has the best scores?
Based on the available data, SO has a clearly defined Altman Z-Score indicating financial distress, while LNT’s Altman score is unavailable. Both have average Piotroski scores, with SO slightly higher at 6 versus 5.
Grades Comparison
Here is a detailed comparison of the latest grades issued by major financial institutions for the two companies:
The Southern Company Grades
The following table presents recent grades from recognized grading companies for The Southern Company:
| Grading Company | Action | New Grade | Date |
|---|---|---|---|
| UBS | Maintain | Neutral | 2025-12-17 |
| JP Morgan | Maintain | Neutral | 2025-12-15 |
| Jefferies | Maintain | Neutral | 2025-12-15 |
| RBC Capital | Maintain | Sector Perform | 2025-12-12 |
| Keybanc | Maintain | Underweight | 2025-12-12 |
| Mizuho | Maintain | Neutral | 2025-12-11 |
| Barclays | Maintain | Equal Weight | 2025-11-20 |
| Jefferies | Downgrade | Neutral | 2025-11-05 |
| Ladenburg Thalmann | Downgrade | Neutral | 2025-10-17 |
| Keybanc | Maintain | Underweight | 2025-10-15 |
The Southern Company’s ratings show a predominantly neutral or hold stance, with some underweight and sector perform grades, reflecting a cautious outlook from analysts.
Alliant Energy Corporation Grades
Below are the recent grades from established grading companies for Alliant Energy Corporation:
| Grading Company | Action | New Grade | Date |
|---|---|---|---|
| UBS | Maintain | Buy | 2025-12-17 |
| UBS | Upgrade | Buy | 2025-10-24 |
| B of A Securities | Maintain | Buy | 2025-10-17 |
| BMO Capital | Maintain | Market Perform | 2025-10-17 |
| Barclays | Maintain | Underweight | 2025-10-14 |
| UBS | Maintain | Neutral | 2025-10-10 |
| B of A Securities | Maintain | Buy | 2025-08-14 |
| BMO Capital | Maintain | Market Perform | 2025-08-11 |
| UBS | Maintain | Neutral | 2025-07-11 |
| Jefferies | Maintain | Buy | 2025-07-11 |
Alliant Energy Corporation holds a generally positive rating profile, with multiple buy grades and some market perform ratings, indicating favorable analyst sentiment overall.
Which company has the best grades?
Alliant Energy Corporation has received stronger and more positive grades compared to The Southern Company, with numerous buy ratings versus mostly neutral and hold recommendations for The Southern Company. This difference may lead investors to perceive Alliant as having better growth or value potential based on analyst opinions.
Strengths and Weaknesses
Below is a comparison table highlighting the strengths and weaknesses of The Southern Company (SO) and Alliant Energy Corporation (LNT) based on the most recent financial and operational data.
| Criterion | The Southern Company (SO) | Alliant Energy Corporation (LNT) |
|---|---|---|
| Diversification | Moderate diversification with strong electric utilities and Southern Company Gas segments | More focused on electric and gas utilities with less segment variety |
| Profitability | Net margin 16.47% (favorable), ROIC 4.25% (unfavorable), growing ROIC trend but currently shedding value | Net margin 17.33% (favorable), ROIC 4.88% (unfavorable), stable ROIC but shedding value |
| Innovation | Moderate innovation with steady revenue from gas marketing and electric utilities | Limited innovation visible; steady revenues mostly from electric segment |
| Global presence | Primarily US-based with strong regional presence in the Southeast | Regional focus mainly in the Midwest US |
| Market Share | Large market share in electric and gas sectors, with $22.9B electric utilities revenue in 2024 | Smaller market share; $3.37B electric revenue in 2024, gas is a smaller segment |
Key takeaways: Both companies exhibit favorable net margins but struggle with ROIC below WACC, indicating value destruction despite stable or improving profitability. Southern Company shows more diversification and a growing ROIC trend, while Alliant Energy is more regionally focused with stable but less dynamic profitability. Investors should weigh diversification and growth potential against current value creation challenges.
Risk Analysis
Below is a comparative table summarizing key risks for The Southern Company (SO) and Alliant Energy Corporation (LNT) based on the latest 2024 data:
| Metric | The Southern Company (SO) | Alliant Energy Corporation (LNT) |
|---|---|---|
| Market Risk | Low beta (0.447) indicates less volatility | Moderate beta (0.671) indicates moderate volatility |
| Debt level | High Debt-to-Equity (2.0, unfavorable) | Elevated Debt-to-Equity (1.49, unfavorable) |
| Regulatory Risk | Significant due to utility sector regulation | Similar regulatory exposure as a utility provider |
| Operational Risk | Complex infrastructure with diverse generation assets | Smaller scale but still exposed to operational disruptions |
| Environmental Risk | Exposure to fossil fuels and nuclear plants | Mix of natural gas and renewables, moderate risk |
| Geopolitical Risk | Limited, primarily U.S. operations | Limited, primarily U.S. operations |
The most impactful and likely risks are the high debt levels for both companies, increasing financial risk amid rising interest rates. Additionally, regulatory risk remains significant given their roles as regulated utilities. Southern’s broader asset base adds operational complexity but also diversification.
Which Stock to Choose?
The Southern Company (SO) has shown favorable income growth with a 31.16% revenue increase over five years and a stable net margin of 16.47%. Its financial ratios are slightly unfavorable, marked by a high debt-to-equity ratio and weak liquidity, though profitability remains moderate. The company’s rating is very favorable (B-), despite some debt concerns, and its economic moat is slightly unfavorable due to value destruction but improving ROIC.
Alliant Energy Corporation (LNT) experienced lower revenue growth at 16.54% over the period, with a slightly higher net margin of 17.33%. Its financial ratios are also slightly unfavorable, mainly due to weak liquidity and debt management. The rating is very favorable (C+), but with a more unfavorable economic moat signifying value destruction and stable profitability. LNT’s recent income growth trends appear less positive compared to SO.
Investors focused on growth and income quality might find The Southern Company’s stronger income growth and improving profitability more appealing, while those prioritizing stable recent profitability and dividend yield could see Alliant Energy as a viable consideration. Both companies exhibit slightly unfavorable financial ratios and economic moats, suggesting cautious evaluation based on individual risk tolerance and investment goals.
Disclaimer: Investment carries a risk of loss of initial capital. The past performance is not a reliable indicator of future results. Be sure to understand risks before making an investment decision.
Go Further
I encourage you to read the complete analyses of The Southern Company and Alliant Energy Corporation to enhance your investment decisions: