In the evolving landscape of regulated electric utilities, Public Service Enterprise Group Incorporated (PEG) and Alliant Energy Corporation (LNT) stand out as prominent players. Both companies operate in the U.S. utility sector, focusing on electricity and gas distribution with strong commitments to innovation and sustainability. This comparison explores their market positions, operational scope, and growth strategies to help you identify the most compelling investment opportunity. Let’s determine which company offers better potential for your portfolio.
Table of contents
Companies Overview
I will begin the comparison between Public Service Enterprise Group Incorporated and Alliant Energy Corporation by providing an overview of these two companies and their main differences.
Public Service Enterprise Group Incorporated Overview
Public Service Enterprise Group Incorporated (PEG) operates as an energy company primarily in the Northeastern and Mid-Atlantic United States. Through its subsidiaries, it transmits and distributes electricity and gas to residential, commercial, and industrial customers. PEG also invests in solar generation projects and energy efficiency programs, managing extensive electric and gas infrastructure including thousands of circuit miles and substations.
Alliant Energy Corporation Overview
Alliant Energy Corporation (LNT) is a utility holding company providing regulated electricity and natural gas services mainly in Iowa and Wisconsin. It operates through segments focused on electric and gas operations and owns subsidiaries generating and distributing electricity and natural gas to retail and wholesale customers. LNT also runs freight services and holds interests in natural gas and wind power generating units.
Key similarities and differences
Both PEG and LNT operate in the regulated electric utility sector, providing electricity and natural gas services to residential, commercial, and industrial customers. PEG’s operations are concentrated in the Northeast and Mid-Atlantic, with a strong emphasis on infrastructure and solar investments. LNT focuses on the Midwest with diversified utility segments and additional freight operations, alongside renewable energy assets like wind farms and natural gas-fired plants.
Income Statement Comparison
The following table compares the key income statement metrics for Public Service Enterprise Group Incorporated and Alliant Energy Corporation for the fiscal year 2024, providing a snapshot of their financial performance.
| Metric | Public Service Enterprise Group Incorporated (PEG) | Alliant Energy Corporation (LNT) |
|---|---|---|
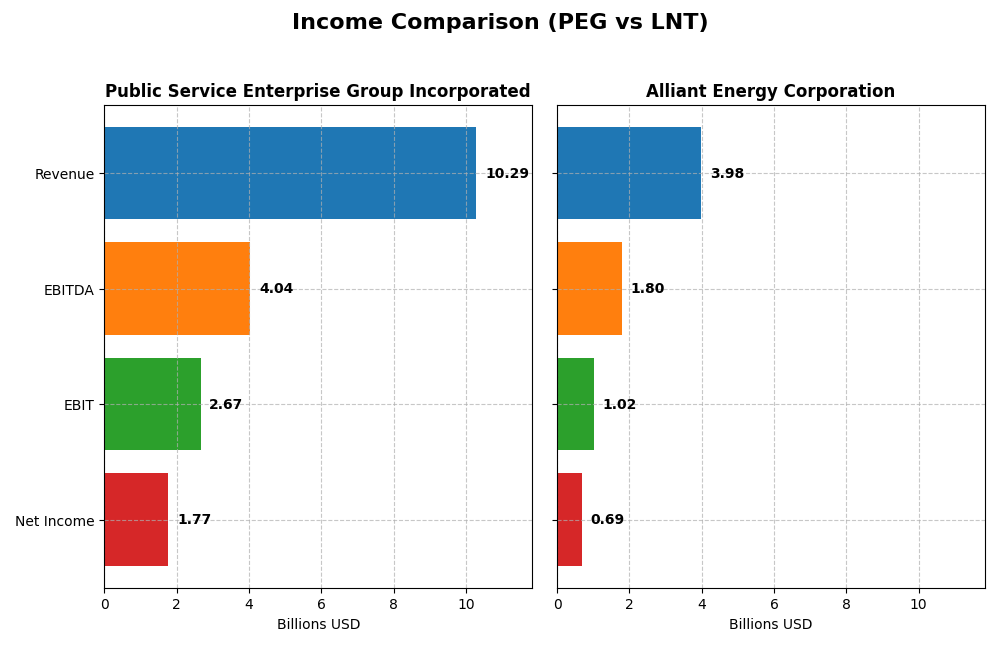
| Market Cap | 39.3B | 16.7B |
| Revenue | 10.3B | 4.0B |
| EBITDA | 4.0B | 1.8B |
| EBIT | 2.7B | 1.0B |
| Net Income | 1.8B | 690M |
| EPS | 3.56 | 2.69 |
| Fiscal Year | 2024 | 2024 |
Income Statement Interpretations
Public Service Enterprise Group Incorporated
From 2020 to 2024, PEG’s revenue showed modest overall growth of 7.15%, yet net income declined by nearly 7%, reflecting pressure on profitability. Margins remain relatively stable, with a favorable gross margin of 34.41% and net margin of 17.22%. However, the most recent year saw an 8.43% revenue drop and a significant 30.99% decline in EPS, indicating weakening earnings performance.
Alliant Energy Corporation
LNT experienced stronger revenue growth of 16.54% across the 2020-2024 period, with net income rising 10.58%, supported by a favorable gross margin of 44.71% and net margin of 17.33%. Despite this, the latest year revealed a slight revenue decrease of 1.14% and a 3.24% drop in EPS, suggesting a mild slowing in momentum. Interest expenses are less favorable compared to PEG, at 11.28%.
Which one has the stronger fundamentals?
Both companies face challenges in their recent annual growth, reflected in unfavorable short-term trends. PEG exhibits weaker earnings growth and margin contraction, while LNT maintains higher margins and better overall revenue and net income growth. Nonetheless, neither’s short-term outlook is fully positive, with both scoring an overall unfavorable income statement opinion for 2024.
Financial Ratios Comparison
The table below presents a side-by-side comparison of key financial ratios for Public Service Enterprise Group Incorporated (PEG) and Alliant Energy Corporation (LNT) based on their most recent full-year data for 2024.
| Ratios | PEG (2024) | LNT (2024) |
|---|---|---|
| ROE | 11.0% | 9.9% |
| ROIC | 4.4% | 4.9% |
| P/E | 23.7 | 22.0 |
| P/B | 2.61 | 2.17 |
| Current Ratio | 0.65 | 0.44 |
| Quick Ratio | 0.48 | 0.33 |
| D/E (Debt-to-Equity) | 1.42 | 1.49 |
| Debt-to-Assets | 41.9% | 45.8% |
| Interest Coverage | 2.80 | 1.97 |
| Asset Turnover | 0.19 | 0.18 |
| Fixed Asset Turnover | 0.26 | 0.21 |
| Payout Ratio | 67.5% | 71.3% |
| Dividend Yield | 2.84% | 3.24% |
Interpretation of the Ratios
Public Service Enterprise Group Incorporated
Public Service Enterprise Group shows a mixed ratio profile with favorable net margin (17.22%) and dividend yield (2.84%), but some concerns arise from its low current (0.65) and quick ratios (0.48), and high debt-to-equity (1.42). The return on invested capital (4.4%) is unfavorable, indicating modest operational efficiency. The company offers a steady dividend supported by a payout ratio that appears sustainable, though free cash flow coverage is weak.
Alliant Energy Corporation
Alliant Energy exhibits strengths in net margin (17.33%) and dividend yield (3.24%) but faces challenges with liquidity ratios (current ratio 0.44, quick ratio 0.33) and debt levels (debt-to-equity 1.49). Return on equity (9.85%) and invested capital (4.88%) are unfavorable, suggesting limited profitability efficiency. The dividend payout is consistent, though free cash flow coverage and debt servicing require monitoring.
Which one has the best ratios?
Both companies have similar percentages of favorable ratios (21.43%) and share a slightly unfavorable global ratio opinion, but Public Service Enterprise Group holds marginally better liquidity and profitability metrics. Alliant Energy’s higher debt and weaker liquidity ratios weigh on its profile, though it offers a higher dividend yield. Overall, ratio strengths and weaknesses are closely matched with nuanced differences.
Strategic Positioning
This section compares the strategic positioning of PEG and LNT, including their market position, key segments, and exposure to technological disruption:
PEG
- Operating in the Northeastern and Mid-Atlantic U.S., facing regulated electric industry pressures.
- Key segments include electric and gas distribution, transmission, and solar generation projects.
- Moderate exposure through investments in solar projects and energy efficiency programs.
LNT
- Serves Midwest U.S. markets, with regulated electric and gas operations under competitive pressure.
- Focuses on electric and gas utility services, plus freight and renewable energy assets.
- Exposure includes wind farm ownership and natural gas generation with some diversification.
PEG vs LNT Positioning
PEG’s strategy is more diversified across electric transmission, gas distribution, and renewable investments, while LNT is concentrated in utility operations with added freight services. PEG’s larger scale offers broader reach but higher complexity, LNT’s focus may yield operational efficiencies.
Which has the best competitive advantage?
Both companies are shedding value with ROIC below WACC; PEG shows improving profitability trends, while LNT maintains stable but unfavorable returns, indicating PEG may have a slightly stronger competitive moat.
Stock Comparison
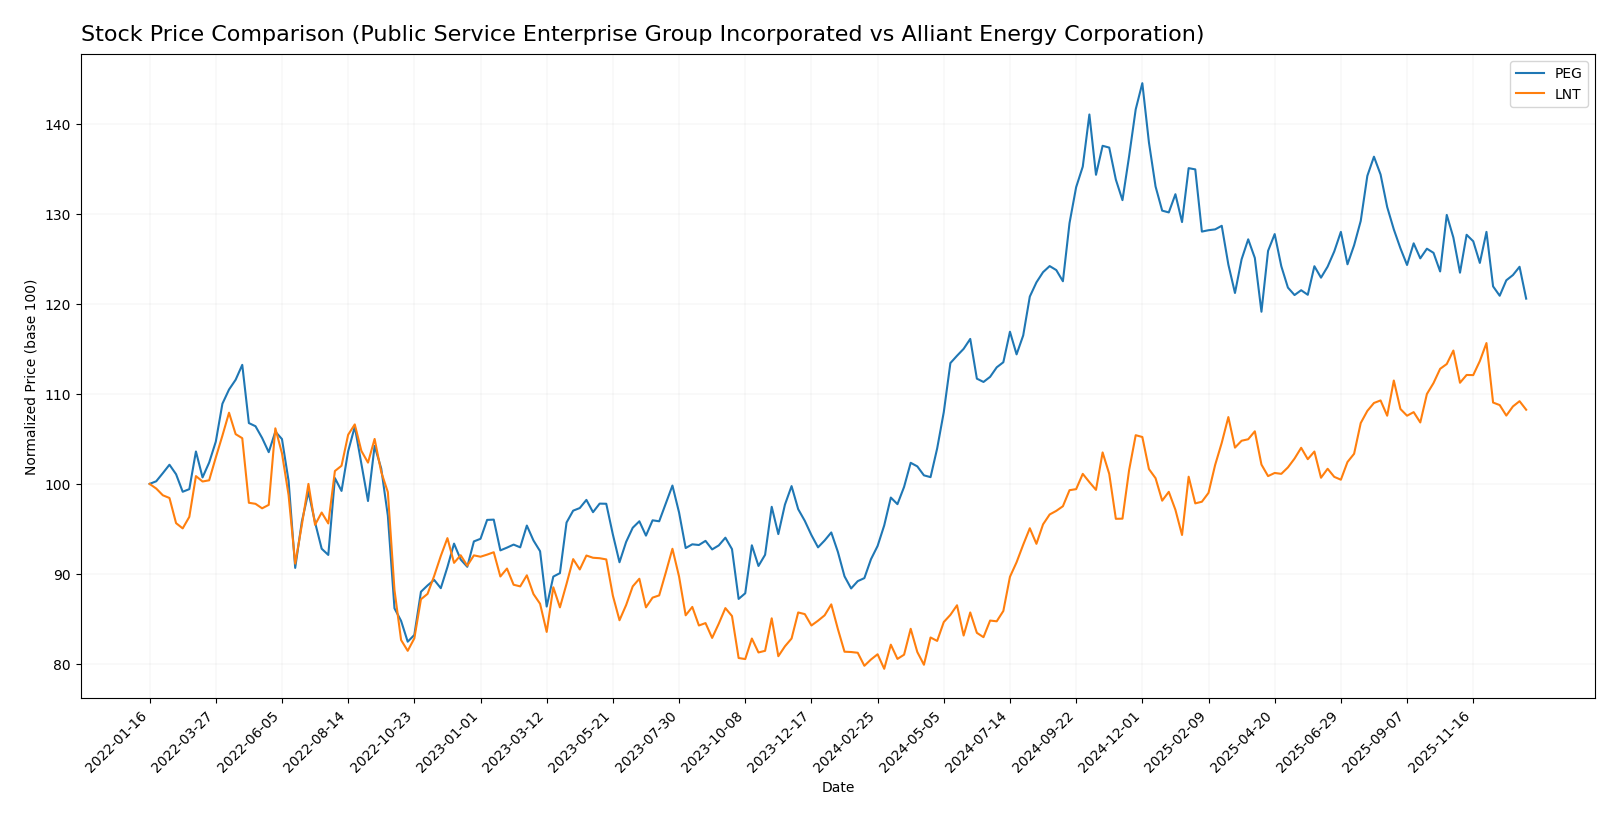
The stock price chart over the past 12 months reveals significant bullish trends for both Public Service Enterprise Group Incorporated (PEG) and Alliant Energy Corporation (LNT), with notable deceleration in momentum and recent short-term declines in price.
Trend Analysis
Public Service Enterprise Group Incorporated (PEG) experienced a bullish trend over the past year with a 31.59% price increase, showing deceleration and a high volatility level (7.17 std deviation). Recent months reflect a slight bearish correction of -5.33%.
Alliant Energy Corporation (LNT) posted a bullish 34.48% rise in stock price over the last 12 months, also with decelerating momentum and somewhat lower volatility (5.9 std deviation). The recent trend shows a minor bearish pullback of -5.73%.
Comparing the two, LNT delivered the higher overall market performance with a 34.48% gain, slightly outperforming PEG’s 31.59% increase during the same period.
Target Prices
The current analyst consensus reveals optimistic target prices for both Public Service Enterprise Group Incorporated and Alliant Energy Corporation.
| Company | Target High | Target Low | Consensus |
|---|---|---|---|
| Public Service Enterprise Group Incorporated | 98 | 83 | 89 |
| Alliant Energy Corporation | 78 | 65 | 73 |
Analysts expect Public Service Enterprise Group’s stock to appreciate significantly from its current price of $78.68, while Alliant Energy’s consensus target of $73 suggests moderate upside from its present $65.02 level.
Analyst Opinions Comparison
This section compares analysts’ ratings and financial scores for Public Service Enterprise Group Incorporated (PEG) and Alliant Energy Corporation (LNT):
Rating Comparison
PEG Rating
- Overall rating is B-, classified as Very Favorable by analysts.
- Discounted Cash Flow Score is 1, indicating a Very Unfavorable valuation.
- Return on Equity Score is 4, showing Favorable profitability from equity.
- Return on Assets Score is 4, reflecting Favorable asset utilization.
- Debt To Equity Score is 2, considered Moderate financial risk.
- Overall Score is 3, rated Moderate in overall financial standing.
LNT Rating
- Overall rating is C+, also classified as Very Favorable by analysts.
- Discounted Cash Flow Score is 3, considered Moderate in valuation.
- Return on Equity Score is 1, indicating Very Unfavorable profitability.
- Return on Assets Score is 4, reflecting Favorable asset utilization.
- Debt To Equity Score is 1, signaling Very Unfavorable financial risk.
- Overall Score is 2, rated Moderate in overall financial standing.
Which one is the best rated?
Based on the provided data, PEG holds a higher overall rating (B-) than LNT (C+) and scores better on return on equity and debt-to-equity metrics. LNT performs better on discounted cash flow but lags on key profitability and risk indicators compared to PEG.
Scores Comparison
The following table compares the Altman Z-Score and Piotroski Score of PEG and LNT:
PEG Scores
- Altman Z-Score: 1.32, in distress zone indicating high bankruptcy risk.
- Piotroski Score: 7, classified as strong financial health.
LNT Scores
- Altman Z-Score: unavailable for evaluation.
- Piotroski Score: 5, indicating average financial strength.
Which company has the best scores?
Based on the provided data, PEG shows a clear Altman Z-Score despite being in distress, and a stronger Piotroski Score at 7 versus LNT’s average score of 5. LNT’s Altman Z-Score is unavailable, limiting a full comparison.
Grades Comparison
The following grades from reputable financial institutions provide a basis for comparison between the two companies:
Public Service Enterprise Group Incorporated Grades
The table below shows recent grades assigned by established grading companies for PEG:
| Grading Company | Action | New Grade | Date |
|---|---|---|---|
| Ladenburg Thalmann | Buy | Buy | 2026-01-07 |
| UBS | Maintain | Buy | 2025-12-17 |
| JP Morgan | Maintain | Overweight | 2025-12-12 |
| Jefferies | Upgrade | Buy | 2025-11-06 |
| TD Cowen | Maintain | Buy | 2025-11-05 |
| BMO Capital | Maintain | Market Perform | 2025-11-04 |
| Barclays | Maintain | Equal Weight | 2025-10-21 |
| BMO Capital | Maintain | Market Perform | 2025-10-20 |
| Morgan Stanley | Maintain | Overweight | 2025-09-25 |
| BMO Capital | Maintain | Market Perform | 2025-08-06 |
Overall, PEG’s grades predominantly indicate a positive outlook, with multiple upgrades and consistent buy ratings.
Alliant Energy Corporation Grades
The table below shows recent grades assigned by established grading companies for LNT:
| Grading Company | Action | New Grade | Date |
|---|---|---|---|
| Argus Research | Downgrade | Hold | 2026-01-09 |
| UBS | Maintain | Buy | 2025-12-17 |
| UBS | Upgrade | Buy | 2025-10-24 |
| B of A Securities | Maintain | Buy | 2025-10-17 |
| BMO Capital | Maintain | Market Perform | 2025-10-17 |
| Barclays | Maintain | Underweight | 2025-10-14 |
| UBS | Maintain | Neutral | 2025-10-10 |
| B of A Securities | Maintain | Buy | 2025-08-14 |
| BMO Capital | Maintain | Market Perform | 2025-08-11 |
| UBS | Maintain | Neutral | 2025-07-11 |
LNT’s grades show a mix of buy and hold ratings with a recent downgrade, indicating a more cautious sentiment.
Which company has the best grades?
Public Service Enterprise Group Incorporated has received stronger and more consistent buy ratings compared to Alliant Energy Corporation, which shows a mix of buy and hold grades with some downgrades. This suggests PEG is viewed more favorably by analysts, possibly affecting investor confidence and perceived growth potential.
Strengths and Weaknesses
Below is a comparison of key strengths and weaknesses for Public Service Enterprise Group Incorporated (PEG) and Alliant Energy Corporation (LNT) based on the latest financial and operational data.
| Criterion | Public Service Enterprise Group (PEG) | Alliant Energy Corporation (LNT) |
|---|---|---|
| Diversification | Highly diversified with significant revenues from Electric (PSEG) and Gas Distribution Contracts totaling over 6B USD in 2024 | Moderate diversification; Electric segment dominates with ~3.37B USD revenue, smaller Gas and Other Utility segments |
| Profitability | Net margin 17.22% (favorable), ROIC 4.4% (unfavorable), ROE 11% (neutral); overall slightly unfavorable profitability | Net margin 17.33% (favorable), ROIC 4.88% (unfavorable), ROE 9.85% (unfavorable); slightly unfavorable profitability |
| Innovation | Limited explicit data; steady ROIC growth suggests improving operational efficiency | ROIC trend neutral, indicating stable but limited innovation impact |
| Global presence | Primarily regional US utility focus, no significant global footprint | Primarily regional US utility focus, no significant global footprint |
| Market Share | Strong position in New Jersey with large electric and gas customer base | Strong presence in Midwest US with stable electric and gas market share |
Key takeaways: Both PEG and LNT operate as regional utilities with solid revenue bases and favorable net margins. However, both show ROIC below WACC, indicating value destruction despite PEG’s improving ROIC trend. Diversification is stronger in PEG, but both face challenges in efficiency and innovation to enhance profitability.
Risk Analysis
Below is a table summarizing key risks for Public Service Enterprise Group Incorporated (PEG) and Alliant Energy Corporation (LNT) based on the latest available data from 2024:
| Metric | Public Service Enterprise Group (PEG) | Alliant Energy Corporation (LNT) |
|---|---|---|
| Market Risk | Moderate beta (0.61), stable sector exposure | Moderate beta (0.67), regulated utility focus |
| Debt level | DE ratio 1.42 (unfavorable), debt/assets 41.9% (neutral) | DE ratio 1.49 (unfavorable), debt/assets 45.8% (neutral) |
| Regulatory Risk | Significant due to regulated electric sector | Similar regulatory exposure, operating in multiple states |
| Operational Risk | Large infrastructure, complexity in gas and electric distribution | Diversified with electric, gas, and freight operations |
| Environmental Risk | Investment in solar, but reliance on fossil fuels remains | Wind farm ownership, natural gas generation with transition risks |
| Geopolitical Risk | Limited, primarily US-focused | Limited, primarily US-focused |
The most impactful risks for both companies stem from their high debt levels relative to equity, which could strain financial flexibility, and regulatory risks inherent to the utility sector. PEG faces operational complexity with its extensive infrastructure, while LNT’s diversification into freight adds operational variability. Environmental transition pressures are increasing, with both companies investing in renewables but still dependent on fossil fuels. Investors should monitor regulatory changes and debt management closely.
Which Stock to Choose?
Public Service Enterprise Group Incorporated (PEG) shows a mixed income evolution with recent declines in revenue and profitability. Its financial ratios reveal several unfavorable metrics, including a low current ratio and high debt levels, though it maintains a neutral to favorable standing in ROE and dividend yield. PEG’s overall rating is very favorable, supported by strong ROE and ROA scores, despite a moderate overall score and concerns about cash flow.
Alliant Energy Corporation (LNT) displays a more stable income evolution with moderate revenue growth over the period but slight recent declines. Its financial ratios indicate challenges with liquidity and leverage, alongside an unfavorable ROE but favorable ROA and dividend yield. LNT holds a very favorable rating, though with moderate overall scores and weaker debt-related metrics compared to PEG.
Considering ratings and financial evaluations, PEG might appear more attractive for investors valuing profitability and financial strength, while LNT could appeal to those prioritizing stable income growth and dividend yield. Risk-averse investors might lean towards PEG’s stronger equity returns, whereas risk-tolerant profiles might consider LNT’s consistent growth trends despite its financial weaknesses.
Disclaimer: Investment carries a risk of loss of initial capital. The past performance is not a reliable indicator of future results. Be sure to understand risks before making an investment decision.
Go Further
I encourage you to read the complete analyses of Public Service Enterprise Group Incorporated and Alliant Energy Corporation to enhance your investment decisions: