In the evolving utilities sector, PPL Corporation and Alliant Energy Corporation stand out as key players delivering regulated electric and natural gas services across different U.S. regions. Both companies embrace innovation to balance traditional energy sources with renewables, targeting stable growth and sustainability. This comparison will explore their market positions, strategies, and financial health to help you identify which company offers the most compelling investment opportunity in 2026.
Table of contents
Companies Overview
I will begin the comparison between PPL Corporation and Alliant Energy Corporation by providing an overview of these two companies and their main differences.
PPL Corporation Overview
PPL Corporation is a utility holding company focused on delivering electricity and natural gas in the US and the UK. It operates primarily through its Kentucky and Pennsylvania regulated segments, serving over 1.7M electric and 333K gas customers. Founded in 1920 and headquartered in Allentown, PA, PPL generates electricity from coal, gas, hydro, and solar sources, positioning itself as a diversified energy provider in regulated markets.
Alliant Energy Corporation Overview
Alliant Energy Corporation is a utility holding company providing regulated electricity and natural gas services mainly in Iowa and Wisconsin. It operates through three segments including Utility Electric and Gas Operations, serving nearly 1M electric and 425K gas retail customers. The company also owns freight and logistics assets and holds interests in natural gas and wind power generation. Incorporated in 1981 and based in Madison, WI, Alliant serves diverse industrial and agricultural customers.
Key similarities and differences
Both PPL and Alliant Energy operate as regulated electric and gas utility holding companies serving large numbers of retail customers in defined regional markets. They generate electricity from multiple sources including gas and renewables. However, PPL has a transatlantic footprint including the UK, while Alliant focuses on the US Midwest and also operates freight logistics services. PPL is larger by market cap and customers, whereas Alliant’s business model includes more diversified utility segments and infrastructure assets.
Income Statement Comparison
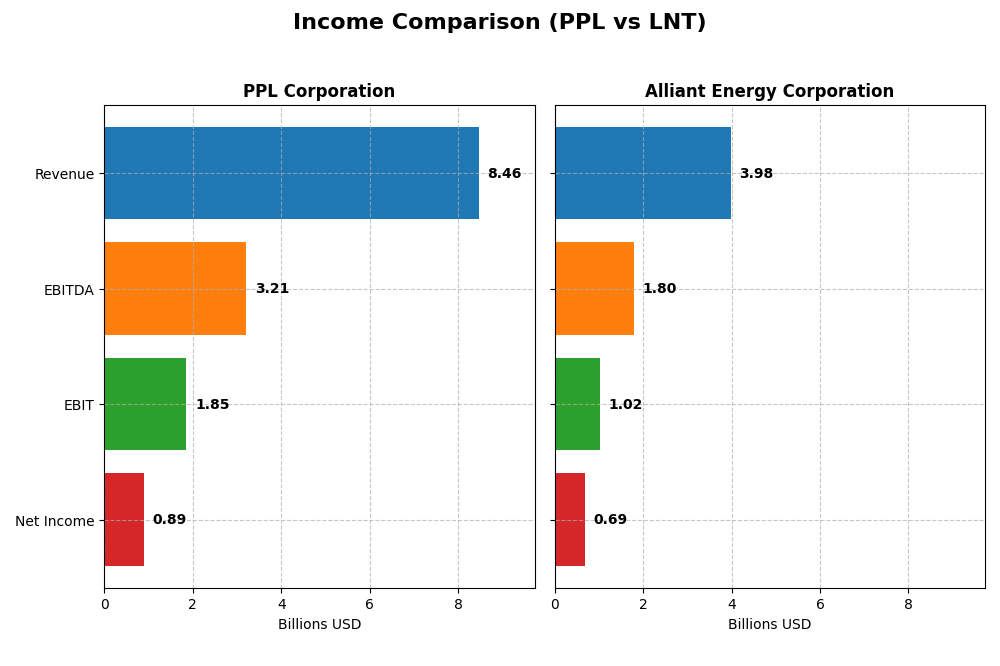
The table below presents a side-by-side comparison of key income statement metrics for PPL Corporation and Alliant Energy Corporation for the fiscal year 2024.
| Metric | PPL Corporation | Alliant Energy Corporation |
|---|---|---|
| Market Cap | 25.6B | 16.7B |
| Revenue | 8.46B | 3.98B |
| EBITDA | 3.21B | 1.80B |
| EBIT | 1.85B | 1.03B |
| Net Income | 888M | 690M |
| EPS | 1.20 | 2.69 |
| Fiscal Year | 2024 | 2024 |
Income Statement Interpretations
PPL Corporation
PPL Corporation’s revenue increased steadily from $5.47B in 2020 to $8.46B in 2024, marking a 54.6% growth over five years. Net income, however, showed volatility, including a significant loss in 2021, resulting in an overall decline of 39.6%. Margins improved recently, with a gross margin of 40.1% and net margin of 10.5% in 2024. The latest year saw modest revenue growth of 1.8%, alongside favorable increases in EBIT and net margin.
Alliant Energy Corporation
Alliant Energy’s revenue grew from $3.42B in 2020 to $3.98B in 2024, with a 16.5% increase over the period. Net income also rose by 10.6%, reaching $690M in 2024. Margins remain solid, with a gross margin of 44.7% and a net margin of 17.3% in 2024, though interest expense ratio is less favorable at 11.3%. The most recent year reflected slight revenue decline (-1.1%) and decreases in EBIT, net margin, and EPS.
Which one has the stronger fundamentals?
PPL shows favorable margin improvements and strong EBIT growth recently but suffers from net income volatility and negative overall net income growth. Conversely, Alliant Energy demonstrates steadier net income growth and higher net margins, though recent declines in profitability metrics and unfavorable interest expense weigh on its fundamentals. Each company presents mixed strengths and risks in income statement performance.
Financial Ratios Comparison
The table below presents a side-by-side comparison of key financial ratios for PPL Corporation and Alliant Energy Corporation based on their most recent full-year data from 2024.
| Ratios | PPL Corporation | Alliant Energy Corporation |
|---|---|---|
| ROE | 6.31% | 9.85% |
| ROIC | 3.59% | 4.88% |
| P/E | 26.97 | 21.98 |
| P/B | 1.70 | 2.17 |
| Current Ratio | 0.86 | 0.44 |
| Quick Ratio | 0.71 | 0.33 |
| D/E | 1.19 | 1.49 |
| Debt-to-Assets | 41% | 46% |
| Interest Coverage | 2.36 | 1.97 |
| Asset Turnover | 0.21 | 0.18 |
| Fixed Asset Turnover | 0.26 | 0.21 |
| Payout Ratio | 84.12% | 71.30% |
| Dividend Yield | 3.12% | 3.24% |
Interpretation of the Ratios
PPL Corporation
PPL Corporation exhibits a mixed ratio profile with a strong net margin of 10.49% and a favorable dividend yield of 3.12%. However, key profitability ratios such as ROE at 6.31% and ROIC at 3.59% are unfavorable, alongside liquidity concerns with a current ratio of 0.86. The payout is supported by a stable dividend per share, but free cash flow coverage is weak, posing sustainability risks.
Alliant Energy Corporation
Alliant Energy shows a stronger net margin of 17.33% and a slightly better dividend yield of 3.24%, yet it also faces unfavorable ROE (9.85%) and ROIC (4.88%) metrics. Its liquidity ratios are weaker, with a current ratio at 0.44. Dividend payments appear consistent, but free cash flow coverage is limited, suggesting cautious monitoring of payout sustainability is warranted.
Which one has the best ratios?
Both companies share several unfavorable ratios, particularly in profitability and liquidity. While Alliant Energy has a higher net margin and dividend yield, PPL’s ratios are more balanced despite some weaknesses. Overall, Alliant Energy presents slightly fewer unfavorable ratios, yet both companies show areas for improvement, resulting in no clear superiority in ratio quality.
Strategic Positioning
This section compares the strategic positioning of PPL Corporation and Alliant Energy Corporation, focusing on their market position, key segments, and exposure to technological disruption:
PPL Corporation
- Operates mainly in regulated electric markets with significant customer base in Kentucky and Pennsylvania.
- Key segments include Kentucky Regulated, Pennsylvania Regulated, and Rhode Island Regulated operations.
- Generates electricity from coal, gas, hydro, and solar; no explicit mention of disruption exposure.
Alliant Energy Corporation
- Serves regulated electric and gas markets, primarily in Iowa and Wisconsin, with wholesale customers in multiple states.
- Business driven by Electric, Gas, and Other Utility segments, including freight and logistics operations.
- Owns natural gas-fired and wind power generation assets; diversified into freight and logistics services.
PPL Corporation vs Alliant Energy Corporation Positioning
PPL shows a more regionally diversified regulated utility focus, while Alliant Energy combines regulated electric, gas, and freight segments. PPL’s energy generation mix contrasts with Alliant’s inclusion of renewable wind assets and logistics diversification.
Which has the best competitive advantage?
Both companies are shedding value relative to their cost of capital; PPL shows a growing ROIC trend, while Alliant Energy’s profitability remains stable but unfavorable, indicating neither has a strong competitive moat.
Stock Comparison
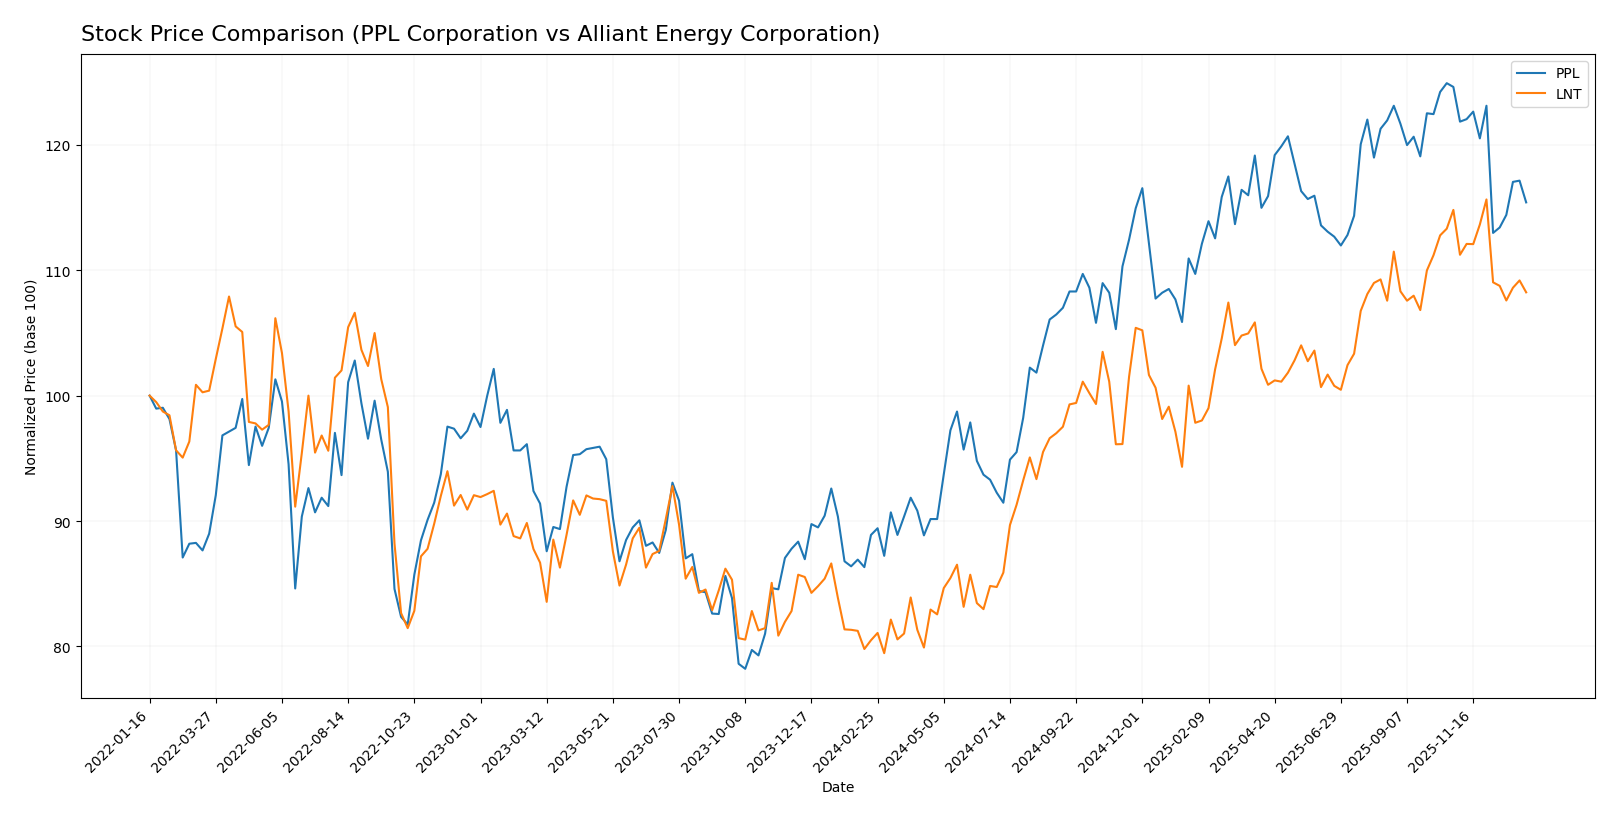
The stock price chart highlights significant bullish trends for both PPL Corporation and Alliant Energy Corporation over the past 12 months, with recent mild downward corrections suggesting deceleration in momentum.
Trend Analysis
PPL Corporation’s stock showed a strong bullish trend with a 29.84% price increase over the past year, accompanied by decelerating momentum and a volatility measure of 3.24. Recent weeks reveal a modest decline of 7.39%.
Alliant Energy Corporation experienced a 34.48% bullish price rise during the same period, also with decelerating acceleration and higher volatility at 5.9. Its recent price drop amounted to 5.73%.
Comparing both, Alliant Energy Corporation delivered the highest market performance over the past year, despite short-term declines for both stocks.
Target Prices
The current analyst consensus provides a clear outlook for both PPL Corporation and Alliant Energy Corporation.
| Company | Target High | Target Low | Consensus |
|---|---|---|---|
| PPL Corporation | 45 | 36 | 41.29 |
| Alliant Energy Corporation | 78 | 65 | 73 |
Analysts expect PPL shares to trade moderately above the current price of 34.59 USD, indicating potential upside. Alliant Energy’s target consensus of 73 USD suggests a stronger bullish sentiment compared to its current price of 65.02 USD.
Analyst Opinions Comparison
This section compares analysts’ ratings and grades for PPL Corporation and Alliant Energy Corporation:
Rating Comparison
PPL Rating
- Rated C+ with a very favorable status, reflecting a solid financial standing.
- Discounted Cash Flow Score: 1, very unfavorable, indicating concerns about valuation.
- Return on Equity Score: 3, moderate, showing decent profitability from equity.
- Return on Assets Score: 3, moderate, reflecting effective asset utilization.
- Debt To Equity Score: 2, moderate, suggesting balanced financial risk.
- Overall Score: 2, moderate, summarizing average financial health.
LNT Rating
- Rated C+ with a very favorable status, indicating a comparable financial health.
- Discounted Cash Flow Score: 3, moderate, showing better valuation prospects.
- Return on Equity Score: 1, very unfavorable, indicating weak equity profitability.
- Return on Assets Score: 4, favorable, showing strong asset efficiency.
- Debt To Equity Score: 1, very unfavorable, implying higher financial leverage.
- Overall Score: 2, moderate, indicating a similar overall financial position.
Which one is the best rated?
Both PPL and LNT share the same overall rating of C+ with moderate overall scores. PPL shows stronger return on equity and a better debt-to-equity profile, while LNT has superior discounted cash flow and return on assets scores.
Scores Comparison
The comparison of company scores highlights key financial health indicators for PPL Corporation and Alliant Energy Corporation:
PPL Scores
- Altman Z-Score: 0.97, in distress zone indicating high bankruptcy risk.
- Piotroski Score: 6, classified as average financial strength.
LNT Scores
- Altman Z-Score: unavailable, no data provided.
- Piotroski Score: 5, also indicating average financial strength.
Which company has the best scores?
PPL has a defined Altman Z-Score indicating financial distress, while LNT’s Altman score is unavailable. Both companies show average Piotroski Scores, with PPL slightly higher at 6 versus 5 for LNT.
Grades Comparison
Here is the comparison of recent grades from reputable grading companies for PPL Corporation and Alliant Energy Corporation:
PPL Corporation Grades
The following table summarizes recent grades from established financial institutions for PPL Corporation:
| Grading Company | Action | New Grade | Date |
|---|---|---|---|
| UBS | maintain | Neutral | 2025-12-17 |
| Wells Fargo | maintain | Overweight | 2025-12-12 |
| JP Morgan | maintain | Overweight | 2025-12-11 |
| BMO Capital | maintain | Outperform | 2025-10-21 |
| B of A Securities | maintain | Buy | 2025-10-16 |
| Barclays | maintain | Equal Weight | 2025-10-14 |
| UBS | maintain | Neutral | 2025-10-10 |
| Morgan Stanley | maintain | Overweight | 2025-09-25 |
| Barclays | maintain | Equal Weight | 2025-07-01 |
| Morgan Stanley | maintain | Overweight | 2025-06-18 |
PPL Corporation’s grades show a consistent trend of buy and outperform ratings, with multiple firms maintaining overweight or buy positions.
Alliant Energy Corporation Grades
Below are the recent grades from recognized grading companies for Alliant Energy Corporation:
| Grading Company | Action | New Grade | Date |
|---|---|---|---|
| Argus Research | downgrade | Hold | 2026-01-09 |
| UBS | maintain | Buy | 2025-12-17 |
| UBS | upgrade | Buy | 2025-10-24 |
| B of A Securities | maintain | Buy | 2025-10-17 |
| BMO Capital | maintain | Market Perform | 2025-10-17 |
| Barclays | maintain | Underweight | 2025-10-14 |
| UBS | maintain | Neutral | 2025-10-10 |
| B of A Securities | maintain | Buy | 2025-08-14 |
| BMO Capital | maintain | Market Perform | 2025-08-11 |
| UBS | maintain | Neutral | 2025-07-11 |
Alliant Energy shows a mixed rating pattern with buy ratings from several firms but also some hold, neutral, market perform, and even underweight grades, including a recent downgrade.
Which company has the best grades?
PPL Corporation has received more consistent buy and outperform grades compared to Alliant Energy Corporation, which exhibits a more mixed and cautious rating profile. This consistency in PPL’s grades may indicate greater analyst confidence, potentially influencing investors toward perceived stability or growth prospects.
Strengths and Weaknesses
Below is a comparison table highlighting the key strengths and weaknesses of PPL Corporation and Alliant Energy Corporation based on their latest financial and operational data.
| Criterion | PPL Corporation | Alliant Energy Corporation |
|---|---|---|
| Diversification | Moderate: Focus on regulated power in Kentucky, Pennsylvania, and Rhode Island | Moderate: Electric and gas utilities with other utility services |
| Profitability | Net margin 10.49% (favorable); ROIC 3.59% (unfavorable); shedding value but improving ROIC | Net margin 17.33% (favorable); ROIC 4.88% (unfavorable); stable but destroying value |
| Innovation | Limited innovation indicators; stable but modest asset turnover | Limited innovation focus; consistent but low asset turnover |
| Global presence | Primarily US-regulated with past UK exposure, now focused domestically | Concentrated in US Midwest with electric and gas segments |
| Market Share | Strong presence in specific US regions, revenue over 8B USD across main segments | Solid regional utility player with about 3.8B USD in electric and gas revenues |
Key takeaways: Both companies operate primarily in regulated US utility markets with moderate diversification. PPL shows improving profitability trends despite current value destruction, while Alliant Energy holds a stronger net margin but remains value-destructive and slightly less dynamic in growth. Investors should weigh PPL’s improving ROIC against Alliant’s stable but less efficient capital use.
Risk Analysis
Below is a comparative table summarizing key risk factors for PPL Corporation and Alliant Energy Corporation based on the most recent 2024 data:
| Metric | PPL Corporation | Alliant Energy Corporation |
|---|---|---|
| Market Risk | Moderate (Beta 0.716) | Moderate (Beta 0.671) |
| Debt Level | High (D/E 1.19, 40.9% debt-to-assets) | Higher (D/E 1.49, 45.8% debt-to-assets) |
| Regulatory Risk | Significant (Utility sector regulation in US/UK) | Significant (Utility regulation in Midwestern US) |
| Operational Risk | Moderate (Diverse generation sources, infrastructure age) | Moderate (Electric and gas operations in multiple states) |
| Environmental Risk | Medium (Coal and gas generation impact) | Medium (Natural gas and wind generation, emissions) |
| Geopolitical Risk | Low (Primarily US/UK exposure) | Low (Primarily US Midwest exposure) |
The most impactful risks for both companies stem from their regulatory environments and debt levels. PPL’s Altman Z-score of 0.97 places it in a financial distress zone, signaling elevated bankruptcy risk. Alliant Energy shows slightly better financial health but still carries considerable leverage. Both firms face environmental scrutiny due to fossil fuel reliance, which can affect operational costs and regulatory compliance. Investors should monitor debt management and regulatory changes closely.
Which Stock to Choose?
PPL Corporation shows a favorable income statement with strong margins and improving profitability, despite a slight revenue growth slowdown. Its financial ratios reveal mostly unfavorable scores, including low liquidity and high leverage, with a very favorable overall rating of C+ but a distress-zone Altman Z-Score, indicating financial vulnerability.
Alliant Energy Corporation has a mixed income evolution with moderate revenue growth but declining profitability indicators recently. Its financial ratios are slightly less unfavorable than PPL’s, with better net margin and return metrics but weaker debt management. It shares the same very favorable rating C+ yet lacks an Altman Z-Score, with a stable but unfavorable moat assessment.
For investors, PPL might appear more attractive for those valuing improving profitability and a favorable income statement despite financial risks. Conversely, LNT could be more suitable for those preferring stable profitability and moderate financial health, albeit with value destruction signs. The choice could depend on the investor’s risk tolerance and focus on growth versus stability.
Disclaimer: Investment carries a risk of loss of initial capital. The past performance is not a reliable indicator of future results. Be sure to understand risks before making an investment decision.
Go Further
I encourage you to read the complete analyses of PPL Corporation and Alliant Energy Corporation to enhance your investment decisions: