In the evolving utilities sector, Alliant Energy Corporation (LNT) and Pinnacle West Capital Corporation (PNW) stand out as key players delivering regulated electric services across the Midwest and Southwest, respectively. Both companies emphasize innovation in clean energy and maintain strong regional customer bases, making them ideal candidates for comparison. This analysis will guide you through their strengths and risks to reveal which company holds the most promise for your investment portfolio.
Table of contents
Companies Overview
I will begin the comparison between Alliant Energy Corporation and Pinnacle West Capital Corporation by providing an overview of these two companies and their main differences.
Alliant Energy Corporation Overview
Alliant Energy Corporation operates as a utility holding company providing regulated electricity and natural gas services primarily in Iowa and Wisconsin. Through subsidiaries, it generates and distributes electricity and natural gas to retail and wholesale customers, serving industries such as farming, manufacturing, and chemical. The company also operates freight services and owns interests in natural gas and wind power generation assets.
Pinnacle West Capital Corporation Overview
Pinnacle West Capital Corporation, through its subsidiary Arizona Public Service Company, offers retail and wholesale electric services mainly in Arizona. It manages generation, transmission, and distribution of electricity using diverse energy sources including coal, nuclear, gas, oil, and solar. The company serves approximately 1.3M customers and maintains an extensive network of overhead and underground transmission and distribution lines.
Key similarities and differences
Both companies operate in the regulated electric utility sector and serve retail and wholesale customers, focusing on electricity generation and distribution. Alliant Energy has a significant presence in both electric and gas utilities with additional freight operations, while Pinnacle West concentrates exclusively on electric services with a broader mix of energy sources. Pinnacle West operates a larger customer base and electric infrastructure compared to Alliant Energy.
Income Statement Comparison
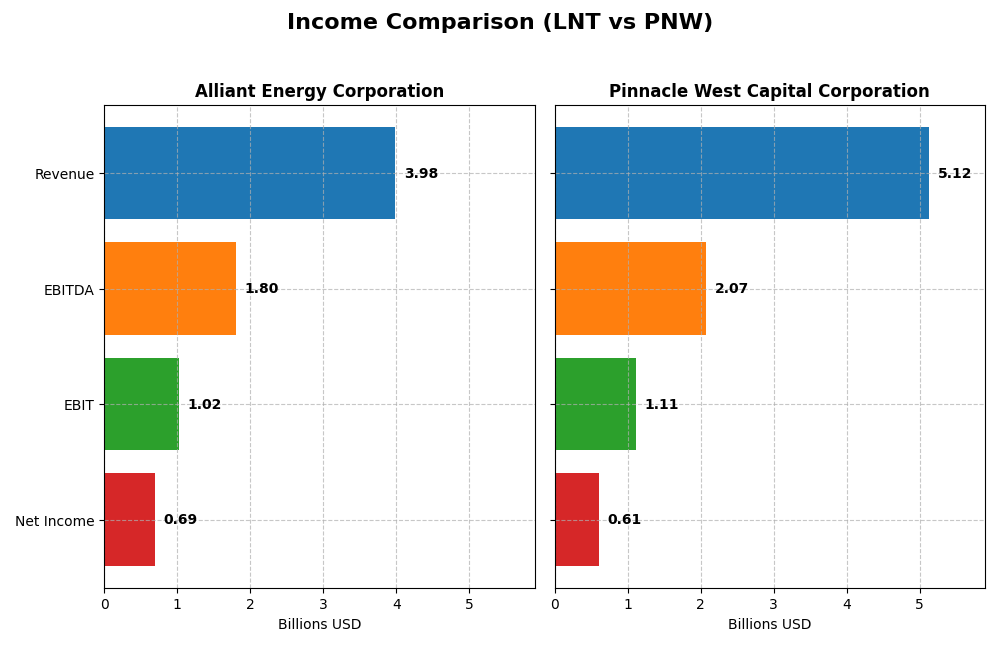
This table presents a side-by-side comparison of key income statement metrics for Alliant Energy Corporation and Pinnacle West Capital Corporation, based on their most recent fiscal year data.
| Metric | Alliant Energy Corporation | Pinnacle West Capital Corporation |
|---|---|---|
| Market Cap | 16.7B | 10.7B |
| Revenue | 3.98B | 5.12B |
| EBITDA | 1.80B | 2.07B |
| EBIT | 1.03B | 1.11B |
| Net Income | 690M | 609M |
| EPS | 2.69 | 5.35 |
| Fiscal Year | 2024 | 2024 |
Income Statement Interpretations
Alliant Energy Corporation
Alliant Energy’s revenue grew 16.54% from 2020 to 2024 but declined 1.14% in the last year, with net income up 10.58% overall but down 1.85% most recently. Gross and EBIT margins remained solid at 44.7% and 25.8%, respectively, while net margin slipped slightly to 17.3%. The 2024 results showed slower growth and margin contraction, reflecting some operational pressures.
Pinnacle West Capital Corporation
Pinnacle West achieved a strong 42.9% revenue increase from 2020 to 2024 and a 9.13% rise last year, with net income growing 10.6% overall and 21.3% most recently. Gross margin stood at 41.7%, EBIT margin at 21.7%, and net margin improved to 11.9%. The latest fiscal year marked robust gains in profitability and earnings per share, signaling operational strength.
Which one has the stronger fundamentals?
Pinnacle West exhibits a more favorable income statement profile, with higher growth rates in revenue, net income, EBIT, and EPS in the latest year, alongside more consistent margin improvements. Alliant Energy shows solid margins but faces recent revenue and net income declines and higher interest expense. Overall, Pinnacle West’s fundamentals appear stronger based on income statement trends and margin stability.
Financial Ratios Comparison
The table below presents a side-by-side comparison of key financial ratios for Alliant Energy Corporation (LNT) and Pinnacle West Capital Corporation (PNW) for the fiscal year ended 2024.
| Ratios | Alliant Energy Corporation (LNT) | Pinnacle West Capital Corporation (PNW) |
|---|---|---|
| ROE | 9.85% | 9.01% |
| ROIC | 4.88% | 3.48% |
| P/E | 21.98 | 15.85 |
| P/B | 2.17 | 1.43 |
| Current Ratio | 0.44 | 0.59 |
| Quick Ratio | 0.33 | 0.42 |
| D/E (Debt-to-Equity) | 1.49 | 1.64 |
| Debt-to-Assets | 45.8% | 42.3% |
| Interest Coverage | 1.97 | 2.68 |
| Asset Turnover | 0.18 | 0.20 |
| Fixed Asset Turnover | 0.21 | 0.25 |
| Payout ratio | 71.3% | 64.8% |
| Dividend yield | 3.24% | 4.09% |
Interpretation of the Ratios
Alliant Energy Corporation
Alliant Energy shows a mixed ratio profile with a favorable net margin of 17.33% but unfavorable returns on equity (9.85%) and invested capital (4.88%). Its liquidity ratios are weak, with a current ratio of 0.44 and quick ratio of 0.33. The dividend yield is favorable at 3.24%, indicating consistent shareholder returns supported by dividend payments, though coverage by free cash flow should be monitored for sustainability.
Pinnacle West Capital Corporation
Pinnacle West Capital displays a favorable net margin of 11.88% and lower price-to-book ratio (1.43), indicating good valuation metrics, though returns on equity (9.01%) and invested capital (3.48%) remain unfavorable. Liquidity ratios are below 1, signaling some short-term risk. The dividend yield stands at 4.09%, suggesting solid shareholder returns, with dividends likely supported by stable cash flows.
Which one has the best ratios?
Both companies face similar challenges in returns and liquidity, with half of their ratios marked as unfavorable. Pinnacle West has a slight edge in valuation and dividend yield, while Alliant Energy benefits from a higher net margin. Overall, both firms present a slightly unfavorable ratio profile, requiring cautious analysis of their financial health.
Strategic Positioning
This section compares the strategic positioning of Alliant Energy Corporation and Pinnacle West Capital Corporation, focusing on Market position, Key segments, and Exposure to technological disruption:
Alliant Energy Corporation
- Mid-sized regulated electric utility with competitive pressure in Midwest markets.
- Diversified utility segments: electric, gas, and other utility services drive revenue.
- Moderate exposure to technological disruption via natural gas and wind power assets.
Pinnacle West Capital Corporation
- Regulated electric utility with dominant market presence in Arizona.
- Primarily electric generation and transmission, with coal, nuclear, gas, oil, and solar facilities.
- Exposure to disruption includes solar and traditional fossil fuel generation mix.
Alliant Energy Corporation vs Pinnacle West Capital Corporation Positioning
Alliant Energy has a diversified utility portfolio across multiple states and energy sources, while Pinnacle West focuses on electric services mainly in Arizona with a mix of generation types. Diversification benefits Alliant’s market spread; Pinnacle West’s regional focus supports scale in Arizona but limits geographic reach.
Which has the best competitive advantage?
Both companies are currently shedding value as their ROIC falls below WACC. Alliant’s stable but unfavorable moat contrasts with Pinnacle West’s very unfavorable status and declining profitability, indicating Alliant holds a relatively stronger competitive position.
Stock Comparison
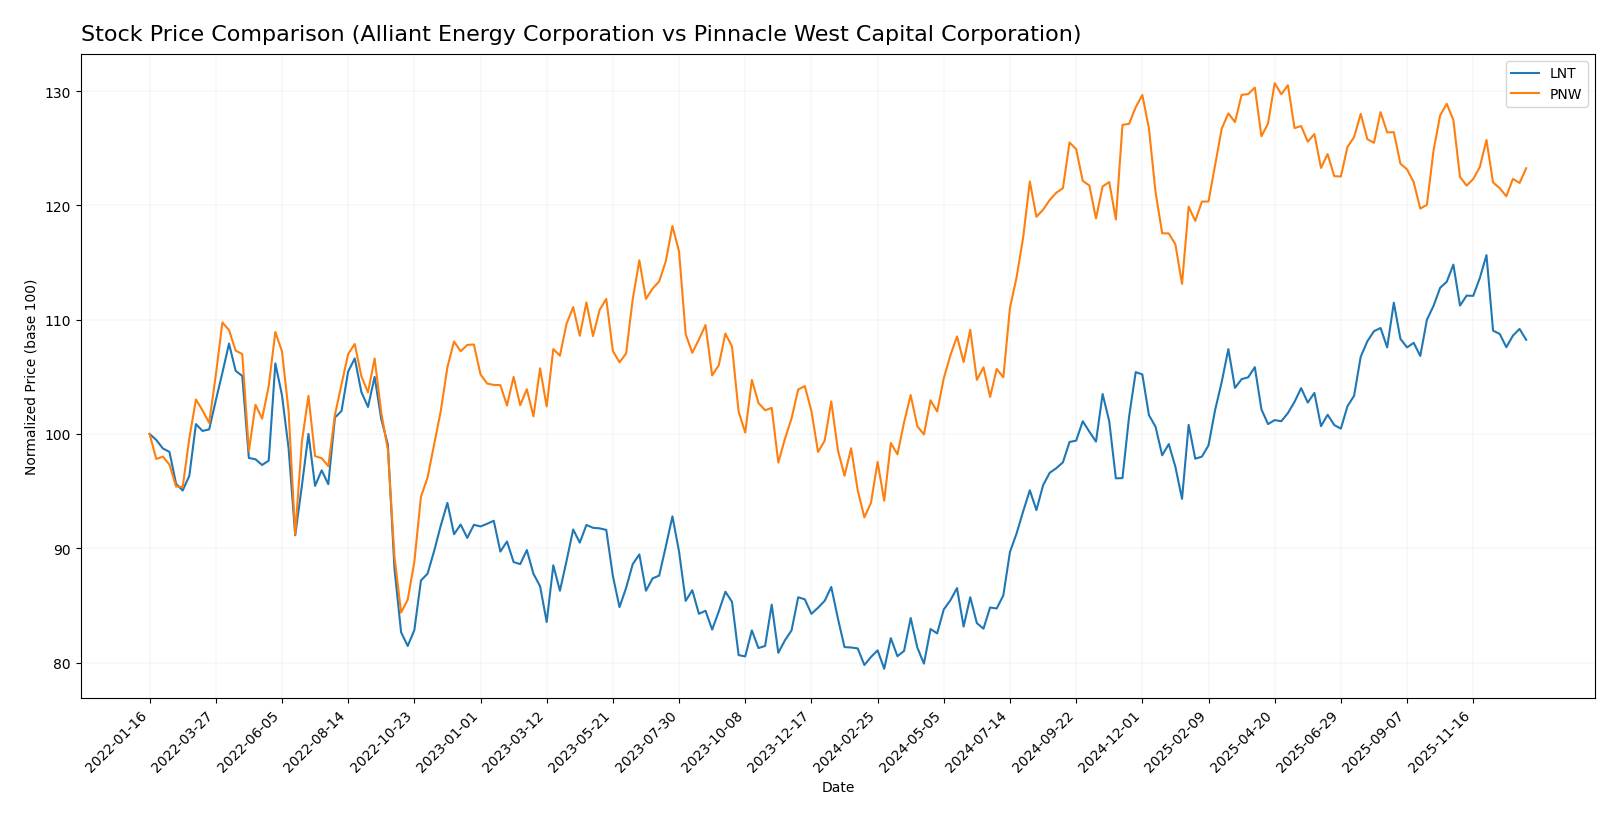
The stock prices of Alliant Energy Corporation (LNT) and Pinnacle West Capital Corporation (PNW) have shown significant bullish trends over the past 12 months, with recent periods indicating a mild downward correction in both cases.
Trend Analysis
Alliant Energy Corporation’s stock recorded a 34.48% increase over the past year, indicating a bullish trend with decelerating momentum. The price ranged from a low of 47.73 to a high of 69.47, with volatility measured by a 5.9 standard deviation. Recent weeks show a slight downward trend of -5.73%.
Pinnacle West Capital Corporation’s stock rose 31.14% over the same period, also bullish with deceleration in momentum. Its price fluctuated between 67.92 and 94.45, with volatility at 6.87 standard deviation. The latest trend indicates a modest decline of -3.31%.
Comparing the two, Alliant Energy delivered a marginally higher market performance over the past year, both stocks showing decelerating bullish trends and recent short-term declines.
Target Prices
The current analyst consensus provides a positive outlook for both Alliant Energy Corporation and Pinnacle West Capital Corporation.
| Company | Target High | Target Low | Consensus |
|---|---|---|---|
| Alliant Energy Corporation | 78 | 65 | 73 |
| Pinnacle West Capital Corporation | 115 | 85 | 96.33 |
Analysts expect Alliant Energy’s price to rise modestly above its current 65.02 USD, while Pinnacle West shows potential upside from 89.07 USD toward the mid-90s. The consensus indicates cautious optimism for both utilities.
Analyst Opinions Comparison
This section compares analysts’ ratings and grades for Alliant Energy Corporation (LNT) and Pinnacle West Capital Corporation (PNW):
Rating Comparison
LNT Rating
- Rating: C+ with a “Very Favorable” status.
- Discounted Cash Flow Score: 3, indicating a moderate valuation outlook.
- ROE Score: 1, reflecting very unfavorable profitability from equity.
- ROA Score: 4, considered favorable for asset utilization efficiency.
- Debt To Equity Score: 1, indicating very unfavorable financial risk.
- Overall Score: 2, categorized as moderate financial standing.
PNW Rating
- Rating: C+ with a “Very Favorable” status.
- Discounted Cash Flow Score: 1, indicating a very unfavorable valuation.
- ROE Score: 3, showing a moderate ability to generate profit from equity.
- ROA Score: 3, reflecting moderate efficiency in asset utilization.
- Debt To Equity Score: 1, also showing very unfavorable financial risk.
- Overall Score: 2, also categorized as moderate financial standing.
Which one is the best rated?
Both Alliant Energy and Pinnacle West share the same overall rating of C+ and moderate overall scores. LNT scores better in discounted cash flow and return on assets, while PNW has stronger return on equity and price-to-book metrics. Both have equally unfavorable debt-to-equity scores.
Scores Comparison
Here is a comparison of the Altman Z-Score and Piotroski Score for the two companies:
Alliant Energy Corporation Scores
- Altman Z-Score: Unavailable for Alliant Energy.
- Piotroski Score: 5, reflecting average financial strength.
Pinnacle West Capital Corporation Scores
- Altman Z-Score: 0.73, indicating distress zone risk.
- Piotroski Score: 4, reflecting average financial strength.
Which company has the best scores?
Based on the provided data, Pinnacle West Capital has an Altman Z-Score indicating financial distress risk, while Alliant Energy’s Z-Score is unavailable. Both companies have similar average Piotroski scores, with Alliant slightly higher at 5 versus 4.
Grades Comparison
The following sections present the recent grades issued by recognized grading companies for both Alliant Energy Corporation and Pinnacle West Capital Corporation:
Alliant Energy Corporation Grades
This table summarizes recent grades from verified grading companies for Alliant Energy Corporation:
| Grading Company | Action | New Grade | Date |
|---|---|---|---|
| Argus Research | Downgrade | Hold | 2026-01-09 |
| UBS | Maintain | Buy | 2025-12-17 |
| UBS | Upgrade | Buy | 2025-10-24 |
| B of A Securities | Maintain | Buy | 2025-10-17 |
| BMO Capital | Maintain | Market Perform | 2025-10-17 |
| Barclays | Maintain | Underweight | 2025-10-14 |
| UBS | Maintain | Neutral | 2025-10-10 |
| B of A Securities | Maintain | Buy | 2025-08-14 |
| BMO Capital | Maintain | Market Perform | 2025-08-11 |
| UBS | Maintain | Neutral | 2025-07-11 |
Overall, grades for Alliant Energy show a mix of Buy and Hold ratings, with a slight recent downgrade from Argus Research and a consensus rating of Buy.
Pinnacle West Capital Corporation Grades
This table summarizes recent grades from verified grading companies for Pinnacle West Capital Corporation:
| Grading Company | Action | New Grade | Date |
|---|---|---|---|
| UBS | Maintain | Neutral | 2025-12-17 |
| Keybanc | Downgrade | Sector Weight | 2025-12-12 |
| Keybanc | Maintain | Overweight | 2025-10-15 |
| UBS | Maintain | Neutral | 2025-10-10 |
| Barclays | Maintain | Equal Weight | 2025-10-07 |
| Argus Research | Maintain | Buy | 2025-09-30 |
| Morgan Stanley | Maintain | Equal Weight | 2025-09-25 |
| UBS | Maintain | Neutral | 2025-09-12 |
| Mizuho | Downgrade | Neutral | 2025-09-09 |
| Barclays | Maintain | Equal Weight | 2025-08-13 |
Grades for Pinnacle West Capital Corporation predominantly reflect Neutral or Equal Weight ratings, with occasional downgrades and a consensus rating of Hold.
Which company has the best grades?
Alliant Energy Corporation has received generally stronger grades, including multiple Buy ratings and a consensus Buy, compared to Pinnacle West Capital Corporation’s mostly Neutral and Hold consensus. For investors, this suggests a relatively more favorable analyst sentiment toward Alliant Energy’s stock performance.
Strengths and Weaknesses
Below is a comparison of the key strengths and weaknesses of Alliant Energy Corporation (LNT) and Pinnacle West Capital Corporation (PNW) based on their latest financial and operational data.
| Criterion | Alliant Energy Corporation (LNT) | Pinnacle West Capital Corporation (PNW) |
|---|---|---|
| Diversification | Moderate diversification with Electric (3.37B), Gas (465M), and Other Utility segments | Focused on Electric Service (2.56B) with smaller transmission and wholesale energy segments |
| Profitability | Net margin 17.33% (favorable); ROIC 4.88% (unfavorable); ROE 9.85% (unfavorable) | Net margin 11.88% (favorable); ROIC 3.48% (unfavorable); ROE 9.01% (unfavorable) |
| Innovation | Stable, but no clear edge in innovation; ROIC trend neutral | Declining profitability, indicating challenges in competitive innovation |
| Global presence | Primarily US regional utility, limited global reach | Primarily US regional utility, limited global reach |
| Market Share | Leading presence in its regional markets, steady electric revenue growth | Strong position in Arizona with growth in electric service revenue |
Both companies operate primarily in regulated utility sectors with limited diversification beyond core electric services. Both show favorable net margins but struggle with returns on invested capital exceeding their cost of capital, indicating value destruction. Pinnacle West’s declining ROIC trend raises caution about its future profitability. Investors should weigh these factors carefully with attention to risk and capital efficiency.
Risk Analysis
Below is a comparative table of key risks for Alliant Energy Corporation (LNT) and Pinnacle West Capital Corporation (PNW) based on the most recent 2024 data:
| Metric | Alliant Energy Corporation (LNT) | Pinnacle West Capital Corporation (PNW) |
|---|---|---|
| Market Risk | Moderate (Beta 0.671) | Lower (Beta 0.543) |
| Debt Level | High (Debt-to-Equity 1.49; Neutral debt-to-assets 45.81%) | High (Debt-to-Equity 1.64; Neutral debt-to-assets 42.33%) |
| Regulatory Risk | Moderate (Utility sector, regulated) | Moderate (Utility sector, regulated) |
| Operational Risk | Moderate (Aging infrastructure, asset turnover low) | Moderate (Asset turnover slightly better) |
| Environmental Risk | Moderate (Natural gas and renewable mix; transition risks) | Moderate (Coal, nuclear, gas, solar mix) |
| Geopolitical Risk | Low (Primarily US-focused operations) | Low (Primarily US-focused operations) |
The most likely and impactful risks for both companies center on their high debt levels and regulatory environment uncertainties inherent to the utilities sector. PNW shows distress signals with an Altman Z-score in the distress zone, indicating financial strain and potential bankruptcy risk, whereas LNT’s financial health is slightly better but still challenged. Both face operational risks from low asset efficiency and must manage environmental transition pressures carefully.
Which Stock to Choose?
Alliant Energy Corporation (LNT) shows mixed income evolution with a 16.54% revenue growth over 2020-2024 but a slight 1.14% decline in 2024. The company’s profitability is moderate with a 17.33% net margin, yet financial ratios reveal 50% unfavorable metrics and a slightly unfavorable global status. Debt levels and liquidity ratios are weak, while the rating is very favorable overall but with some concerns on ROE and debt-to-equity.
Pinnacle West Capital Corporation (PNW) presents a more favorable income trend with 42.88% revenue growth over 2020-2024 and positive one-year gains. Profitability ratios are solid with an 11.88% net margin, though ROE and ROIC remain unfavorable. The company has a slightly unfavorable global ratios evaluation and a very favorable rating, despite a distress zone Altman Z-score and average Piotroski score, indicating financial caution.
For investors, Pinnacle West’s favorable income growth and stronger rating might appeal to growth-oriented profiles, while Alliant Energy’s mixed financial ratios and value destruction signal caution. Risk-averse investors may find both companies present challenges, though the differing income trends and ratings could influence preferences based on individual risk tolerance and investment strategy.
Disclaimer: Investment carries a risk of loss of initial capital. The past performance is not a reliable indicator of future results. Be sure to understand risks before making an investment decision.
Go Further
I encourage you to read the complete analyses of Alliant Energy Corporation and Pinnacle West Capital Corporation to enhance your investment decisions: