In the evolving landscape of regulated electric utilities, Pacific Gas & Electric Co. (PCG) and Alliant Energy Corporation (LNT) stand out as key players. Both companies serve distinct yet overlapping markets in the United States, focusing on electricity generation, distribution, and innovative energy solutions. Their strategies in integrating renewable sources and modernizing infrastructure make them compelling choices for investors. This article will help you decide which company offers the most attractive investment opportunity in 2026.

Table of contents
Companies Overview
I will begin the comparison between Pacific Gas & Electric Co. and Alliant Energy Corporation by providing an overview of these two companies and their main differences.
Pacific Gas & Electric Co. Overview
Pacific Gas & Electric Co. operates in the regulated electric industry, serving northern and central California. The company generates, transmits, distributes, and sells electricity and natural gas using nuclear, hydroelectric, fossil fuel, and photovoltaic sources. Founded in 1905 and headquartered in San Francisco, it serves residential, commercial, industrial, and agricultural customers. PG&E has a market capitalization of 34.8B USD and employs approximately 28,410 people.
Alliant Energy Corporation Overview
Alliant Energy Corporation is a utility holding company providing regulated electricity and natural gas services primarily in Iowa and Wisconsin. It operates through subsidiaries IPL and WPL, serving retail and wholesale customers with electricity, natural gas, and steam. The company also has interests in natural gas and wind power generation and offers freight services. Established in 1981 and based in Madison, Wisconsin, Alliant Energy has a market cap of 16.7B USD and about 3,000 employees.
Key similarities and differences
Both companies operate in the regulated electric utilities sector and provide electricity and natural gas services to residential, commercial, and industrial customers. PG&E has a larger scale of operations and workforce, focusing on California, while Alliant Energy serves Midwestern states with diversified operations including freight services and renewable energy assets. The market capitalization of PG&E is roughly double that of Alliant Energy, reflecting differences in size and regional presence.
Income Statement Comparison
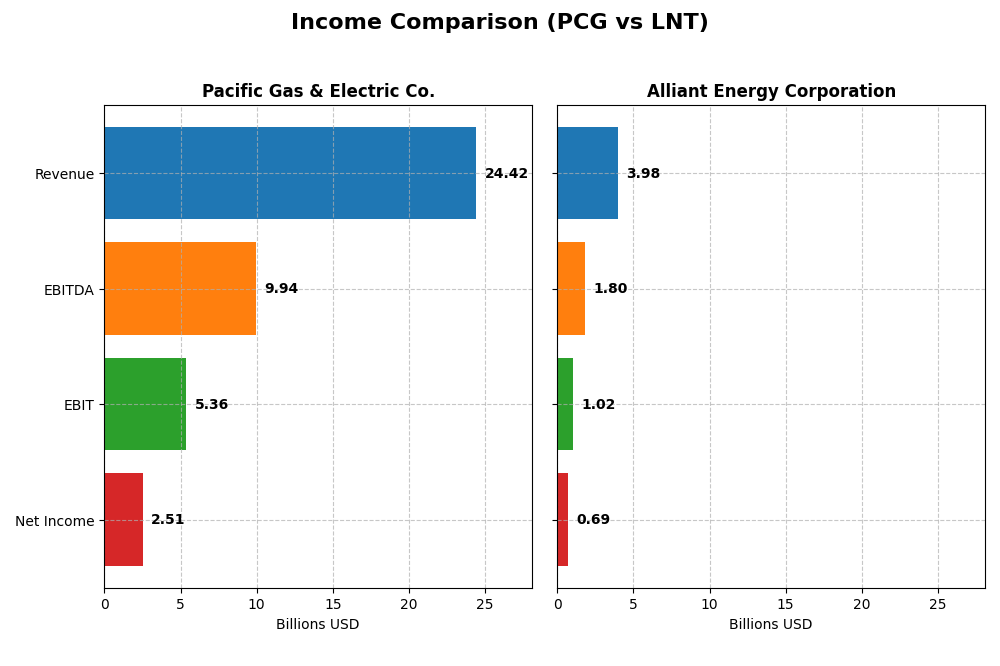
This table presents a side-by-side comparison of key income statement metrics for Pacific Gas & Electric Co. and Alliant Energy Corporation for the fiscal year 2024.
| Metric | Pacific Gas & Electric Co. (PCG) | Alliant Energy Corporation (LNT) |
|---|---|---|
| Market Cap | 34.8B | 16.7B |
| Revenue | 24.4B | 3.98B |
| EBITDA | 9.94B | 1.80B |
| EBIT | 5.36B | 1.03B |
| Net Income | 2.51B | 690M |
| EPS | 1.16 | 2.69 |
| Fiscal Year | 2024 | 2024 |
Income Statement Interpretations
Pacific Gas & Electric Co.
Pacific Gas & Electric Co. experienced a steady revenue increase of 32.22% over 2020-2024, with net income surging 292.64%. Gross and EBIT margins improved significantly, standing at 37.5% and 21.96% respectively in 2024. Despite a slight revenue decline of 0.04% in 2024, net margin growth of 11.39% and EPS growth of 9.52% indicate margin improvement and profitability gains.
Alliant Energy Corporation
Alliant Energy Corporation recorded a revenue growth of 16.54% from 2020 to 2024, with a modest net income increase of 10.58%. Its gross margin of 44.71% and EBIT margin of 25.75% are strong, yet the company faced a 1.14% revenue decline in 2024, accompanied by decreases in EBIT (-6.9%) and net margin (-0.72%). EPS declined by 3.24%, showing some recent performance pressures.
Which one has the stronger fundamentals?
Pacific Gas & Electric Co. demonstrates stronger fundamentals with favorable improvements in margins, significant net income growth, and positive EPS trends despite minor revenue contraction. Conversely, Alliant Energy shows weaker recent performance with several unfavorable margin and earnings growth metrics. Overall, Pacific Gas & Electric’s income statement indicators suggest a more robust operational and profitability profile.
Financial Ratios Comparison
The table below compares key financial ratios for Pacific Gas & Electric Co. (PCG) and Alliant Energy Corporation (LNT) based on the most recent fiscal year 2024 data.
| Ratios | Pacific Gas & Electric Co. (PCG) | Alliant Energy Corporation (LNT) |
|---|---|---|
| ROE | 8.33% | 9.85% |
| ROIC | 3.98% | 4.88% |
| P/E | 17.20 | 21.98 |
| P/B | 1.43 | 2.17 |
| Current Ratio | 1.05 | 0.44 |
| Quick Ratio | 1.00 | 0.33 |
| D/E (Debt-to-Equity) | 1.94 | 1.49 |
| Debt-to-Assets | 43.65% | 45.81% |
| Interest Coverage | 1.46 | 1.97 |
| Asset Turnover | 0.18 | 0.18 |
| Fixed Asset Turnover | 0.28 | 0.21 |
| Payout ratio | 3.42% | 71.30% |
| Dividend yield | 0.20% | 3.24% |
Interpretation of the Ratios
Pacific Gas & Electric Co.
Pacific Gas & Electric shows mixed financial ratios with strengths in net margin (10.29%) and WACC (4.68%), but weaknesses in ROE (8.33%), ROIC (3.98%), and interest coverage (1.76). The current and quick ratios suggest moderate liquidity. Dividend yield is low at 0.2%, indicating modest shareholder returns supported by dividends, though coverage by free cash flow appears weak, posing sustainability concerns.
Alliant Energy Corporation
Alliant Energy exhibits favorable net margin (17.33%) and WACC (5.91%), but faces challenges with liquidity ratios (current ratio 0.44 and quick ratio 0.33) and debt-to-equity at 1.49. ROE (9.85%) and ROIC (4.88%) remain below ideal levels. The dividend yield is notably higher at 3.24%, indicating stronger shareholder distributions, though some financial ratios suggest cautious monitoring is advisable.
Which one has the best ratios?
Both companies present slight unfavorable global ratio profiles with half of their key ratios rated weak. Pacific Gas & Electric performs better in liquidity and valuation metrics, while Alliant Energy benefits from higher profitability and dividend yield. However, liquidity concerns for Alliant and profitability challenges for Pacific Gas & Electric balance their overall financial health assessments.
Strategic Positioning
This section compares the strategic positioning of Pacific Gas & Electric Co. (PCG) and Alliant Energy Corporation (LNT) in terms of market position, key segments, and exposure to technological disruption:
Pacific Gas & Electric Co.
- Large market cap of 34.8B in US regulated electric utilities with low beta, facing typical regulated sector competition.
- Key revenue from electricity (18.6B) and natural gas (6.6B), serving residential, commercial, industrial, and agricultural clients.
- Developing SmartMeter-integrated microgrid backup power devices, indicating some technological innovation exposure.
Alliant Energy Corporation
- Smaller market cap of 16.7B, operates mainly in regulated electric and gas utilities with moderate beta.
- Revenue diversified among electric (3.4B), gas (465M), and other utility services, serving retail and wholesale customers.
- Owns generation assets including gas and wind farms, with additional logistics operations, moderate tech disruption exposure.
PCG vs LNT Positioning
PCG shows a more concentrated focus on electricity and natural gas in northern and central California, leveraging a large customer base and smart grid technology. LNT has a more diversified utility portfolio across multiple states and includes freight logistics, offering broader business drivers but smaller scale.
Which has the best competitive advantage?
Both companies are currently shedding value with ROIC below WACC; however, PCG shows improving profitability trends, while LNT’s profitability remains stable but unfavorable, suggesting PCG may have a slightly stronger moat.
Stock Comparison
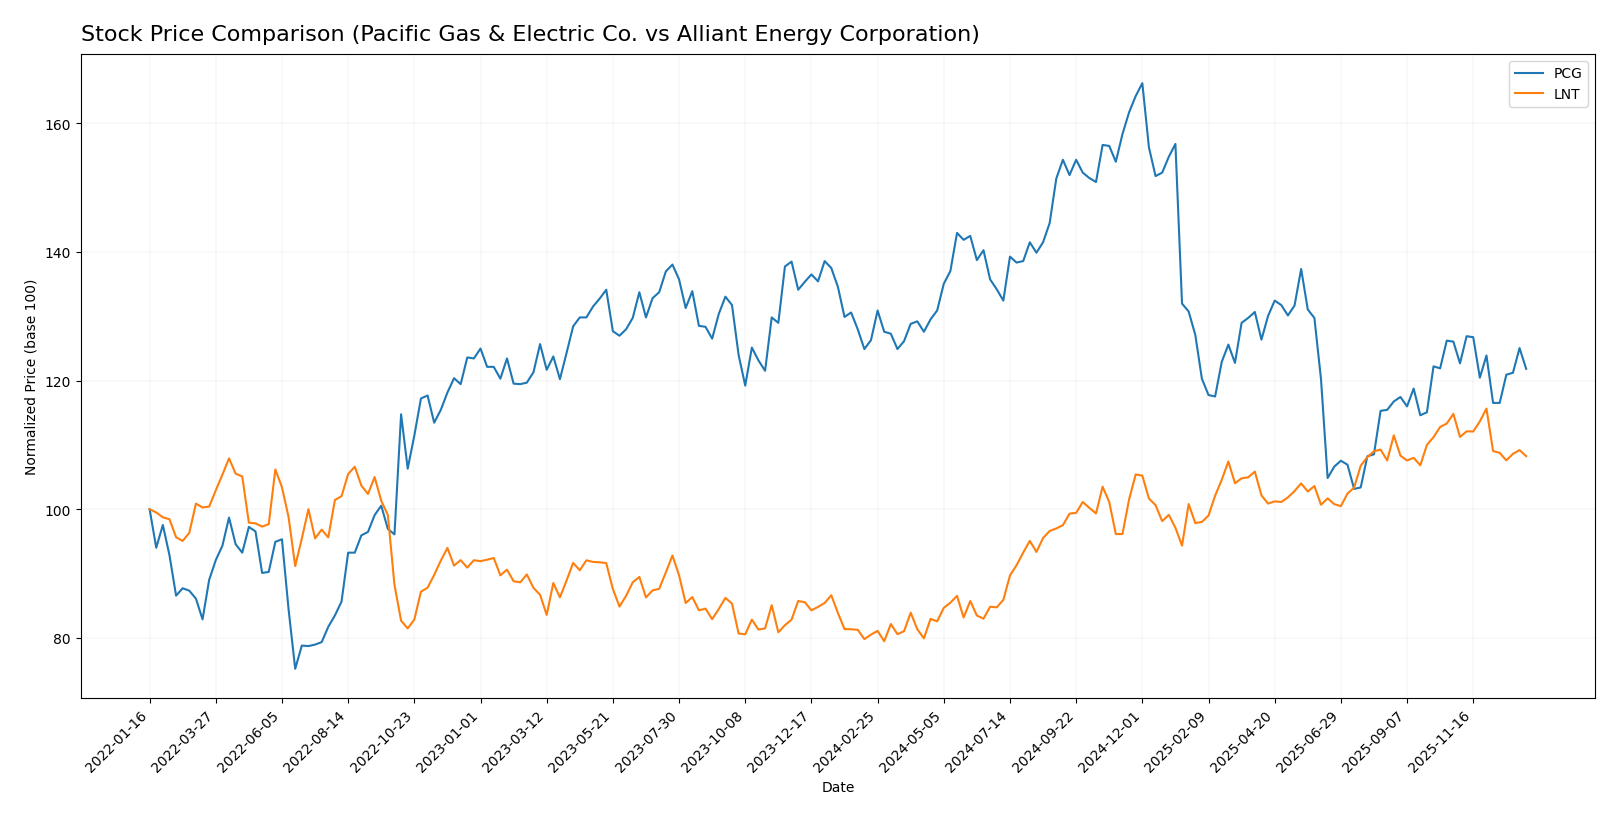
The stock price movements of Pacific Gas & Electric Co. (PCG) and Alliant Energy Corporation (LNT) over the past 12 months reveal contrasting trends, with PCG experiencing a modest decline and LNT showing significant gains before recent downward pressure.
Trend Analysis
Pacific Gas & Electric Co. (PCG) recorded a -3.53% price change over the past year, indicating a bearish trend with deceleration. The stock ranged from a high of 21.63 to a low of 13.42, with moderate volatility (std deviation 1.93).
Alliant Energy Corporation (LNT) posted a 34.48% gain over the same period, reflecting a bullish trend but with deceleration. Price fluctuated between 47.73 and 69.47, and volatility was higher (std deviation 5.9).
Comparing both, LNT delivered the highest market performance, outperforming PCG significantly despite recent short-term declines for both stocks.
Target Prices
Analysts present a generally optimistic target consensus for these utility companies.
| Company | Target High | Target Low | Consensus |
|---|---|---|---|
| Pacific Gas & Electric Co. | 25 | 18 | 21.5 |
| Alliant Energy Corporation | 78 | 65 | 73 |
The consensus targets for Pacific Gas & Electric Co. and Alliant Energy Corporation exceed their current stock prices of 15.85 and 65.02 respectively, indicating analyst expectations of moderate to strong upside potential.
Analyst Opinions Comparison
This section compares analysts’ ratings and grades for Pacific Gas & Electric Co. (PCG) and Alliant Energy Corporation (LNT):
Rating Comparison
PCG Rating
- Rating: B-, evaluated as Very Favorable overall.
- Discounted Cash Flow Score: 1, marked Very Unfavorable for future cash flows.
- ROE Score: 3, indicating moderate efficiency in generating profit from equity.
- ROA Score: 3, moderate effectiveness in asset utilization.
- Debt To Equity Score: 1, Very Unfavorable, indicating higher financial risk.
- Overall Score: 3, a moderate summary of financial standing.
LNT Rating
- Rating: C+, also evaluated as Very Favorable overall.
- Discounted Cash Flow Score: 3, considered Moderate for cash flow projections.
- ROE Score: 1, rated Very Unfavorable for profit generation from equity.
- ROA Score: 4, favorable in utilizing assets to generate earnings.
- Debt To Equity Score: 1, also Very Unfavorable, reflecting similar risk.
- Overall Score: 2, a moderate but lower financial standing than PCG.
Which one is the best rated?
Based strictly on the provided data, PCG holds a better overall rating (B-) and a higher overall score (3) compared to LNT’s C+ rating and overall score (2). PCG shows stronger equity returns, while LNT excels in asset utilization but scores poorly on ROE and debt metrics.
Scores Comparison
Here is a comparison of the Altman Z-Score and Piotroski Score for Pacific Gas & Electric Co. and Alliant Energy Corporation:
PCG Scores
- Altman Z-Score: 0.48, in distress zone indicating high bankruptcy risk.
- Piotroski Score: 5, considered average financial strength.
LNT Scores
- Altman Z-Score: Unavailable for evaluation.
- Piotroski Score: 5, considered average financial strength.
Which company has the best scores?
Based on the provided data, PCG has a distress-level Altman Z-Score while LNT’s Altman Z-Score is unavailable. Both companies have an identical average Piotroski Score of 5, showing similar financial strength by that measure.
Grades Comparison
Here is a comparison of the recent grades assigned to Pacific Gas & Electric Co. and Alliant Energy Corporation by reputable grading companies:
Pacific Gas & Electric Co. Grades
The table below shows the latest grades from major financial institutions for Pacific Gas & Electric Co.:
| Grading Company | Action | New Grade | Date |
|---|---|---|---|
| JP Morgan | Maintain | Overweight | 2025-12-12 |
| UBS | Maintain | Neutral | 2025-10-24 |
| Jefferies | Maintain | Buy | 2025-10-22 |
| BMO Capital | Maintain | Outperform | 2025-10-14 |
| Jefferies | Maintain | Buy | 2025-10-03 |
| Barclays | Maintain | Overweight | 2025-10-01 |
| Morgan Stanley | Maintain | Equal Weight | 2025-09-25 |
| Morgan Stanley | Upgrade | Equal Weight | 2025-09-18 |
| UBS | Maintain | Neutral | 2025-09-18 |
| Barclays | Maintain | Overweight | 2025-07-22 |
Overall, the grades for Pacific Gas & Electric Co. show a consistent buy/overweight trend with some neutral and equal weight ratings, indicating moderate confidence from analysts.
Alliant Energy Corporation Grades
Below are the recent grades from established grading companies for Alliant Energy Corporation:
| Grading Company | Action | New Grade | Date |
|---|---|---|---|
| Argus Research | Downgrade | Hold | 2026-01-09 |
| UBS | Maintain | Buy | 2025-12-17 |
| UBS | Upgrade | Buy | 2025-10-24 |
| B of A Securities | Maintain | Buy | 2025-10-17 |
| BMO Capital | Maintain | Market Perform | 2025-10-17 |
| Barclays | Maintain | Underweight | 2025-10-14 |
| UBS | Maintain | Neutral | 2025-10-10 |
| B of A Securities | Maintain | Buy | 2025-08-14 |
| BMO Capital | Maintain | Market Perform | 2025-08-11 |
| UBS | Maintain | Neutral | 2025-07-11 |
The grades for Alliant Energy Corporation present a mixed picture, with buy ratings balanced by hold, market perform, underweight, and neutral grades, reflecting varied analyst opinions.
Which company has the best grades?
Pacific Gas & Electric Co. generally holds stronger and more consistent buy and overweight ratings compared to Alliant Energy Corporation’s mixed grades. This suggests that Pacific Gas & Electric Co. may be viewed by analysts as having a more favorable outlook, which could influence investor confidence and portfolio decisions.
Strengths and Weaknesses
Below is a comparison of key strengths and weaknesses of Pacific Gas & Electric Co. (PCG) and Alliant Energy Corporation (LNT) based on their recent financial and operational data.
| Criterion | Pacific Gas & Electric Co. (PCG) | Alliant Energy Corporation (LNT) |
|---|---|---|
| Diversification | Strong with electricity (18.6B) and natural gas (6.6B) segments | Moderate with electric (3.4B), gas (465M), and other utilities segments |
| Profitability | Net margin favorable at 10.29%; ROIC 3.98% below WACC (4.68%) | Net margin favorable at 17.33%; ROIC 4.88% below WACC (5.91%) |
| Innovation | Moderate innovation with growing ROIC trend but shedding value overall | Limited innovation; stable ROIC trend but value destruction persists |
| Global presence | Primarily US-regulated utilities; limited global exposure | Primarily regional US utility with limited diversification |
| Market Share | Large market share in California electricity and gas markets | Smaller regional presence with steady utility customer base |
Key takeaways: PCG benefits from strong diversification between electricity and natural gas but faces challenges in value creation despite improving profitability. LNT shows higher net margins but struggles with profitability relative to capital costs and exhibits weaker liquidity and asset turnover. Both companies have slightly unfavorable financial positions, requiring cautious investment consideration.
Risk Analysis
Below is a comparative table highlighting key risks for Pacific Gas & Electric Co. (PCG) and Alliant Energy Corporation (LNT) based on the most recent data from 2024:
| Metric | Pacific Gas & Electric Co. (PCG) | Alliant Energy Corporation (LNT) |
|---|---|---|
| Market Risk | Low beta (0.38) suggests lower volatility | Moderate beta (0.67) indicates moderate volatility |
| Debt level | High debt-to-equity ratio (1.94, unfavorable) | Elevated debt-to-equity (1.49, unfavorable) but lower than PCG |
| Regulatory Risk | High, due to California wildfire liabilities and stringent state regulations | Moderate regulatory constraints in Midwest markets |
| Operational Risk | Asset turnover very low (0.18), signaling inefficiencies | Also low asset turnover (0.18), operational challenges persist |
| Environmental Risk | Significant, given fossil fuel and nuclear operations in California | Moderate, with renewable investments but still reliant on fossil fuels |
| Geopolitical Risk | Low, primarily domestic operations | Low, focused on U.S. Midwest markets |
The most impactful and likely risks are PCG’s high regulatory and environmental risks linked to California’s wildfire liabilities and energy transition pressures, alongside high leverage that strains financial flexibility. LNT faces moderate regulatory and operational risks with better dividend yield but also carries elevated debt. Both utilities show financial distress signals, notably PCG’s Altman Z-score in the distress zone, warranting cautious risk management.
Which Stock to Choose?
Pacific Gas & Electric Co. (PCG) shows favorable income growth with a 292.64% net income increase over 2020-2024 and strong gross and EBIT margins. However, financial ratios reveal a slightly unfavorable profile with moderate profitability and debt concerns, reflected in a B- rating and a slightly unfavorable MOAT due to value destruction despite growing ROIC.
Alliant Energy Corporation (LNT) displays solid profitability with a 16.54% revenue growth over the period and strong margins but recent income declines. Its financial ratios are also slightly unfavorable, marked by lower liquidity and moderate leverage, yet it holds a C+ rating and an unfavorable MOAT, indicating value destruction but stable profitability.
For investors prioritizing growth potential and improving profitability, PCG might appear more attractive due to its favorable income statement and improving ROIC trend. Conversely, LNT could be seen as potentially suitable for those valuing stable profitability despite less favorable income growth and liquidity ratios.
Disclaimer: Investment carries a risk of loss of initial capital. The past performance is not a reliable indicator of future results. Be sure to understand risks before making an investment decision.
Go Further
I encourage you to read the complete analyses of Pacific Gas & Electric Co. and Alliant Energy Corporation to enhance your investment decisions: