In the evolving landscape of regulated electric utilities, Alliant Energy Corporation and Oklo Inc. stand out for their contrasting approaches to energy production and innovation. Alliant Energy, a well-established utility provider, focuses on traditional electricity and natural gas services across the Midwest. In contrast, Oklo pioneers advanced fission power technology, aiming to revolutionize clean energy. This article will analyze both companies to help you identify the most promising investment opportunity.
Table of contents
Companies Overview
I will begin the comparison between Alliant Energy Corporation and Oklo Inc. by providing an overview of these two companies and their main differences.
Alliant Energy Corporation Overview
Alliant Energy Corporation operates as a utility holding company providing regulated electricity and natural gas services primarily in the Midwest. It serves approximately 1M retail customers through subsidiaries in Iowa and Wisconsin, offering electric, gas, and freight services. The company focuses on traditional utility operations, including power generation and distribution, with a presence in renewables and natural gas-fired electricity.
Oklo Inc. Overview
Oklo Inc. is a developer of fission power plants aimed at delivering reliable, commercial-scale energy within the United States. Founded in 2013 and headquartered in California, Oklo also offers used nuclear fuel recycling services. The company operates with a lean workforce and focuses on innovative nuclear energy solutions rather than traditional utility operations.
Key similarities and differences
Both companies operate in the regulated electric utilities sector and are based in the US, serving energy needs through different technologies. Alliant Energy is a larger, established utility holding company with diverse energy and freight operations, while Oklo is a smaller, technology-driven firm specializing in advanced nuclear power solutions. Their business models differ significantly in scale, technology focus, and customer base approach.
Income Statement Comparison
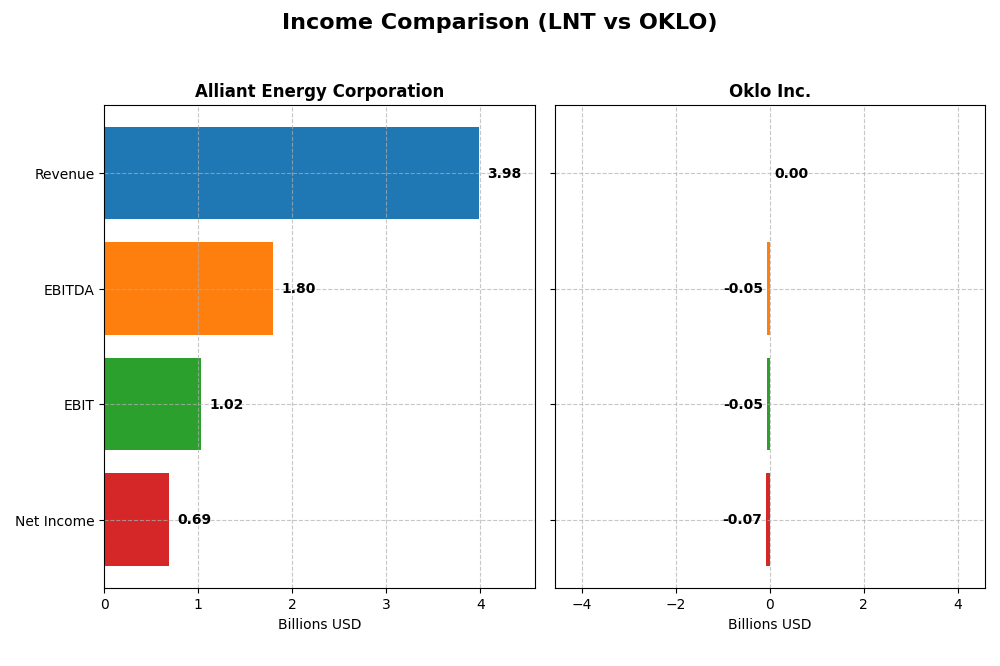
This table compares the most recent full fiscal year income statement metrics for Alliant Energy Corporation and Oklo Inc., providing a snapshot of their financial performance in 2024.
| Metric | Alliant Energy Corporation (LNT) | Oklo Inc. (OKLO) |
|---|---|---|
| Market Cap | 16.7B | 16.5B |
| Revenue | 3.98B | 0 |
| EBITDA | 1.80B | -52.5M |
| EBIT | 1.03B | -52.8M |
| Net Income | 690M | -73.6M |
| EPS | 2.69 | -0.7443 |
| Fiscal Year | 2024 | 2024 |
Income Statement Interpretations
Alliant Energy Corporation
Alliant Energy’s revenue showed a modest decline of 1.14% in 2024, though it achieved a 16.54% growth over five years. Net income grew 10.58% overall despite a slight dip last year. The company maintains favorable gross (44.7%) and EBIT margins (25.8%), but rising interest expenses (11.3%) weigh on profitability. In 2024, net margin slightly contracted, reflecting margin pressures.
Oklo Inc.
Oklo reported zero revenue across the period, reflecting its development stage, with consistent net losses expanding significantly in 2024. Operating expenses and research costs increased, driving an EBIT loss over $52M in 2024. Margins remain at zero, and no revenue growth occurred. EPS and net income trends reveal a steep negative trajectory without clear improvement last year.
Which one has the stronger fundamentals?
Alliant Energy shows stronger fundamentals with positive revenue and net income growth over the period, stable gross and EBIT margins, and a sizable market cap. Conversely, Oklo’s lack of revenue, persistent losses, and widening negative margins indicate weaker fundamentals. Both companies have unfavorable overall income statement opinions, but Alliant’s scale and profitability trends are comparatively more favorable.
Financial Ratios Comparison
The table below presents the key financial ratios for Alliant Energy Corporation (LNT) and Oklo Inc. (OKLO) based on their most recent fiscal year data for 2024.
| Ratios | Alliant Energy Corporation (LNT) | Oklo Inc. (OKLO) |
|---|---|---|
| ROE | 9.85% | -29.35% |
| ROIC | 4.88% | -19.23% |
| P/E | 21.98 | -28.52 |
| P/B | 2.17 | 8.37 |
| Current Ratio | 0.44 | 43.47 |
| Quick Ratio | 0.33 | 43.47 |
| D/E | 1.49 | 0.01 |
| Debt-to-Assets | 45.81% | 0.46% |
| Interest Coverage | 1.97 | 0 |
| Asset Turnover | 0.18 | 0 |
| Fixed Asset Turnover | 0.21 | 0 |
| Payout ratio | 71.30% | 0% |
| Dividend yield | 3.24% | 0% |
Interpretation of the Ratios
Alliant Energy Corporation
Alliant Energy’s ratios reveal a mix of strengths and weaknesses. The net margin and dividend yield are favorable, indicating profitability and shareholder returns. However, weak current and quick ratios, high debt-to-equity, and low asset turnover raise concerns about liquidity and operational efficiency. The company pays dividends with a 3.24% yield, supported by a stable payout ratio but caution is needed due to cash flow constraints.
Oklo Inc.
Oklo shows predominantly unfavorable ratios, with negative returns on equity and invested capital, and a zero net margin reflecting operational losses. Its liquidity ratios are extreme; a very high current ratio contrasts with operational inefficiency. Oklo does not pay dividends, likely due to negative earnings and a reinvestment focus in its growth phase, prioritizing R&D over shareholder payouts.
Which one has the best ratios?
Comparatively, Alliant Energy exhibits more favorable financial metrics, especially in profitability and dividend returns, despite liquidity and efficiency challenges. Oklo’s ratios are largely unfavorable, reflecting its early-stage status and operational losses. Thus, Alliant Energy holds the stronger ratio profile between the two based on the current data.
Strategic Positioning
This section compares the strategic positioning of Alliant Energy Corporation and Oklo Inc., focusing on market position, key segments, and exposure to technological disruption:
Alliant Energy Corporation
- Established regulated electric utility with moderate competitive pressure in Midwestern US markets.
- Diversified revenues from electric, gas, and other utility operations serving retail and wholesale customers.
- Limited exposure to technological disruption due to regulated utility status and existing infrastructure.
Oklo Inc.
- Emerging player in fission power plant design, facing high competition in advanced nuclear tech sector.
- Focused on commercial-scale fission power plants and nuclear fuel recycling services.
- High exposure to technological disruption through innovative nuclear energy solutions and recycling.
Alliant Energy Corporation vs Oklo Inc. Positioning
Alliant Energy pursues a diversified utility business model with regulated electric and gas segments, providing stable revenues but limited innovation disruption. Oklo focuses on disruptive nuclear technology, offering growth potential but with higher risk and narrower business scope.
Which has the best competitive advantage?
Both companies are currently value destroyers with ROIC below WACC. Alliant Energy shows stable but unfavorable profitability, while Oklo’s profitability is declining sharply, indicating a weaker competitive advantage for Oklo.
Stock Comparison
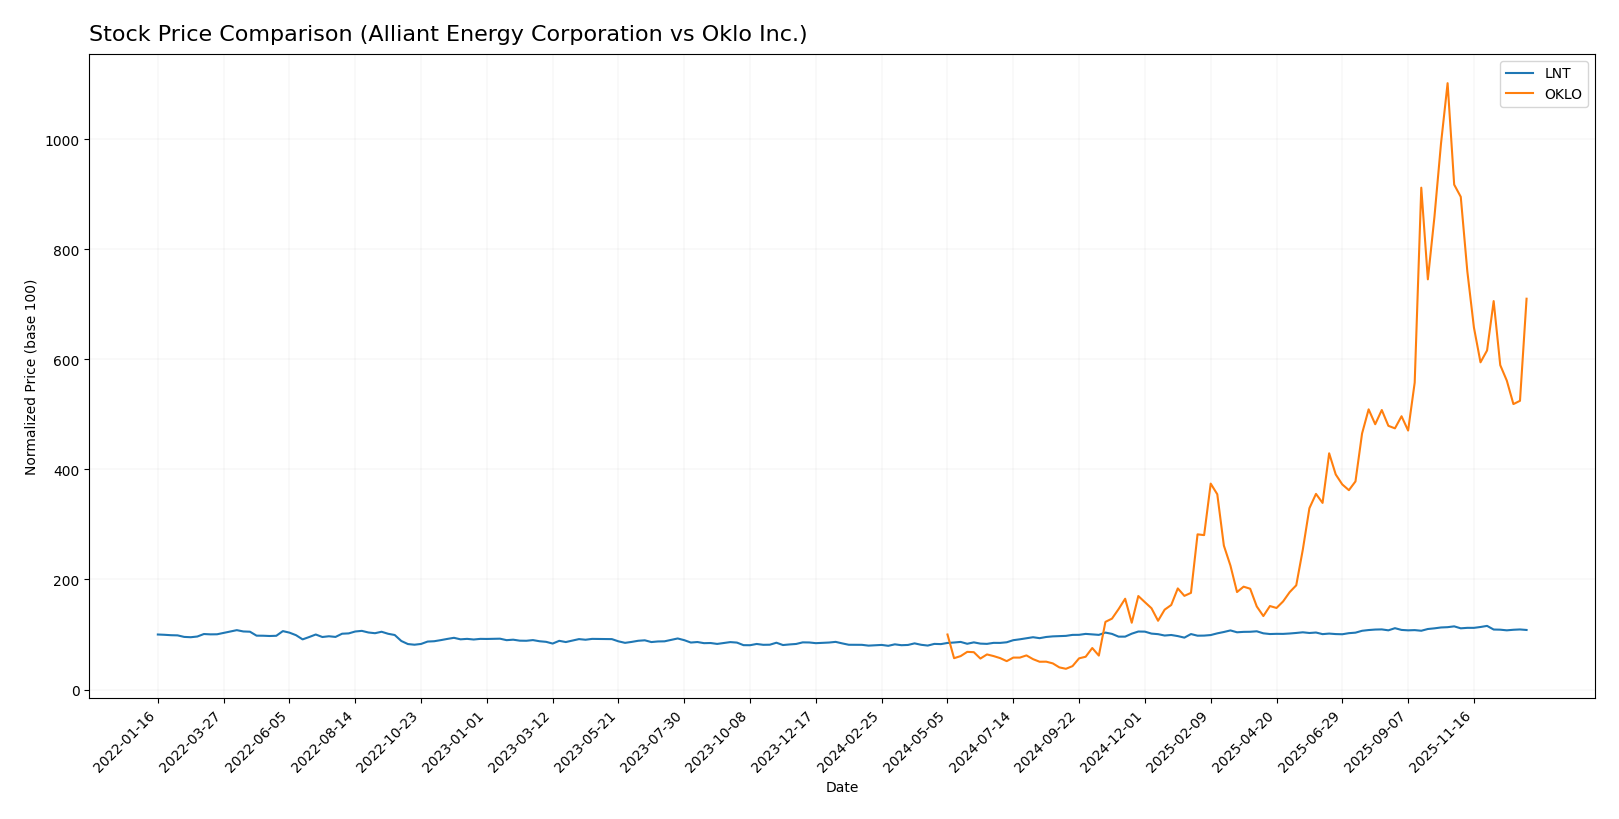
The stock price performances of Alliant Energy Corporation (LNT) and Oklo Inc. (OKLO) over the past 12 months reveal significant bullish trends with notable deceleration, while recent months show a shift toward bearish momentum and increased seller dominance.
Trend Analysis
Alliant Energy Corporation (LNT) exhibited a bullish trend over the past year with a 34.48% price increase and decelerating momentum. Recent weeks show a slight bearish reversal with a -5.73% decline and reduced volatility.
Oklo Inc. (OKLO) demonstrated a strong bullish trend with a 610.11% rise over the last year, though with high volatility and deceleration. The recent period experienced a sharper bearish drop of -22.59%, accompanied by increased volatility.
Comparing both, Oklo Inc. has delivered the highest market performance over the past year, despite sharper recent declines, while Alliant Energy showed steadier gains with more moderate recent losses.
Target Prices
Here is the consensus target price outlook for Alliant Energy Corporation and Oklo Inc.
| Company | Target High | Target Low | Consensus |
|---|---|---|---|
| Alliant Energy Corporation | 78 | 65 | 73 |
| Oklo Inc. | 150 | 95 | 125.67 |
Analysts expect Alliant Energy’s price to rise modestly above its current $65.02, while Oklo’s consensus target of $125.67 suggests a significant upside from its $105.31 market price.
Analyst Opinions Comparison
This section compares analysts’ ratings and grades for Alliant Energy Corporation and Oklo Inc.:
Rating Comparison
Alliant Energy Corporation Rating
- Rating: C+, classified as Very Favorable overall
- Discounted Cash Flow Score: 3, indicating moderate valuation
- ROE Score: 1, considered very unfavorable for efficient profit generation
- ROA Score: 4, favorable for effective asset utilization
- Debt To Equity Score: 1, very unfavorable indicating higher financial risk
- Overall Score: 2, moderate overall financial standing
Oklo Inc. Rating
- Rating: C+, classified as Very Favorable overall
- Discounted Cash Flow Score: 3, also indicating moderate valuation
- ROE Score: 1, similarly very unfavorable
- ROA Score: 1, very unfavorable for asset utilization
- Debt To Equity Score: 5, very favorable indicating low financial risk
- Overall Score: 2, moderate overall financial standing
Which one is the best rated?
Both companies share the same overall rating of C+ and an overall score of 2, reflecting moderate financial standing. However, Alliant Energy exhibits stronger asset utilization, while Oklo benefits from a significantly better debt-to-equity position.
Scores Comparison
Here is the comparison of the companies’ financial scores based on the Altman Z-Score and Piotroski Score:
Alliant Energy Corporation Scores
- Altman Z-Score: Unavailable, no data provided.
- Piotroski Score: 5, classified as average strength.
Oklo Inc. Scores
- Altman Z-Score: 339.43, indicating a safe zone.
- Piotroski Score: 2, classified as very weak.
Which company has the best scores?
Oklo Inc. shows a strong Altman Z-Score placing it in the safe zone, while Alliant Energy lacks this data. Conversely, Alliant Energy’s Piotroski Score is average, outperforming Oklo’s very weak score.
Grades Comparison
Here is a comparison of the latest grades assigned to Alliant Energy Corporation and Oklo Inc. by recognized grading companies:
Alliant Energy Corporation Grades
The table below summarizes recent grades from notable financial institutions for Alliant Energy Corporation:
| Grading Company | Action | New Grade | Date |
|---|---|---|---|
| Argus Research | Downgrade | Hold | 2026-01-09 |
| UBS | Maintain | Buy | 2025-12-17 |
| UBS | Upgrade | Buy | 2025-10-24 |
| B of A Securities | Maintain | Buy | 2025-10-17 |
| BMO Capital | Maintain | Market Perform | 2025-10-17 |
| Barclays | Maintain | Underweight | 2025-10-14 |
| UBS | Maintain | Neutral | 2025-10-10 |
| B of A Securities | Maintain | Buy | 2025-08-14 |
| BMO Capital | Maintain | Market Perform | 2025-08-11 |
| UBS | Maintain | Neutral | 2025-07-11 |
Overall, the grades for Alliant Energy Corporation show a mixed trend with a strong presence of Buy and Hold ratings and some Market Perform and Underweight opinions.
Oklo Inc. Grades
The table below shows the latest grades from established financial firms for Oklo Inc.:
| Grading Company | Action | New Grade | Date |
|---|---|---|---|
| Seaport Global | Upgrade | Buy | 2025-12-08 |
| UBS | Maintain | Neutral | 2025-12-03 |
| B of A Securities | Maintain | Neutral | 2025-11-12 |
| B. Riley Securities | Maintain | Buy | 2025-11-12 |
| Wedbush | Maintain | Outperform | 2025-11-12 |
| B of A Securities | Downgrade | Neutral | 2025-09-30 |
| Seaport Global | Downgrade | Neutral | 2025-09-23 |
| Wedbush | Maintain | Outperform | 2025-09-22 |
| Wedbush | Maintain | Outperform | 2025-08-14 |
| Wedbush | Maintain | Outperform | 2025-08-12 |
Oklo Inc. grades indicate a generally positive outlook with multiple Outperform and Buy ratings, tempered by some Neutral positions.
Which company has the best grades?
Both companies carry a consensus Buy rating, but Oklo Inc. has a higher frequency of Outperform and Buy grades from respected firms, suggesting stronger analyst confidence. This could influence investors seeking growth potential, while Alliant Energy presents a more mixed risk profile with varied hold and market perform ratings.
Strengths and Weaknesses
Below is a comparison of the key strengths and weaknesses of Alliant Energy Corporation (LNT) and Oklo Inc. (OKLO) based on the most recent financial and operational data.
| Criterion | Alliant Energy Corporation (LNT) | Oklo Inc. (OKLO) |
|---|---|---|
| Diversification | Moderate: Primarily electric and gas utilities with stable revenue segments | Low: Focused on niche nuclear technology, limited revenue diversification |
| Profitability | Moderate: Net margin 17.33% favorable; ROIC 4.88% but below WACC, value-destroying | Very Low: Negative margins and ROIC, company is shedding value |
| Innovation | Moderate: Stable operations but limited breakthrough innovation | High potential but currently unprofitable and declining ROIC |
| Global presence | Regional US utility provider with limited global footprint | Very limited, primarily in early-stage development |
| Market Share | Established in US utility sector with steady customer base | Emerging player, minimal market penetration |
Key takeaways: Alliant Energy shows stable revenue with moderate profitability despite some financial weaknesses, offering relative stability. Oklo is an innovative but high-risk investment with significant value destruction and declining profitability, reflecting early-stage challenges. Caution and risk management are essential.
Risk Analysis
Below is a comparison of key risks for Alliant Energy Corporation (LNT) and Oklo Inc. (OKLO) based on the most recent data available for 2024.
| Metric | Alliant Energy Corporation (LNT) | Oklo Inc. (OKLO) |
|---|---|---|
| Market Risk | Moderate, beta 0.671 | Moderate, beta 0.773 |
| Debt level | High, debt-to-equity 1.49 (unfavorable) | Very low, debt-to-equity 0.01 (favorable) |
| Regulatory Risk | Elevated, heavily regulated utility sector | High, nuclear regulatory complexity |
| Operational Risk | Moderate, diversified assets but some inefficiencies | High, early-stage nuclear tech development |
| Environmental Risk | Moderate, exposure to fossil fuels and renewables transition | Elevated, nuclear waste and fuel recycling concerns |
| Geopolitical Risk | Low, US domestic operations primarily | Low, US domestic operations |
The most impactful risks are regulatory and operational for both companies. Alliant Energy faces challenges from high debt and regulatory compliance in its regulated electric and gas utilities, while Oklo carries significant operational and environmental risks due to its advanced nuclear technology and fuel recycling activities. Oklo’s financials show weakness with negative returns and a very weak Piotroski score, signaling higher risk despite low leverage. Investors should weigh regulatory hurdles and financial health carefully in their risk management.
Which Stock to Choose?
Alliant Energy Corporation (LNT) shows a stable income evolution with overall revenue growth of 16.54% over 2020-2024, despite a slight recent decline. Its financial ratios reveal a slightly unfavorable global status, marked by solid net margin (17.33%) but weaker returns on equity (9.85%) and invested capital (4.88%). Debt levels are moderate with some unfavorable liquidity ratios. The company’s rating stands at C+ with a very favorable overall assessment.
Oklo Inc. (OKLO) displays unfavorable income statement metrics with zero revenue growth and negative profitability trends over 2021-2024. Financial ratios are predominantly unfavorable, including negative returns on equity (-29.35%) and invested capital (-19.23%), though it benefits from low debt and a favorable weighted average cost of capital. Its rating also is C+ with a very favorable classification despite operational challenges.
Considering the ratings and comprehensive financial evaluations, Alliant Energy might appear more stable with a slightly unfavorable but consistent income and ratio profile, while Oklo presents higher risk with declining profitability and value destruction. Investors with a risk-averse or quality-focused approach might find Alliant Energy more aligned with their profile, whereas those with a higher risk tolerance or seeking speculative growth could interpret Oklo’s profile as potentially interesting due to its low debt and recent bullish price trends.
Disclaimer: Investment carries a risk of loss of initial capital. The past performance is not a reliable indicator of future results. Be sure to understand risks before making an investment decision.
Go Further
I encourage you to read the complete analyses of Alliant Energy Corporation and Oklo Inc. to enhance your investment decisions: