Home > Comparison > Utilities > NEE vs LNT
The strategic rivalry between NextEra Energy, Inc. and Alliant Energy Corporation shapes the utilities sector’s evolution. NextEra operates as a capital-intensive, diversified power generator with a strong focus on renewable energy. In contrast, Alliant Energy runs a more regionally focused, regulated electric and gas utility model. This analysis will assess which company’s business model offers a superior risk-adjusted return, guiding investors seeking stable exposure within the regulated electric industry.
Table of contents
Companies Overview
NextEra Energy and Alliant Energy anchor significant portions of the U.S. regulated electric utility market.
NextEra Energy, Inc.: Clean Energy Powerhouse
NextEra Energy stands as a market leader in regulated electric utilities. It generates revenue primarily by producing and selling electricity through diverse sources including wind, solar, nuclear, and natural gas. In 2021, it emphasized expanding long-term contracted clean energy assets like renewable generation and battery storage, reinforcing its competitive edge in sustainability.
Alliant Energy Corporation: Regional Utility Specialist
Alliant Energy operates as a regional utility holding company, providing regulated electricity and natural gas services mainly in the Midwest. Its revenue stems from retail electric and gas distribution and wholesale electricity sales. The company focuses on serving industrial and agricultural customers while managing diversified energy assets, including natural gas-fired plants and wind farms.
Strategic Collision: Similarities & Divergences
Both companies operate within regulated electric markets but differ in scale and scope. NextEra pursues a broad clean energy strategy along coastal markets, while Alliant focuses on Midwest utility services with a balance of electric and gas operations. Their primary battleground lies in expanding renewable assets versus regional utility dominance. These distinctions yield contrasting investment profiles: NextEra as a growth-oriented clean energy titan, Alliant as a stable regional utility provider.
Income Statement Comparison
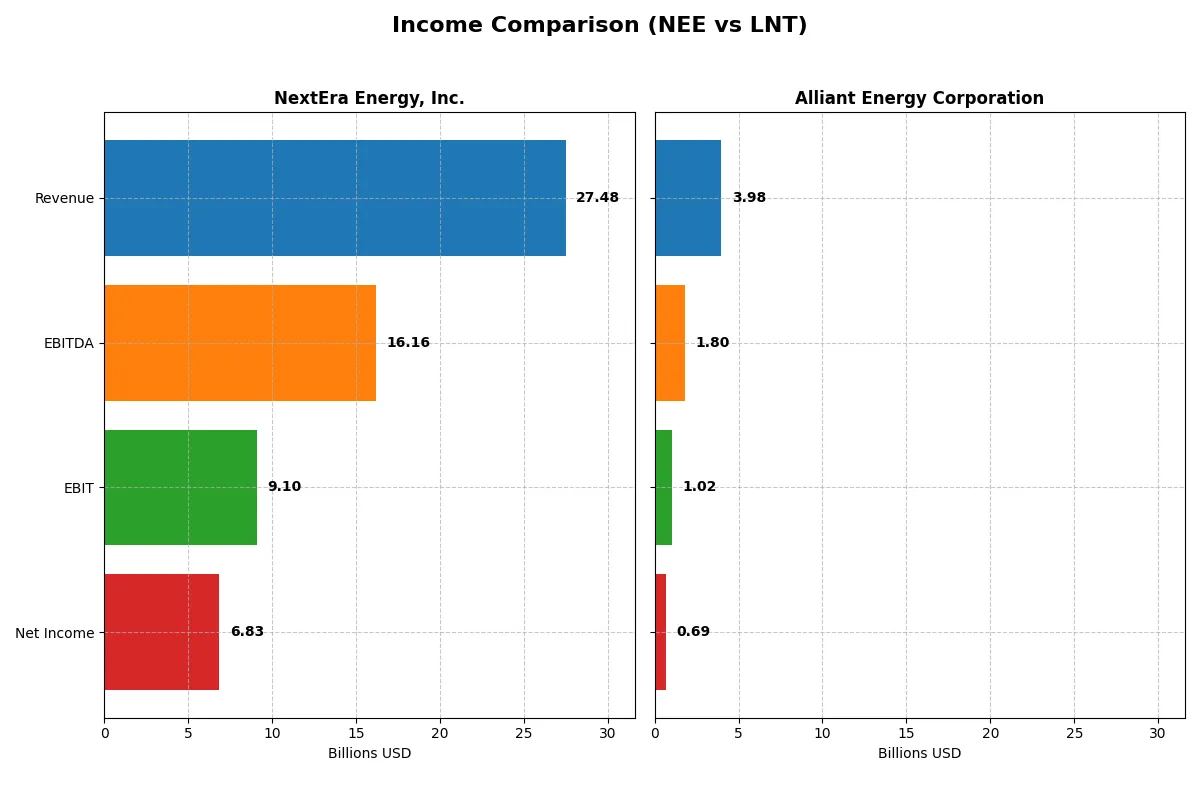
This data dissects the core profitability and scalability of both corporate engines to reveal who dominates the bottom line:
| Metric | NextEra Energy, Inc. (NEE) | Alliant Energy Corporation (LNT) |
|---|---|---|
| Revenue | 27.5B | 3.98B |
| Cost of Revenue | 10.2B | 2.20B |
| Operating Expenses | 8.98B | 894M |
| Gross Profit | 17.3B | 1.78B |
| EBITDA | 16.2B | 1.80B |
| EBIT | 9.10B | 1.03B |
| Interest Expense | 4.57B | 449M |
| Net Income | 6.83B | 690M |
| EPS | 3.31 | 2.69 |
| Fiscal Year | 2025 | 2024 |
Income Statement Analysis: The Bottom-Line Duel
This income statement comparison reveals each company’s operational efficiency and profitability over recent years.
NextEra Energy, Inc. Analysis
NextEra Energy’s revenue rose steadily from 17B in 2021 to 27.5B in 2025, with net income nearly doubling from 3.6B to 6.8B. Its gross margin remains strong near 63%, and net margins hold at a healthy 25%. Despite rising interest expenses, the company sustains solid EBIT growth, showing robust operational momentum in 2025.
Alliant Energy Corporation Analysis
Alliant Energy’s revenue showed modest growth, peaking around 4B in 2023 before slipping slightly to 3.98B in 2024. Net income improved gradually from 614M in 2020 to 690M in 2024, but the net margin hovers around 17%, notably lower than NextEra’s. EBIT margins at 25.7% are stable, yet recent declines in revenue and earnings reflect operational challenges.
Margin Strength vs. Growth Trajectory
NextEra Energy leads with superior revenue growth (61% over five years) and higher margins, translating into nearly double net income growth compared to Alliant. Alliant’s stable margins and slow growth contrast with NextEra’s dynamic expansion and profitability. For investors, NextEra’s profile offers more attractive scale and margin improvement potential despite higher interest expenses.
Financial Ratios Comparison
These vital ratios act as a diagnostic tool to expose the underlying fiscal health, valuation premiums, and capital efficiency of the companies compared below:
| Ratios | NextEra Energy, Inc. (NEE) | Alliant Energy Corporation (LNT) |
|---|---|---|
| ROE | 13.9% | 9.9% |
| ROIC | 4.0% | 4.1% |
| P/E | 21.2 | 22.0 |
| P/B | 2.94 | 2.17 |
| Current Ratio | 0.47 | 0.44 |
| Quick Ratio | 0.38 | 0.33 |
| D/E | 1.64 | 1.49 |
| Debt-to-Assets | 43.3% | 45.8% |
| Interest Coverage | 3.35 | 1.97 |
| Asset Turnover | 0.13 | 0.18 |
| Fixed Asset Turnover | 0.18 | 0.21 |
| Payout ratio | 61.0% | 71.3% |
| Dividend yield | 2.87% | 3.24% |
| Fiscal Year | 2024 | 2024 |
Efficiency & Valuation Duel: The Vital Signs
Financial ratios serve as a company’s DNA, exposing underlying risks and operational strengths that raw numbers alone cannot reveal.
NextEra Energy, Inc.
NextEra Energy displays solid profitability with a 13.9% ROE and a strong 28.1% net margin, indicating efficient core operations. Its valuation is reasonable with a P/E of 21.2 and P/B near 2.9, neither stretched nor cheap. The firm rewards shareholders with a 2.9% dividend yield, reflecting a balanced return approach amid reinvestment needs.
Alliant Energy Corporation
Alliant Energy posts a modest 9.9% ROE and a decent 17.3% net margin, showing moderate profitability. Its valuation metrics, P/E at 22.0 and P/B at 2.2, remain neutral but suggest less premium pricing than peers. The company offers a slightly higher 3.2% dividend yield, signaling a focus on income distribution despite reinvestment challenges.
Valuation Nuance Meets Operational Reality
Both firms present a slightly unfavorable overall ratio profile with similar neutral valuations. NextEra’s higher profitability contrasts with Alliant’s superior dividend yield. Investors seeking operational efficiency might prefer NextEra, while income-focused profiles may lean toward Alliant’s steadier cash returns.
Which one offers the Superior Shareholder Reward?
NextEra Energy (NEE) pays a 2.87% dividend yield with a high payout ratio of 61%, supported by positive free cash flow of 2.3B in 2024. Its buyback activity is moderate but sustainable, with dividend plus capex coverage just above 1.0. Alliant Energy (LNT) offers a slightly higher 3.24% yield but with a riskier payout ratio of 71% and negative free cash flow of -4.2B in 2024, indicating pressure on cash returns. LNT’s buybacks are limited due to cash constraints, and its dividend coverage is weak at 0.43. Historically in regulated utilities, I’ve observed that sustainable dividends backed by solid FCF and manageable leverage drive long-term total returns. NEE’s distribution model is more prudent and durable. I conclude NEE offers superior shareholder reward potential in 2026.
Comparative Score Analysis: The Strategic Profile
The radar chart reveals the fundamental DNA and trade-offs of NextEra Energy, Inc. and Alliant Energy Corporation’s financial profiles:
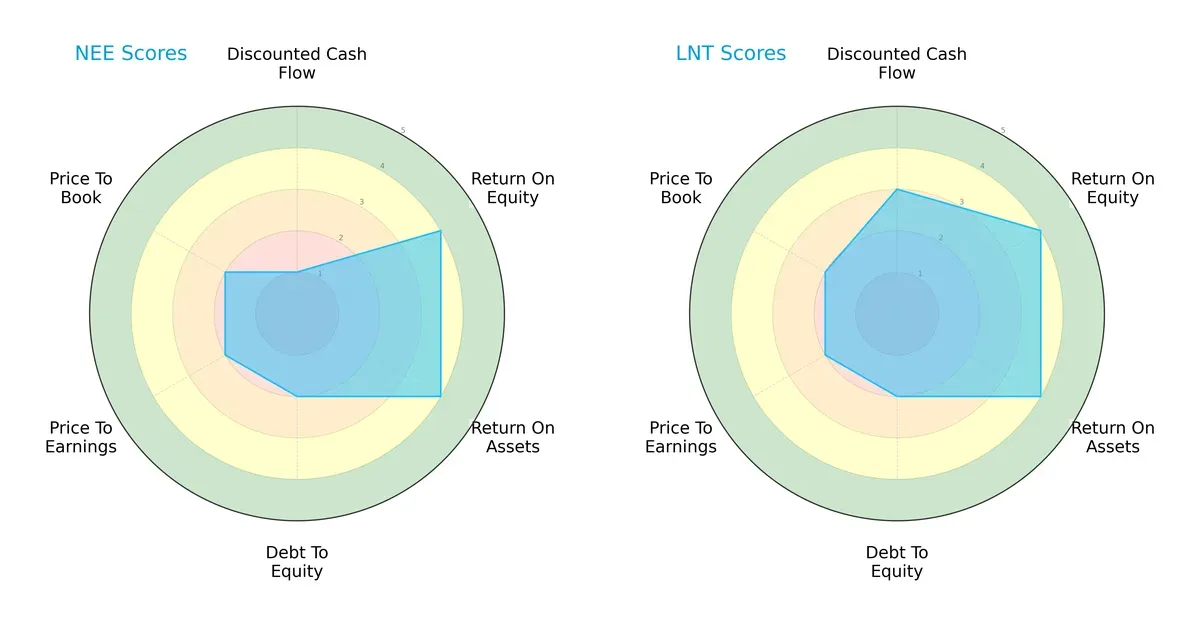
NextEra Energy shows strength in return on equity and assets but suffers from a very unfavorable discounted cash flow score. Alliant Energy balances a stronger DCF score with comparable profitability metrics. Both have moderate leverage and valuation scores, but Alliant’s profile appears more balanced, while NextEra relies heavily on operational efficiency rather than valuation or cash flow robustness.
Bankruptcy Risk: Solvency Showdown
NextEra Energy and Alliant Energy both fall into the Altman Z-Score distress zone, signaling elevated bankruptcy risk under current market conditions:
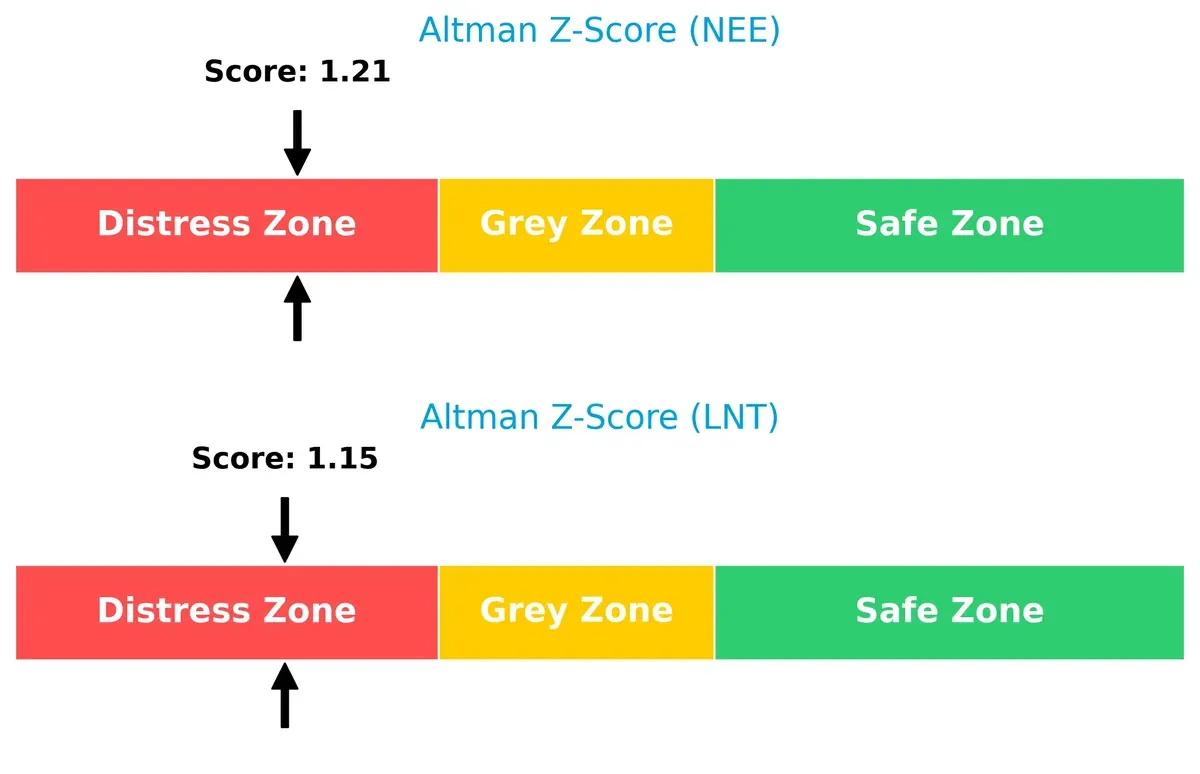
NextEra’s Z-score is slightly higher at 1.21 versus Alliant’s 1.15, but both remain below 1.8, suggesting financial distress and a high probability of solvency challenges in prolonged economic downturns.
Financial Health: Quality of Operations
NextEra Energy reports a Piotroski F-Score of 6, higher than Alliant Energy’s 4, indicating stronger internal financial health and operational quality:
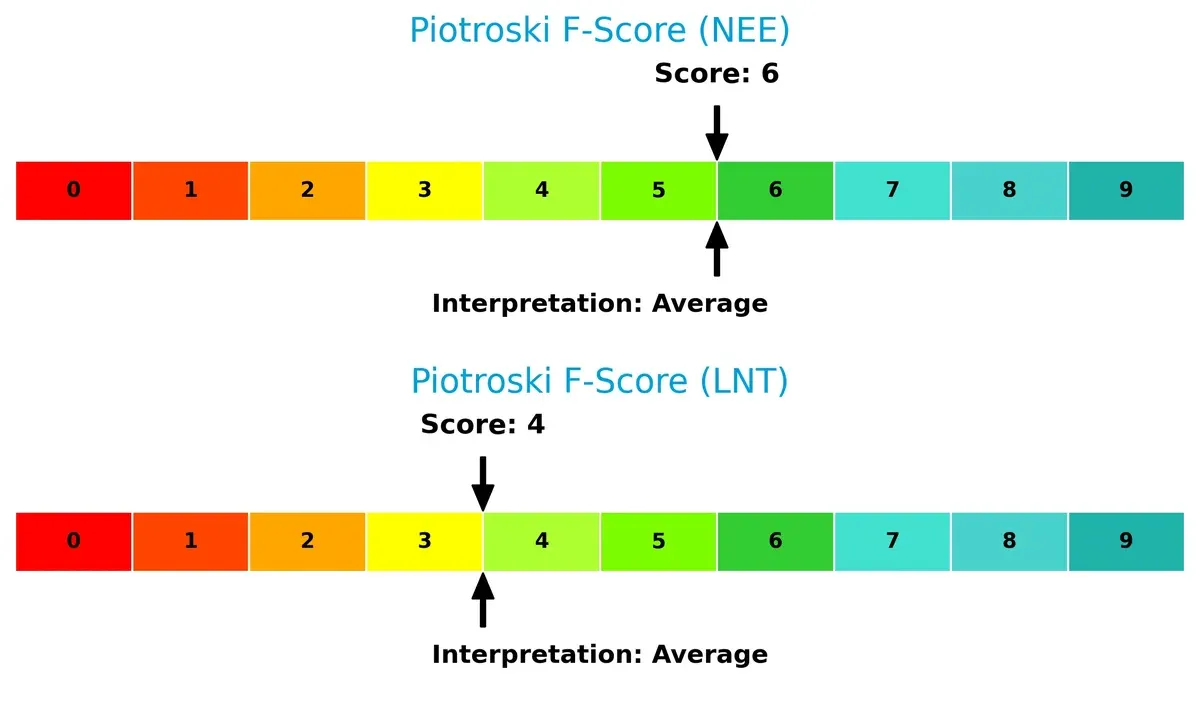
While neither company scores in the “very strong” category, NextEra demonstrates fewer red flags in profitability and efficiency metrics, which may provide a relative advantage in navigating financial pressures.
How are the two companies positioned?
This section dissects the operational DNA of NextEra Energy and Alliant Energy by comparing their revenue distribution and internal strengths and weaknesses. The goal is to confront their economic moats to reveal which business model offers the most resilient and sustainable competitive advantage today.
Revenue Segmentation: The Strategic Mix
The following visual comparison dissects how NextEra Energy, Inc. and Alliant Energy Corporation diversify their income streams and where their primary sector bets lie:
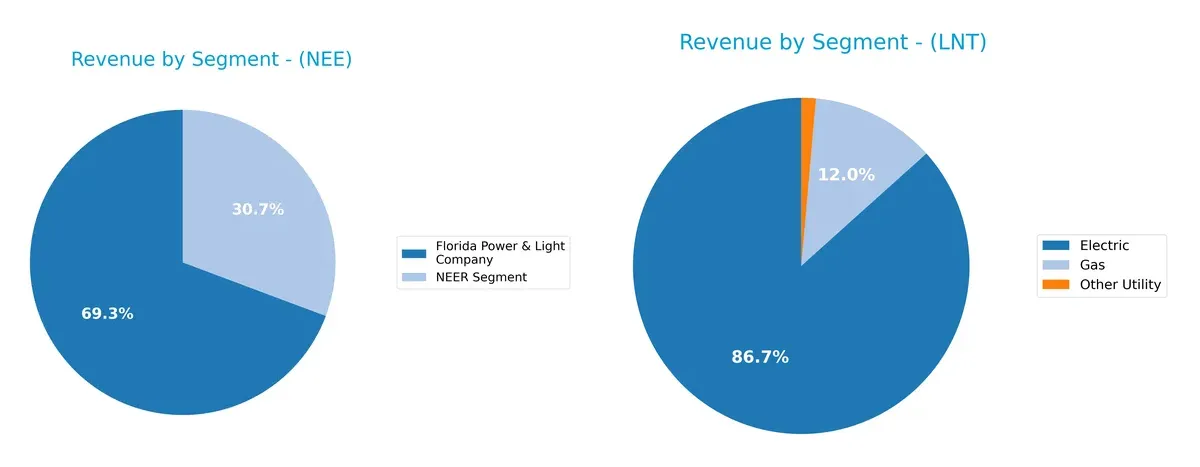
NextEra Energy anchors revenue in its Florida Power & Light Company segment with $17B in 2024, dwarfing its $7.5B NEER segment. This split shows a strong ecosystem lock-in with infrastructure dominance. Conversely, Alliant Energy diversifies modestly with $3.37B from Electric, $465M Gas, and $54M Other Utility, reducing concentration risk but lacking NextEra’s scale. NextEra’s heavy reliance on one segment poses risks but benefits from regional monopoly advantages.
Strengths and Weaknesses Comparison
This table compares the strengths and weaknesses of NextEra Energy, Inc. and Alliant Energy Corporation:
NextEra Energy Strengths
- Higher net margin at 28.06%
- Favorable WACC at 6.51%
- Consistent dividend yield of 2.87%
- Large revenue base with diversified segments
Alliant Energy Strengths
- Favorable net margin at 17.33%
- Favorable WACC at 5.96%
- Higher dividend yield at 3.24%
- Revenue diversified across electric, gas, and other utilities
NextEra Energy Weaknesses
- Low current and quick ratios (0.47 & 0.38) indicate liquidity risk
- High debt-to-equity ratio at 1.64
- Unfavorable ROIC (4.04%) below WACC
- Low asset turnover ratios (0.13 fixed asset turnover)
- Interest coverage low at 1.99
Alliant Energy Weaknesses
- Low liquidity ratios (current 0.44, quick 0.33)
- Unfavorable ROE at 9.85% and ROIC at 4.08% below WACC
- Debt-to-equity at 1.49 poses financial leverage risk
- Unfavorable asset turnover at 0.18 fixed asset turnover
NextEra Energy shows superior net margin and dividend yield but faces liquidity and efficiency challenges. Alliant Energy maintains solid diversification and dividend yield but struggles with profitability and liquidity metrics. Both companies have slightly unfavorable overall financial ratio profiles, highlighting areas for strategic financial management.
The Moat Duel: Analyzing Competitive Defensibility
A structural moat is the only reliable shield protecting long-term profits from relentless competition erosion in regulated utilities:
NextEra Energy, Inc. (NEE): Innovation-Driven Clean Energy Moat
NextEra leverages intangible assets and scale in renewable energy, reflected in strong gross margins (62.8%) and stable EBIT margins (33.1%). However, declining ROIC versus WACC signals looming value destruction. Expansion into battery storage and transmission could deepen or threaten its moat by 2026.
Alliant Energy Corporation (LNT): Regional Regulatory Moat with Operational Focus
Alliant’s moat rests on regulated utility operations and cost control, yielding moderate margins (EBIT 25.7%) but weaker revenue growth and negative ROIC trend. Unlike NextEra’s innovation edge, Alliant must navigate shrinking profitability but may exploit regional regulatory stability for selective expansion.
Innovation Scale vs. Regulatory Stability: Who Defends the Moat Better?
Both firms exhibit very unfavorable ROIC trends below WACC, indicating value destruction. NextEra’s broader scale and innovation-driven moat offer deeper competitive advantages despite current profitability pressures. I view NextEra as better positioned to defend market share amid evolving energy landscapes.
Which stock offers better returns?
Over the past year, both stocks show significant price appreciation, with NextEra Energy accelerating gains while Alliant Energy’s rally slows amid recent decline.
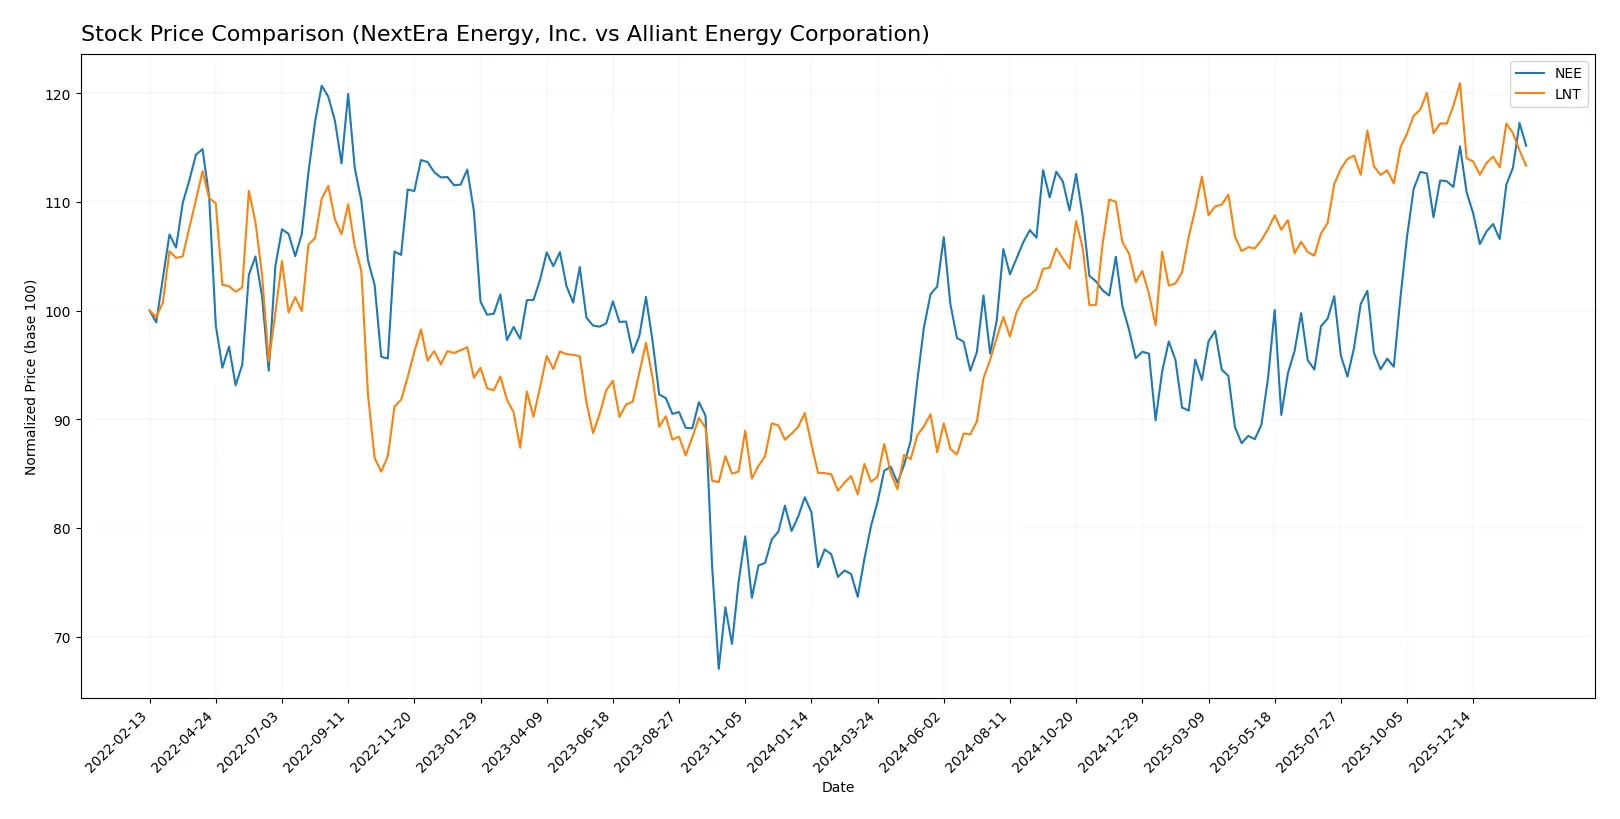
Trend Comparison
NextEra Energy (NEE) gained 43.7% over the last 12 months, showing a bullish trend with price acceleration. The stock hit a high of 87.9 and a low of 60.08, with volatility measured at 6.29%.
Alliant Energy (LNT) posted a 34.6% rise over the same period, also bullish but with deceleration in momentum. Its price ranged between 48.0 and 69.47, with lower volatility of 5.59%.
Comparing trends, NextEra Energy outperformed Alliant Energy with higher returns and accelerating momentum, despite recent volume decreases and slight seller dominance.
Target Prices
Analysts show moderate optimism for NextEra Energy and Alliant Energy with target prices above current levels.
| Company | Target Low | Target High | Consensus |
|---|---|---|---|
| NextEra Energy, Inc. | 84 | 104 | 93.09 |
| Alliant Energy Corporation | 67 | 78 | 73 |
NextEra’s consensus target of 93.09 suggests a 7.8% upside from its 86.33 share price, signaling steady growth expectations. Alliant Energy’s target consensus of 73 implies a 12.1% potential rise, indicating analyst confidence above current 65.11 levels.

Don’t Let Luck Decide Your Entry Point
Optimize your entry points with our advanced ProRealTime indicators. You’ll get efficient buy signals with precise price targets for maximum performance. Start outperforming now!
How do institutions grade them?
NextEra Energy, Inc. Grades
The following table summarizes recent institutional grades for NextEra Energy, Inc.:
| Grading Company | Action | New Grade | Date |
|---|---|---|---|
| Mizuho | Maintain | Neutral | 2026-01-28 |
| Argus Research | Maintain | Buy | 2026-01-28 |
| BMO Capital | Maintain | Outperform | 2026-01-27 |
| Wells Fargo | Maintain | Overweight | 2026-01-20 |
| Barclays | Maintain | Equal Weight | 2026-01-15 |
| Jefferies | Maintain | Hold | 2025-12-31 |
| UBS | Maintain | Buy | 2025-12-17 |
| JP Morgan | Maintain | Overweight | 2025-12-11 |
| BMO Capital | Maintain | Outperform | 2025-12-10 |
| UBS | Maintain | Buy | 2025-12-10 |
Alliant Energy Corporation Grades
The following table summarizes recent institutional grades for Alliant Energy Corporation:
| Grading Company | Action | New Grade | Date |
|---|---|---|---|
| Barclays | Upgrade | Equal Weight | 2026-01-21 |
| BMO Capital | Upgrade | Outperform | 2026-01-13 |
| Argus Research | Downgrade | Hold | 2026-01-09 |
| UBS | Maintain | Buy | 2025-12-17 |
| UBS | Upgrade | Buy | 2025-10-24 |
| BMO Capital | Maintain | Market Perform | 2025-10-17 |
| B of A Securities | Maintain | Buy | 2025-10-17 |
| Barclays | Maintain | Underweight | 2025-10-14 |
| UBS | Maintain | Neutral | 2025-10-10 |
| B of A Securities | Maintain | Buy | 2025-08-14 |
Which company has the best grades?
NextEra Energy, Inc. holds consistently stronger grades, including multiple “Buy” and “Outperform” ratings. Alliant Energy shows mixed upgrades but also downgrades and “Underweight” ratings. Investors might view NextEra’s better grades as a sign of steadier institutional confidence.
Risks specific to each company
The following categories identify critical pressure points and systemic threats facing NextEra Energy, Inc. and Alliant Energy Corporation in the 2026 market environment:
1. Market & Competition
NextEra Energy, Inc.
- Dominates with 28,564 MW capacity and broad regional reach; faces intense competition in clean energy transition.
Alliant Energy Corporation
- Smaller scale with 347 MW gas and 225 MW wind assets; competes regionally with a diversified utility mix.
2. Capital Structure & Debt
NextEra Energy, Inc.
- High debt-to-equity (1.64) and low interest coverage (1.99) signal leverage risk and refinancing challenges.
Alliant Energy Corporation
- Slightly lower debt-to-equity (1.49) and better interest coverage (2.28) reduce financial strain but still cautionary.
3. Stock Volatility
NextEra Energy, Inc.
- Beta of 0.76 indicates moderate volatility, reflecting sensitivity to market swings.
Alliant Energy Corporation
- Lower beta of 0.67 suggests more stability but less growth-driven price movement.
4. Regulatory & Legal
NextEra Energy, Inc.
- Subject to stringent environmental regulations impacting nuclear and fossil assets; transition risks remain high.
Alliant Energy Corporation
- Faces regulatory risks typical of Midwestern utilities, with potential impacts from emissions standards and rate cases.
5. Supply Chain & Operations
NextEra Energy, Inc.
- Complex supply chain for renewable projects could face delays and cost overruns amid rising materials prices.
Alliant Energy Corporation
- Smaller scale eases operational complexity but exposes vulnerabilities to regional supply disruptions.
6. ESG & Climate Transition
NextEra Energy, Inc.
- Aggressive clean energy investments create long-term moat but require heavy capital and regulatory approvals.
Alliant Energy Corporation
- Moderate ESG progress with mixed fossil and renewables; risks from slower transition to low-carbon assets.
7. Geopolitical Exposure
NextEra Energy, Inc.
- Primarily domestic operations limit geopolitical risk but subject to US energy policy shifts.
Alliant Energy Corporation
- Similarly US-focused; less diversified exposure but stable political environment.
Which company shows a better risk-adjusted profile?
Alliant Energy’s moderate leverage and lower stock volatility offer a steadier risk profile. NextEra’s dominant market position and aggressive clean energy push deliver growth but increase financial and regulatory risks. Both show financial distress signals with Altman Z-scores below 1.8, but NextEra’s higher debt and interest coverage concerns sharpen my caution.
Final Verdict: Which stock to choose?
NextEra Energy, Inc. (NEE) excels as a cash-generating powerhouse, leveraging scale and operational efficiency in a dynamic energy sector. Its main point of vigilance lies in its stretched liquidity and rising debt levels. NEE might suit investors seeking aggressive growth with a tolerance for financial leverage risks.
Alliant Energy Corporation (LNT) boasts a strategic moat anchored in steady utility operations and a reliable dividend yield, offering relatively better stability than NEE. Its slower growth and cautious capital allocation appeal to investors favoring GARP strategies that blend income and moderate expansion.
If you prioritize high-growth potential and are comfortable navigating financial leverage, NextEra Energy outshines with its operational momentum despite liquidity concerns. However, if you seek more stability and consistent income with a conservative growth profile, Alliant Energy offers better safety and dividend reliability. Both present analytical scenarios with distinct risk-return trade-offs for different investor avatars.
Disclaimer: Investment carries a risk of loss of initial capital. The past performance is not a reliable indicator of future results. Be sure to understand risks before making an investment decision.
Go Further
I encourage you to read the complete analyses of NextEra Energy, Inc. and Alliant Energy Corporation to enhance your investment decisions: