In the evolving landscape of regulated electric utilities, FirstEnergy Corp. (FE) and Alliant Energy Corporation (LNT) stand out as key players. Both companies serve millions of customers across multiple states, focusing on electricity generation and distribution while integrating diverse energy sources. Their overlapping markets and innovation strategies make a comparison essential. In this article, I will help you identify which company offers the most compelling opportunity for your investment portfolio.

Table of contents
Companies Overview
I will begin the comparison between FirstEnergy Corp. and Alliant Energy Corporation by providing an overview of these two companies and their main differences.
FirstEnergy Corp. Overview
FirstEnergy Corp. operates in the regulated electric industry, generating, transmitting, and distributing electricity across several U.S. states. The company owns diverse power generating assets including coal, nuclear, hydroelectric, natural gas, wind, and solar facilities. Serving approximately 6 million customers, FirstEnergy maintains extensive transmission and distribution networks, positioning itself as a major utility provider headquartered in Akron, Ohio.
Alliant Energy Corporation Overview
Alliant Energy is a utility holding company providing regulated electricity and natural gas services primarily in the Midwest. It operates through electric and gas segments and serves retail customers in Iowa and Wisconsin via its subsidiaries. The company also manages freight operations and maintains interests in natural gas and wind power generation, with headquarters in Madison, Wisconsin, and a customer base spanning multiple industrial sectors.
Key similarities and differences
Both companies operate within the regulated electric utility sector, focusing on electricity generation and distribution. FirstEnergy has a broader geographic reach and a larger customer base compared to Alliant Energy, which concentrates on Midwest states and includes natural gas services and freight operations. FirstEnergy’s asset mix is more diverse with significant nuclear and coal facilities, while Alliant Energy integrates freight logistics and renewable energy interests alongside its utility operations.
Income Statement Comparison
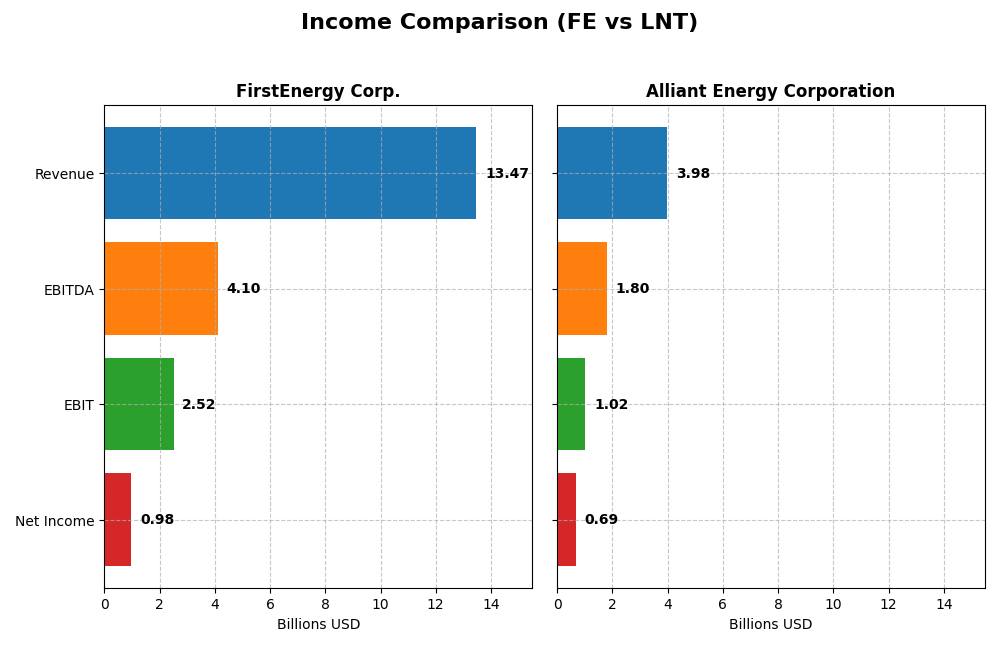
Below is a side-by-side comparison of key income statement metrics for FirstEnergy Corp. and Alliant Energy Corporation for the fiscal year 2024.
| Metric | FirstEnergy Corp. (FE) | Alliant Energy Corporation (LNT) |
|---|---|---|
| Market Cap | 25.8B | 16.7B |
| Revenue | 13.5B | 4.0B |
| EBITDA | 4.1B | 1.8B |
| EBIT | 2.5B | 1.0B |
| Net Income | 978M | 690M |
| EPS | 1.7 | 2.69 |
| Fiscal Year | 2024 | 2024 |
Income Statement Interpretations
FirstEnergy Corp.
FirstEnergy’s revenue increased steadily from $10.8B in 2020 to $13.5B in 2024, representing a solid 24.9% growth over five years. However, net income declined by 9.4% during the same period, with net margins deteriorating by 27.4%. The 2024 results show moderate revenue growth of 4.7% but a 15.2% drop in net margin, indicating margin pressures despite gross profit improvements.
Alliant Energy Corporation
Alliant Energy’s revenue rose from $3.4B in 2020 to $3.9B in 2024, reflecting a 16.5% growth over five years. Net income increased by 10.6%, supported by a strong net margin of 17.3% in 2024. However, the latest year saw a slight revenue decline of 1.1% and a small decrease in net margin, with EBIT and EPS also contracting, signaling some recent operational challenges.
Which one has the stronger fundamentals?
Both companies face unfavorable overall income statement evaluations despite showing periods of growth. FirstEnergy boasts higher revenue and gross margin, but its declining net income and margins raise concerns. Alliant Energy maintains better net margin and net income growth overall, yet its recent revenue and earnings decline temper optimism. Fundamentals appear mixed, with neither company demonstrating decisively stronger income statement performance.
Financial Ratios Comparison
Below is a comparison of key financial ratios for FirstEnergy Corp. and Alliant Energy Corporation based on their most recent fiscal year data for 2024.
| Ratios | FirstEnergy Corp. (FE) | Alliant Energy Corporation (LNT) |
|---|---|---|
| ROE | 7.85% | 9.85% |
| ROIC | 3.66% | 4.88% |
| P/E | 23.39 | 21.98 |
| P/B | 1.84 | 2.17 |
| Current Ratio | 0.56 | 0.44 |
| Quick Ratio | 0.45 | 0.33 |
| D/E (Debt-to-Equity) | 1.95 | 1.49 |
| Debt-to-Assets | 46.63% | 45.81% |
| Interest Coverage | 2.35 | 1.97 |
| Asset Turnover | 0.26 | 0.18 |
| Fixed Asset Turnover | 0.33 | 0.21 |
| Payout ratio | 99.18% | 71.30% |
| Dividend yield | 4.24% | 3.24% |
Interpretation of the Ratios
FirstEnergy Corp.
FirstEnergy Corp. shows a mixed profile with several unfavorable ratios such as return on equity (7.85%), return on invested capital (3.66%), and liquidity ratios (current ratio 0.56). Asset turnover ratios are also weak, pointing to inefficiencies. The dividend yield is favorable at 4.24%, indicating a consistent dividend policy supported by stable payouts, though coverage by free cash flow is a concern.
Alliant Energy Corporation
Alliant Energy exhibits a stronger net margin (17.33%) and a respectable dividend yield of 3.24%, reflecting steady shareholder returns. However, it shares similar weaknesses with FirstEnergy in return on equity (9.85%) and return on invested capital (4.88%), along with low liquidity and asset turnover ratios. The payout remains sustainable, but debt levels are moderately high.
Which one has the best ratios?
Both companies face similar challenges with liquidity and asset efficiency, while maintaining slightly unfavorable overall ratio profiles. Alliant Energy’s stronger net margin and slightly higher proportion of favorable ratios suggest a marginally better performance, but both remain cautious cases due to their elevated debt and modest returns on equity and invested capital.
Strategic Positioning
This section compares the strategic positioning of FirstEnergy Corp. and Alliant Energy Corporation across market position, key segments, and exposure to technological disruption:
FirstEnergy Corp.
- Large market cap of 25.8B USD, serving 6M customers in multiple states, facing typical regulated electric competition
- Focus on regulated electric distribution and transmission segments; diverse power generation sources including coal, nuclear, hydro, gas, wind, and solar
- Owns varied generation assets but no explicit mention of digital or disruptive technology focus
Alliant Energy Corporation
- Smaller market cap of 16.7B USD, serving under 1.5M customers primarily in Midwest, with regulated competition
- Operates electric and gas utilities, plus freight services; key segments include electric, gas, and other utility operations
- Limited exposure to technological disruption, no clear emphasis on innovation or digital transformation stated
FirstEnergy Corp. vs Alliant Energy Corporation Positioning
FirstEnergy maintains a diversified energy generation portfolio spanning multiple states with larger scale, while Alliant Energy concentrates on electric and gas utilities in the Midwest with ancillary freight operations. FirstEnergy’s broader geographic and asset diversity contrasts with Alliant’s more focused regional utility approach.
Which has the best competitive advantage?
Both companies are currently shedding value with ROIC below WACC; FirstEnergy shows declining profitability while Alliant Energy’s profitability remains stable but unfavorable, indicating neither has a strong competitive moat at present.
Stock Comparison
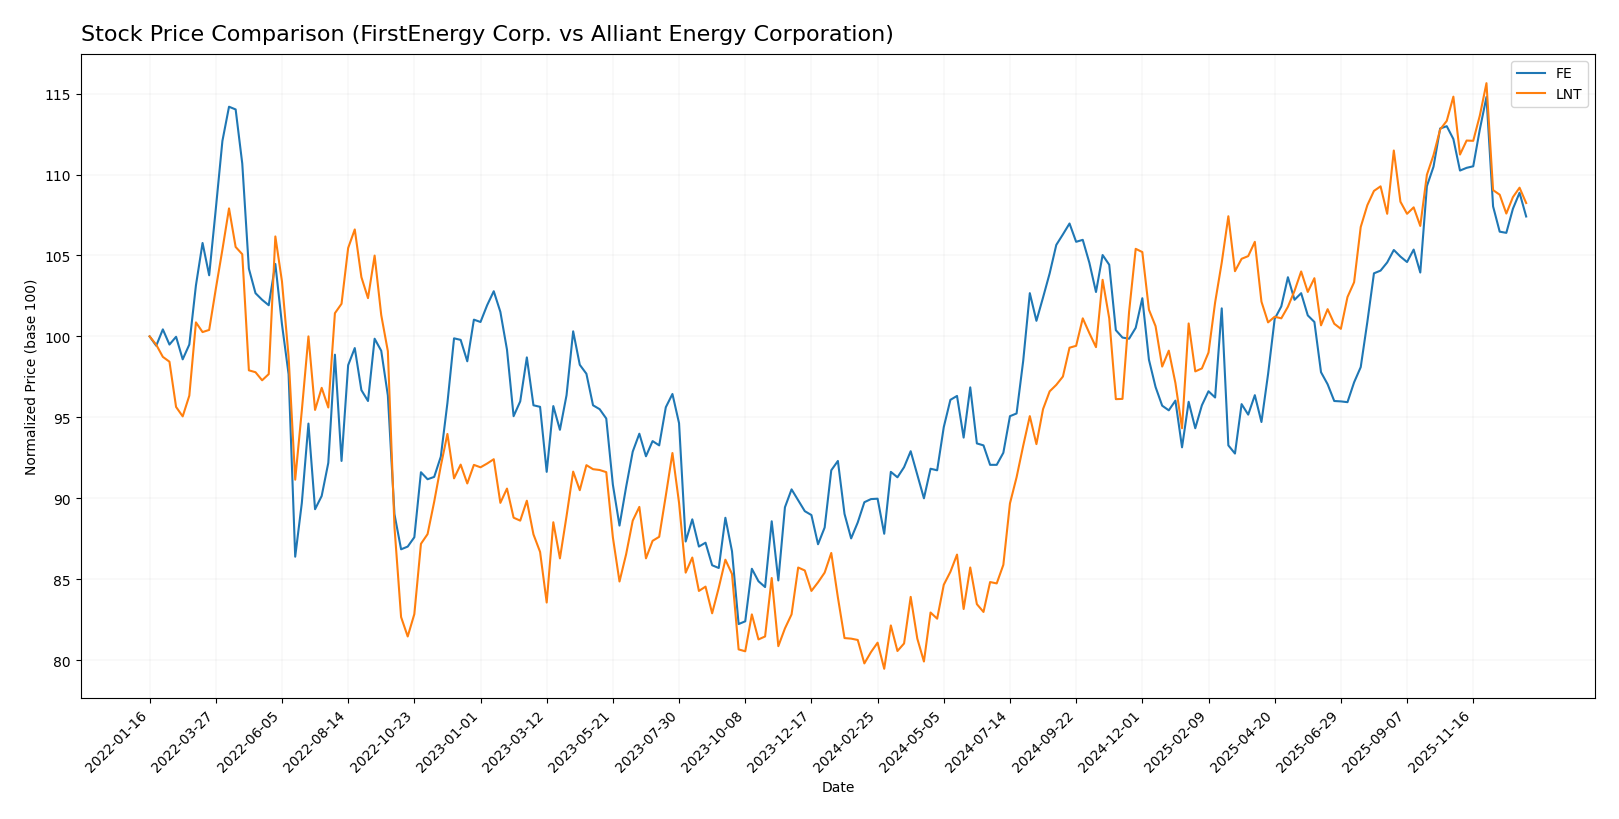
The stock prices of FirstEnergy Corp. and Alliant Energy Corporation have shown significant bullish trends over the past 12 months, with both experiencing deceleration in momentum and recent minor declines in price.
Trend Analysis
FirstEnergy Corp. (FE) posted a 19.42% price increase over the past year, indicating a bullish trend with decelerating momentum. The stock ranged from a low of 36.5 to a high of 47.72, with recent weeks showing a slight downward trend.
Alliant Energy Corporation (LNT) showed a stronger bullish trend with a 34.48% gain over the same period. Despite deceleration, volatility was higher (std deviation 5.9), and the stock fluctuated between 47.73 and 69.47, also experiencing a recent decline.
Comparing both, LNT outperformed FE by delivering the highest market performance over the past year, with a larger percentage gain despite similar recent downward pressure.
Target Prices
Analysts provide a positive target price consensus for FirstEnergy Corp. and Alliant Energy Corporation, indicating potential upside from current levels.
| Company | Target High | Target Low | Consensus |
|---|---|---|---|
| FirstEnergy Corp. | 54 | 46 | 49.29 |
| Alliant Energy Corporation | 78 | 65 | 73 |
The consensus targets for both companies are above their current prices—FirstEnergy at $44.65 versus a $49.29 consensus, and Alliant Energy at $65.02 versus a $73 consensus—suggesting moderate growth expectations from analysts.
Analyst Opinions Comparison
This section compares the analysts’ ratings and grades for FirstEnergy Corp. and Alliant Energy Corporation:
Rating Comparison
FE Rating
- Rating: B, classified as Very Favorable overall.
- Discounted Cash Flow Score: 4, Favorable indication of valuation based on future cash flow.
- ROE Score: 4, favorable efficiency in generating profit from shareholders’ equity.
- ROA Score: 3, moderate effectiveness in asset utilization to generate earnings.
- Debt To Equity Score: 1, very unfavorable financial risk due to high debt relative to equity.
- Overall Score: 3, moderate financial standing.
LNT Rating
- Rating: C+, classified as Very Favorable overall.
- Discounted Cash Flow Score: 3, Moderate valuation assessment from projected cash flows.
- ROE Score: 1, very unfavorable efficiency in generating profit from shareholders’ equity.
- ROA Score: 4, favorable effectiveness in asset utilization to generate earnings.
- Debt To Equity Score: 1, very unfavorable financial risk due to high debt relative to equity.
- Overall Score: 2, moderate financial standing but lower than FE.
Which one is the best rated?
Based strictly on the provided data, FE holds a higher rating (B vs. C+) and better scores in discounted cash flow and return on equity. LNT scores better on return on assets, but overall, FE is better rated.
Scores Comparison
Here is a comparison of the Altman Z-Score and Piotroski Score for the two companies:
FE Scores
- Altman Z-Score: 0.78, indicating financial distress zone.
- Piotroski Score: 6, reflecting average financial strength.
LNT Scores
- Altman Z-Score: Data unavailable.
- Piotroski Score: 5, reflecting average financial strength.
Which company has the best scores?
Based on the available data, FE has a known Altman Z-Score indicating financial distress, while LNT’s Altman Z-Score is unavailable. Both companies have average Piotroski Scores, with FE slightly higher at 6 versus 5 for LNT.
Grades Comparison
The following is a summary of recent grades from major grading companies for FirstEnergy Corp. and Alliant Energy Corporation:
FirstEnergy Corp. Grades
This table presents the latest grades assigned by recognized grading companies for FirstEnergy Corp.:
| Grading Company | Action | New Grade | Date |
|---|---|---|---|
| UBS | Maintain | Neutral | 2025-12-17 |
| Mizuho | Maintain | Neutral | 2025-10-24 |
| Scotiabank | Maintain | Sector Outperform | 2025-10-24 |
| UBS | Maintain | Neutral | 2025-10-24 |
| Morgan Stanley | Maintain | Overweight | 2025-10-21 |
| Jefferies | Maintain | Hold | 2025-10-21 |
| Keybanc | Downgrade | Sector Weight | 2025-10-15 |
| Scotiabank | Maintain | Sector Outperform | 2025-10-06 |
| Morgan Stanley | Maintain | Overweight | 2025-09-25 |
| Barclays | Upgrade | Overweight | 2025-08-25 |
Overall, FirstEnergy Corp. shows a stable to slightly positive trend with several “Overweight” and “Sector Outperform” grades and no recent upgrades to “Buy.”
Alliant Energy Corporation Grades
The following grades from recognized grading companies summarize Alliant Energy Corporation’s recent ratings:
| Grading Company | Action | New Grade | Date |
|---|---|---|---|
| Argus Research | Downgrade | Hold | 2026-01-09 |
| UBS | Maintain | Buy | 2025-12-17 |
| UBS | Upgrade | Buy | 2025-10-24 |
| B of A Securities | Maintain | Buy | 2025-10-17 |
| BMO Capital | Maintain | Market Perform | 2025-10-17 |
| Barclays | Maintain | Underweight | 2025-10-14 |
| UBS | Maintain | Neutral | 2025-10-10 |
| B of A Securities | Maintain | Buy | 2025-08-14 |
| BMO Capital | Maintain | Market Perform | 2025-08-11 |
| UBS | Maintain | Neutral | 2025-07-11 |
Alliant Energy Corporation’s grades predominantly favor “Buy” ratings, although a recent downgrade to “Hold” and some “Market Perform” and “Underweight” ratings suggest mixed views.
Which company has the best grades?
Alliant Energy Corporation has received generally stronger grades, with a consensus “Buy” and multiple buy ratings maintained or upgraded recently. FirstEnergy Corp. holds a “Hold” consensus with more neutral to overweight ratings. This difference may influence investor perception regarding growth potential and risk profiles.
Strengths and Weaknesses
Below is a comparison of key strengths and weaknesses for FirstEnergy Corp. (FE) and Alliant Energy Corporation (LNT) based on their most recent financial and operational data.
| Criterion | FirstEnergy Corp. (FE) | Alliant Energy Corporation (LNT) |
|---|---|---|
| Diversification | Moderate; primarily regulated electricity distribution and transmission, with limited unregulated revenue streams | Moderate; electricity and gas segments, some utility diversification |
| Profitability | Low; ROIC 3.66% below WACC 4.85%, declining ROIC trend, net margin 7.26% (neutral) | Moderate; ROIC 4.88% below WACC 5.91%, stable ROIC, net margin 17.33% (favorable) |
| Innovation | Limited innovation evidence; traditional utility model | Incremental innovation in utility services but no strong moat |
| Global presence | Primarily US-focused, no significant global footprint | Primarily US-focused, regional utility presence |
| Market Share | Significant regional share in regulated electricity distribution | Strong regional presence in electricity and gas utility markets |
Key takeaways: Both companies operate mainly in regulated US utility markets with moderate diversification. FirstEnergy struggles with declining profitability and value destruction, while Alliant Energy maintains stable profitability but also fails to create value above its cost of capital. Investors should weigh the risk of value erosion in FirstEnergy against Alliant’s more stable but still unfavorable moat.
Risk Analysis
Below is a comparative table of key risks for FirstEnergy Corp. (FE) and Alliant Energy Corporation (LNT) based on the most recent financial and operational data from 2024.
| Metric | FirstEnergy Corp. (FE) | Alliant Energy Corporation (LNT) |
|---|---|---|
| Market Risk | Moderate beta (0.63), stable but sensitive to energy market shifts | Moderate beta (0.67), exposure to regional utility markets |
| Debt level | High debt-to-equity (1.95), interest coverage moderate (2.49) | High debt-to-equity (1.49), interest coverage moderate (2.28) |
| Regulatory Risk | Significant, due to operations in multiple states with complex regulations | Moderate, regional regulatory environment in Midwest states |
| Operational Risk | Diverse energy mix; coal and nuclear raise operational complexity | Mix of natural gas, wind, and electric distribution; moderate operational risk |
| Environmental Risk | Exposure from coal-fired plants; transition pressures increasing | Transitioning to renewables; moderate environmental risk |
| Geopolitical Risk | Low direct impact; primarily US domestic operations | Low direct impact; US focused |
The most impactful risks for both companies are their high debt levels combined with moderate interest coverage, increasing financial vulnerability. FirstEnergy faces added environmental and regulatory challenges due to its coal and nuclear assets, while Alliant Energy’s regional focus limits geopolitical risks but still requires close monitoring of regulatory changes and renewable energy transitions. Investors should weigh these risks carefully, especially in an evolving energy market with tightening environmental policies.
Which Stock to Choose?
FirstEnergy Corp. (FE) shows mixed financial health with neutral income growth but unfavorable profitability trends over 2020-2024, including declining ROIC below WACC, indicating value destruction. Its financial ratios are slightly unfavorable with notably weak liquidity and leverage metrics, despite a favorable dividend yield. The company holds a very favorable overall rating of B but faces distress-level bankruptcy risk per Altman Z-Score.
Alliant Energy Corporation (LNT) demonstrates more stable profitability with favorable net margins and EBIT margins, though recent revenue growth is slightly negative. Its ROIC also falls below WACC, signaling value shedding but with stable trend. Financial ratios are slightly unfavorable overall, with some weakness in liquidity and leverage, yet it maintains a very favorable rating of C+ and an average Piotroski score. Altman Z-Score data is unavailable.
For investors, the choice might hinge on risk tolerance and investment focus: growth-oriented investors may find LNT’s stable profitability and higher net margin more appealing, while those emphasizing dividend yield and broader rating strength might consider FE’s profile, despite its financial stresses. Both companies show some value destruction, suggesting caution and a need for thorough risk assessment.
Disclaimer: Investment carries a risk of loss of initial capital. The past performance is not a reliable indicator of future results. Be sure to understand risks before making an investment decision.
Go Further
I encourage you to read the complete analyses of FirstEnergy Corp. and Alliant Energy Corporation to enhance your investment decisions: