In the evolving landscape of regulated electric utilities, Exelon Corporation (EXC) and Alliant Energy Corporation (LNT) stand out as key players with overlapping markets and innovative energy strategies. Both companies focus on delivering reliable electricity and natural gas services while advancing renewable energy integration. This comparison will help investors navigate their options and identify which company offers the most compelling investment opportunity in 2026.
Table of contents
Companies Overview
I will begin the comparison between Exelon Corporation and Alliant Energy Corporation by providing an overview of these two companies and their main differences.
Exelon Corporation Overview
Exelon Corporation is a utility services holding company engaged in energy generation, delivery, and marketing across the US and Canada. Its portfolio includes nuclear, fossil, wind, hydroelectric, biomass, and solar facilities. The company also provides electricity and natural gas sales, transmission, distribution, and various support services, serving diverse customers from municipalities to industrial sectors.
Alliant Energy Corporation Overview
Alliant Energy Corporation operates as a utility holding company providing regulated electricity and natural gas services primarily in Iowa and Wisconsin. It operates through electric, gas, and other utility segments, serving retail and wholesale customers. The company also owns freight services and holds interests in natural gas and wind energy assets, focusing on a regional customer base in the Midwest.
Key similarities and differences
Both companies operate in the regulated electric utility sector and serve retail and wholesale customers with electricity and natural gas. Exelon operates on a larger scale with diverse energy generation sources across two countries, while Alliant Energy has a more regional focus on the Midwest US, integrating freight services and specific energy assets. Employee count and market capitalization also highlight Exelon’s larger operational scope.
Income Statement Comparison
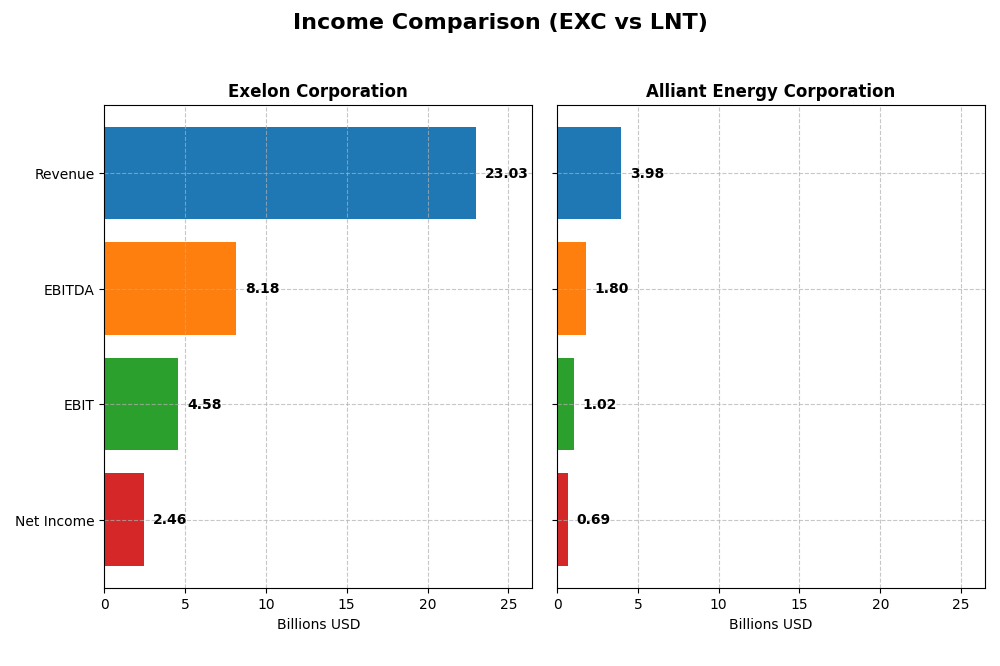
This table presents a side-by-side comparison of the most recent fiscal year income statement metrics for Exelon Corporation and Alliant Energy Corporation.
| Metric | Exelon Corporation | Alliant Energy Corporation |
|---|---|---|
| Market Cap | 43.8B | 16.7B |
| Revenue | 23.0B | 3.98B |
| EBITDA | 8.18B | 1.80B |
| EBIT | 4.58B | 1.03B |
| Net Income | 2.46B | 690M |
| EPS | 2.45 | 2.69 |
| Fiscal Year | 2024 | 2024 |
Income Statement Interpretations
Exelon Corporation
Exelon’s revenue trended upward from 2021 to 2024, increasing from $17.9B to $23.0B, though the overall 2020-2024 growth was unfavorable at -30.3% due to 2020’s high base. Net income rose steadily, reaching $2.46B in 2024, with net margin improving significantly to 10.68%. The latest year showed moderate revenue growth of 6% and a slight dip in net margin, indicating stable profitability despite margin pressure.
Alliant Energy Corporation
Alliant Energy’s revenue increased overall, from $3.42B in 2020 to $3.98B in 2024, with a positive 16.5% growth over five years but a recent 1.1% decline in 2024. Net income grew modestly to $690M, while net margin remained strong at 17.33%. However, recent declines in EBIT, net margin, and EPS in 2024 suggest some margin compression and operational challenges despite solid longer-term growth.
Which one has the stronger fundamentals?
Exelon demonstrates stronger fundamentals with favorable gross, EBIT, and net margins, alongside consistent net income and EPS growth over the period. Alliant Energy, while showing solid revenue growth, faces unfavorable margin trends and recent declines in key profitability metrics. The overall income statement evaluation favors Exelon, reflecting more robust income quality and margin stability.
Financial Ratios Comparison
This table presents a side-by-side comparison of key financial ratios for Exelon Corporation (EXC) and Alliant Energy Corporation (LNT) based on their latest fiscal year data ending in 2024.
| Ratios | Exelon Corporation (EXC) | Alliant Energy Corporation (LNT) |
|---|---|---|
| ROE | 9.1% | 9.9% |
| ROIC | 3.9% | 4.9% |
| P/E | 15.3 | 22.0 |
| P/B | 1.40 | 2.17 |
| Current Ratio | 0.87 | 0.44 |
| Quick Ratio | 0.78 | 0.33 |
| D/E (Debt-to-Equity) | 1.73 | 1.49 |
| Debt-to-Assets | 43.3% | 45.8% |
| Interest Coverage | 2.26 | 1.97 |
| Asset Turnover | 0.21 | 0.18 |
| Fixed Asset Turnover | 0.29 | 0.21 |
| Payout ratio | 62.0% | 71.3% |
| Dividend yield | 4.04% | 3.24% |
Interpretation of the Ratios
Exelon Corporation
Exelon shows strong net margin and dividend yield, indicating profitability and shareholder returns. However, it faces concerns with low current and quick ratios, high debt-to-equity ratio, and weak asset turnover ratios, reflecting liquidity and efficiency challenges. The payout ratio and dividend appear sustainable, supported by consistent dividends, but free cash flow to equity is negative, posing potential risk for dividend coverage.
Alliant Energy Corporation
Alliant Energy posts a favorable net margin and maintains a solid dividend yield, though its payout is supported amid a negative free cash flow to equity. Weak liquidity ratios, moderate leverage, and poor asset turnover ratios suggest operational constraints. The company’s dividend payments continue despite these, reflecting a commitment to shareholder returns but with caution warranted on cash flow sustainability.
Which one has the best ratios?
Both companies exhibit slightly unfavorable overall ratios, sharing equal unfavorable percentages. Exelon has a stronger dividend yield and price-to-book ratio, while Alliant Energy offers a better net margin and return on equity. Liquidity and asset turnover ratios are weak for both, making neither decisively superior in overall financial ratio strength.
Strategic Positioning
This section compares the strategic positioning of Exelon Corporation and Alliant Energy Corporation in terms of market position, key segments, and exposure to technological disruption:
Exelon Corporation (EXC)
- Large market cap of 43.8B in regulated electric utilities, facing moderate competitive pressure.
- Diverse energy generation including nuclear, fossil, wind, hydro, biomass, and solar segments.
- Extensive involvement in multiple energy sources but potential exposure to shifts in energy technology.
Alliant Energy Corporation (LNT)
- Smaller market cap of 16.7B in regulated electric utilities, with regional competitive pressures.
- Focused on regulated electric and gas services, plus freight and logistics operations.
- Exposure primarily tied to regulated utilities, with limited diversification in energy technologies.
EXC vs LNT Positioning
EXC pursues a diversified strategy across multiple energy sources and services, offering broad market coverage but potentially higher complexity. LNT maintains a more concentrated focus on regulated utilities and complementary freight services, with simpler operational scope but less diversification.
Which has the best competitive advantage?
Both companies are currently shedding value as ROIC remains below WACC; however, EXC shows a growing ROIC trend, suggesting improving profitability, while LNT’s ROIC trend is neutral, indicating stable but unfavorable value creation.
Stock Comparison
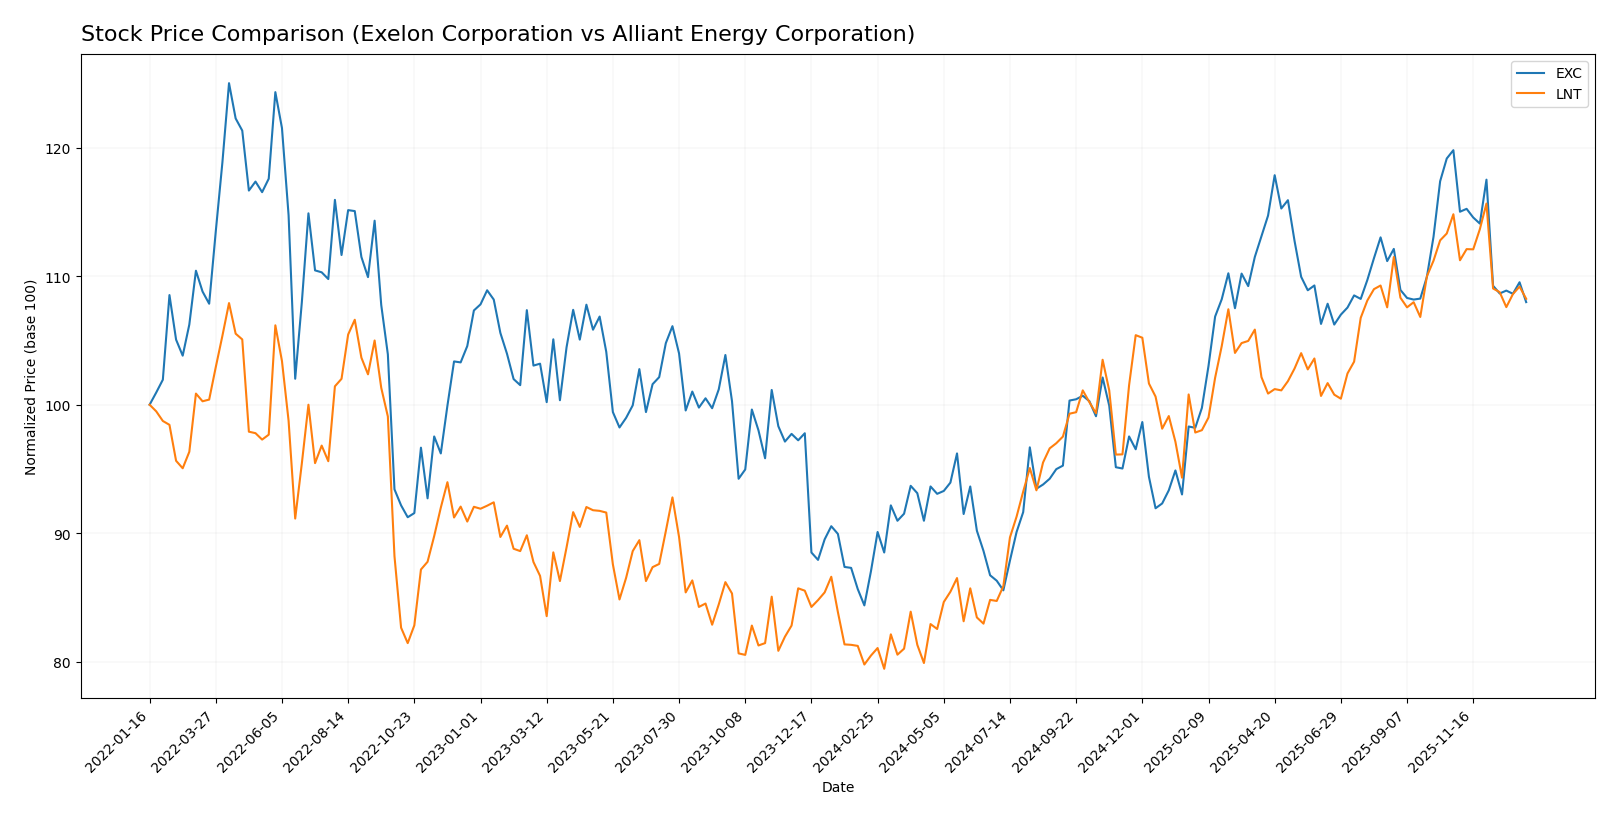
The past year has seen both Exelon Corporation and Alliant Energy Corporation exhibit bullish trends with decelerating momentum, marked by notable price highs, recent downward corrections, and shifting buyer-seller dynamics.
Trend Analysis
Exelon Corporation’s stock rose 24.03% over the past 12 months, indicating a bullish trend with deceleration. The price ranged from a low of 34.31 to a high of 48.04, with recent weakness showing a -9.87% decline and a slight negative slope.
Alliant Energy Corporation gained 34.48% over the last year, also reflecting a bullish trend with deceleration. Prices moved between 47.73 and 69.47, with a recent pullback of -5.73% and a mild downward slope observed.
Comparatively, Alliant Energy outperformed Exelon with a higher overall price increase, maintaining stronger volatility and buyer interest despite recent corrections.
Target Prices
Analysts present a clear bullish consensus on target prices for Exelon Corporation and Alliant Energy Corporation.
| Company | Target High | Target Low | Consensus |
|---|---|---|---|
| Exelon Corporation | 57 | 39 | 50.86 |
| Alliant Energy Corporation | 78 | 65 | 73 |
The consensus targets for both utilities exceed their current prices, indicating analysts expect moderate to strong upside potential, with Alliant Energy showing a notably higher target relative to its price.
Analyst Opinions Comparison
This section compares analysts’ ratings and grades for Exelon Corporation and Alliant Energy Corporation:
Rating Comparison
EXC Rating
- Rating: B, classified as Very Favorable by analysts.
- Discounted Cash Flow Score: Moderate score of 3, indicating average valuation based on cash flows.
- ROE Score: Moderate score of 3, reflecting average efficiency in generating profit from equity.
- ROA Score: Moderate score of 3, showing balanced asset utilization.
- Debt To Equity Score: Moderate score of 2, denoting moderate financial risk.
- Overall Score: Moderate score of 3, summarizing overall financial health as average.
LNT Rating
- Rating: C+, also considered Very Favorable by analysts.
- Discounted Cash Flow Score: Moderate score of 3, suggesting similar valuation to EXC.
- ROE Score: Very Unfavorable score of 1, indicating weak profit generation from shareholders’ equity.
- ROA Score: Favorable score of 4, signaling strong effectiveness in using assets to generate earnings.
- Debt To Equity Score: Very Unfavorable score of 1, implying higher financial risk due to debt.
- Overall Score: Moderate score of 2, reflecting a somewhat weaker overall financial position.
Which one is the best rated?
Exelon (EXC) holds a higher overall rating of B compared to Alliant Energy’s (LNT) C+, with stronger scores in ROE and debt management. Although LNT has a favorable ROA score, EXC’s balanced metrics result in a better overall financial rating.
Scores Comparison
Here is a comparison of the financial scores for Exelon Corporation and Alliant Energy Corporation:
EXC Scores
- Altman Z-Score: 0.78, indicating financial distress and a high bankruptcy risk.
- Piotroski Score: 5, reflecting an average financial strength.
LNT Scores
- Altman Z-Score: Unavailable, no data provided.
- Piotroski Score: 5, reflecting an average financial strength.
Which company has the best scores?
Exelon has a disclosed Altman Z-Score indicating financial distress, while Alliant Energy’s Altman Z-Score is unavailable. Both have the same average Piotroski Score of 5, so based solely on provided data, neither shows superior overall financial scores.
Grades Comparison
Here is a comparison of the recent grades assigned to Exelon Corporation and Alliant Energy Corporation by reputable grading firms:
Exelon Corporation Grades
The following table shows the latest grades from major financial institutions for Exelon Corporation:
| Grading Company | Action | New Grade | Date |
|---|---|---|---|
| UBS | Maintain | Neutral | 2025-12-17 |
| JP Morgan | Maintain | Neutral | 2025-12-12 |
| Morgan Stanley | Maintain | Equal Weight | 2025-10-22 |
| Keybanc | Maintain | Underweight | 2025-10-15 |
| Jefferies | Maintain | Buy | 2025-10-15 |
| Barclays | Maintain | Overweight | 2025-10-14 |
| UBS | Maintain | Neutral | 2025-10-10 |
| Morgan Stanley | Maintain | Equal Weight | 2025-09-25 |
| Keybanc | Maintain | Underweight | 2025-07-16 |
| UBS | Maintain | Neutral | 2025-07-11 |
Exelon’s grades mostly reflect a neutral to cautious stance, with several firms maintaining their existing ratings, ranging from Underweight to Buy, indicating a balanced market view overall.
Alliant Energy Corporation Grades
The following table details the most recent ratings for Alliant Energy Corporation from well-known grading firms:
| Grading Company | Action | New Grade | Date |
|---|---|---|---|
| Argus Research | Downgrade | Hold | 2026-01-09 |
| UBS | Maintain | Buy | 2025-12-17 |
| UBS | Upgrade | Buy | 2025-10-24 |
| B of A Securities | Maintain | Buy | 2025-10-17 |
| BMO Capital | Maintain | Market Perform | 2025-10-17 |
| Barclays | Maintain | Underweight | 2025-10-14 |
| UBS | Maintain | Neutral | 2025-10-10 |
| B of A Securities | Maintain | Buy | 2025-08-14 |
| BMO Capital | Maintain | Market Perform | 2025-08-11 |
| UBS | Maintain | Neutral | 2025-07-11 |
Alliant Energy exhibits a generally positive consensus, with multiple Buy ratings and some Market Perform, despite a recent downgrade by Argus Research to Hold.
Which company has the best grades?
Alliant Energy Corporation has received stronger overall grades with a consensus Buy rating and multiple Buy recommendations, while Exelon Corporation’s consensus remains Hold with mostly neutral to mixed grades. This difference could influence investors seeking more optimistic analyst sentiment.
Strengths and Weaknesses
Below is a comparative overview of the key strengths and weaknesses of Exelon Corporation (EXC) and Alliant Energy Corporation (LNT) based on recent financial and operational data.
| Criterion | Exelon Corporation (EXC) | Alliant Energy Corporation (LNT) |
|---|---|---|
| Diversification | Highly diversified across multiple regulated utilities segments including electric and gas services with revenues exceeding $32B in recent years. | Primarily focused on electric and gas utilities, with less segment diversification and about $3.8B in revenue. |
| Profitability | Moderate net margin of 10.68%, but ROIC below WACC indicating value destruction; profitability is improving though. | Higher net margin at 17.33%, but ROIC also below WACC, showing stable but unfavorable value creation. |
| Innovation | Incremental ROIC growth suggests improving operational efficiency and potential innovation in energy management. | Neutral ROIC trend indicates limited recent innovation impact on returns. |
| Global presence | Primarily a U.S.-based utility with strong regional presence in several states but limited global footprint. | Regional U.S. utility focus with no significant global operations. |
| Market Share | Large market share in several key U.S. utility markets, supported by multiple subsidiaries. | Smaller market share concentrated mostly in the Midwest U.S. utility market. |
Key takeaways: Exelon offers greater diversification and improving profitability trends but faces challenges with value creation efficiency. Alliant Energy shows stronger current profitability margins but lacks diversification and innovation momentum, both companies currently shed value relative to their capital costs.
Risk Analysis
Below is a summary table highlighting key risks for Exelon Corporation (EXC) and Alliant Energy Corporation (LNT) based on their latest financial and operational data for 2024.
| Metric | Exelon Corporation (EXC) | Alliant Energy Corporation (LNT) |
|---|---|---|
| Market Risk | Moderate (Beta 0.56) | Moderate (Beta 0.67) |
| Debt level | High (Debt/Equity 1.73; Debt to Assets 43%) | High (Debt/Equity 1.49; Debt to Assets 46%) |
| Regulatory Risk | Elevated (Utility sector heavily regulated) | Elevated (Utility sector heavily regulated) |
| Operational Risk | Moderate (Asset turnover low at 0.21) | Moderate (Asset turnover low at 0.18) |
| Environmental Risk | Medium (Nuclear & fossil exposure) | Medium (Natural gas & wind exposure) |
| Geopolitical Risk | Low (US-focused operations) | Low (US-focused operations) |
Exelon and Alliant Energy both face significant debt-related risks and regulatory scrutiny inherent to the utility sector. Exelon’s exposure to nuclear and fossil fuels poses environmental and operational risks, while Alliant’s reliance on natural gas and wind generation introduces variability. Both companies show moderate market risk with relatively low beta values, indicating less price volatility. Exelon’s Altman Z-Score signals financial distress risk, warranting caution despite average Piotroski scores. Investors should weigh regulatory and environmental factors carefully.
Which Stock to Choose?
Exelon Corporation (EXC) shows a generally favorable income statement with a 10.68% net margin and 25.32% net income growth over 2020-2024. However, its financial ratios present a slightly unfavorable picture with a 9.14% ROE and high net debt to EBITDA of 5.66. The company is shedding value as ROIC remains below WACC, though ROIC is growing, and it holds a very favorable “B” rating overall.
Alliant Energy Corporation (LNT) displays a stronger net margin at 17.33%, but its income growth is mixed, with a 16.54% revenue increase but unfavorable net margin decline over the period. Its financial ratios also appear slightly unfavorable, with a 9.85% ROE and net debt to EBITDA at 5.75. The firm is shedding value with a stable ROIC below WACC, and it holds a very favorable “C+” rating.
For investors prioritizing income statement strength and growth, Exelon might appear more favorable due to its improving profitability and growing ROIC. Conversely, those focused on higher net margins and stable profitability might find Alliant Energy more aligned with their profile, despite its value destruction indication. Both companies show slightly unfavorable financial ratios, suggesting cautious interpretation.
Disclaimer: Investment carries a risk of loss of initial capital. The past performance is not a reliable indicator of future results. Be sure to understand risks before making an investment decision.
Go Further
I encourage you to read the complete analyses of Exelon Corporation and Alliant Energy Corporation to enhance your investment decisions: