In the competitive landscape of regulated electric utilities, Eversource Energy and Alliant Energy Corporation stand out as key players shaping the future of energy delivery. Both companies operate extensive electricity and natural gas networks, serving millions across multiple states while advancing innovation in sustainable energy solutions. This article will analyze their market positions, growth strategies, and financial health to help you decide which utility stock deserves a place in your investment portfolio.
Table of contents
Companies Overview
I will begin the comparison between Eversource Energy and Alliant Energy Corporation by providing an overview of these two companies and their main differences.
Eversource Energy Overview
Eversource Energy is a public utility holding company focused on energy delivery across Connecticut, Massachusetts, and New Hampshire. It operates through segments including Electric Distribution, Electric Transmission, Natural Gas Distribution, and Water Distribution. The company serves a broad customer base, including residential, commercial, industrial, and municipal sectors, with a workforce of 10,000 employees.
Alliant Energy Corporation Overview
Alliant Energy Corporation is a utility holding company providing regulated electricity and natural gas services primarily in Iowa and Wisconsin. It operates through Utility Electric Operations, Utility Gas Operations, and Utility Other segments. Serving around 1.4M retail customers, it also owns freight and transport assets, and holds interests in natural gas and wind power generation, with approximately 3,000 employees.
Key similarities and differences
Both companies operate in the regulated electric utility sector and provide electricity and natural gas services. Eversource focuses on northeastern states while Alliant Energy serves the Midwest, with a stronger emphasis on diversified operations including freight services. Eversource has a larger workforce and market cap of 25B vs. Alliant’s 16.7B, reflecting different geographic scales and operational breadth.
Income Statement Comparison
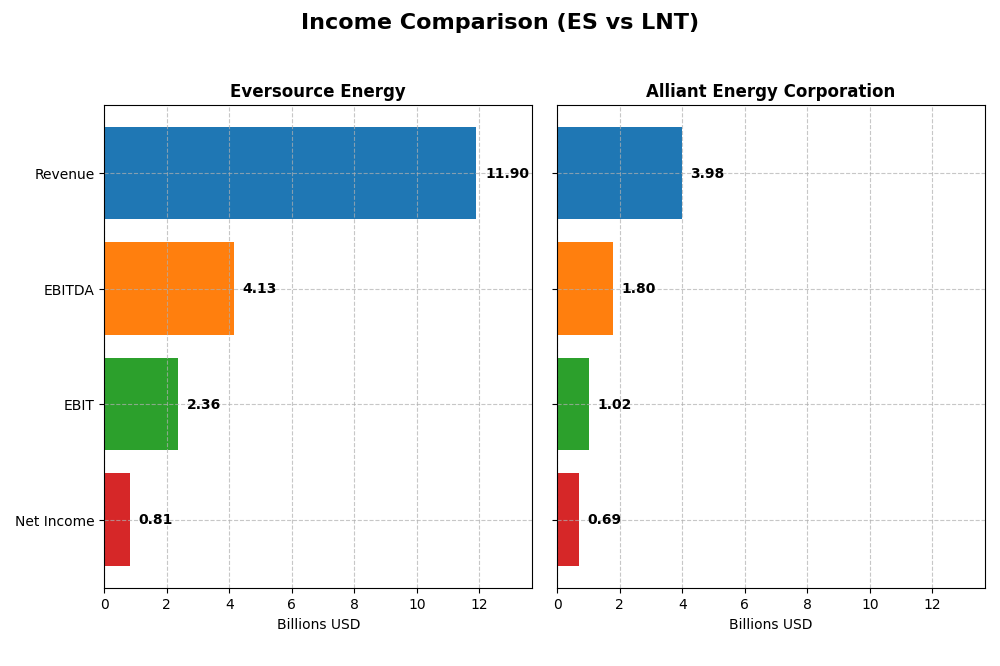
This table compares the key income statement metrics of Eversource Energy and Alliant Energy Corporation for fiscal year 2024.
| Metric | Eversource Energy (ES) | Alliant Energy Corporation (LNT) |
|---|---|---|
| Market Cap | 24.99B | 16.71B |
| Revenue | 11.90B | 3.98B |
| EBITDA | 4.13B | 1.80B |
| EBIT | 2.36B | 1.03B |
| Net Income | 812M | 690M |
| EPS | 2.27 | 2.69 |
| Fiscal Year | 2024 | 2024 |
Income Statement Interpretations
Eversource Energy
Eversource Energy’s revenue showed a positive overall growth of 33.65% from 2020 to 2024, but net income declined by 32.65% over the same period. Margins reflect favorable gross (31.12%) and EBIT (19.79%) margins, despite a net margin decrease to 6.82%. The 2024 fiscal year saw revenue nearly flat (-0.08%), but EBIT and net margin surged significantly, indicating improved profitability.
Alliant Energy Corporation
Alliant Energy’s revenue increased 16.54% overall from 2020 to 2024, alongside 10.58% net income growth. The company maintains strong gross (44.71%) and EBIT (25.75%) margins, with a solid net margin of 17.33%. However, the latest year showed declines in revenue (-1.14%), EBIT (-6.9%), and net margin (-0.72%), signaling some recent margin pressure.
Which one has the stronger fundamentals?
Eversource Energy exhibits a favorable overall income statement profile with robust margin improvements and strong profitability rebound in 2024, despite historical net income declines. Alliant Energy maintains higher margins but faced unfavorable recent growth trends and margin contractions. Eversource’s stronger recent operational gains contrast with Alliant’s steadier but weakening performance.
Financial Ratios Comparison
This table compares key financial ratios for Eversource Energy (ES) and Alliant Energy Corporation (LNT) based on their most recent fiscal year data for 2024.
| Ratios | Eversource Energy (ES) | Alliant Energy Corporation (LNT) |
|---|---|---|
| ROE | 5.40% | 9.85% |
| ROIC | 3.18% | 4.88% |
| P/E | 25.29 | 21.98 |
| P/B | 1.37 | 2.17 |
| Current Ratio | 0.76 | 0.44 |
| Quick Ratio | 0.67 | 0.33 |
| D/E (Debt-to-Equity) | 1.94 | 1.49 |
| Debt-to-Assets | 48.9% | 45.8% |
| Interest Coverage | 2.43 | 1.97 |
| Asset Turnover | 0.20 | 0.18 |
| Fixed Asset Turnover | 0.29 | 0.21 |
| Payout ratio | 124% | 71% |
| Dividend yield | 4.91% | 3.24% |
Interpretation of the Ratios
Eversource Energy
Eversource Energy shows a mixed ratio profile with a neutral net margin of 6.82% but unfavorable returns on equity (5.4%) and invested capital (3.18%). The company’s liquidity ratios and asset turnover are weak, while its dividend yield is attractive at 4.91%. Dividend payments appear supported, but caution is warranted due to some unfavorable leverage and efficiency metrics.
Alliant Energy Corporation
Alliant Energy Corporation presents stronger profitability with a favorable net margin at 17.33%, though its return on equity (9.85%) and return on invested capital (4.88%) remain unfavorable. Liquidity ratios are low, and asset turnover is weak, similar to its peer. The dividend yield is solid at 3.24%, reflecting consistent shareholder returns despite some financial headwinds.
Which one has the best ratios?
Comparing both, Alliant Energy maintains a slightly more favorable overall ratio profile with a higher net margin and a less unfavorable global evaluation than Eversource Energy. However, both companies face challenges in liquidity and asset efficiency, with dividend yields supporting shareholder returns, making neither distinctly superior but each with specific strengths and weaknesses.
Strategic Positioning
This section compares the strategic positioning of Eversource Energy and Alliant Energy Corporation, including market position, key segments, and exposure to technological disruption:
Eversource Energy
- Larger market cap with NYSE listing, facing regulated electric sector competition.
- Diverse segments: electric distribution, transmission, natural gas, water distribution.
- Exposure includes solar power facilities and regulated water utilities.
Alliant Energy Corporation
- Smaller market cap, NASDAQ-listed, operating in regulated electric sector.
- Focused on electric and gas utility operations with some freight services.
- Exposure includes natural gas, wind farm, and natural gas-fired generation.
Eversource Energy vs Alliant Energy Corporation Positioning
Eversource has a diversified utility portfolio across electric, gas, and water segments, while Alliant focuses more on electric and gas with additional freight operations. Eversource’s broader segment base contrasts with Alliant’s more concentrated regional utility services.
Which has the best competitive advantage?
Both companies show unfavorable MOAT evaluations, with Eversource’s declining ROIC indicating value destruction, while Alliant maintains a stable but still value-shedding profitability, suggesting neither holds a strong competitive advantage currently.
Stock Comparison
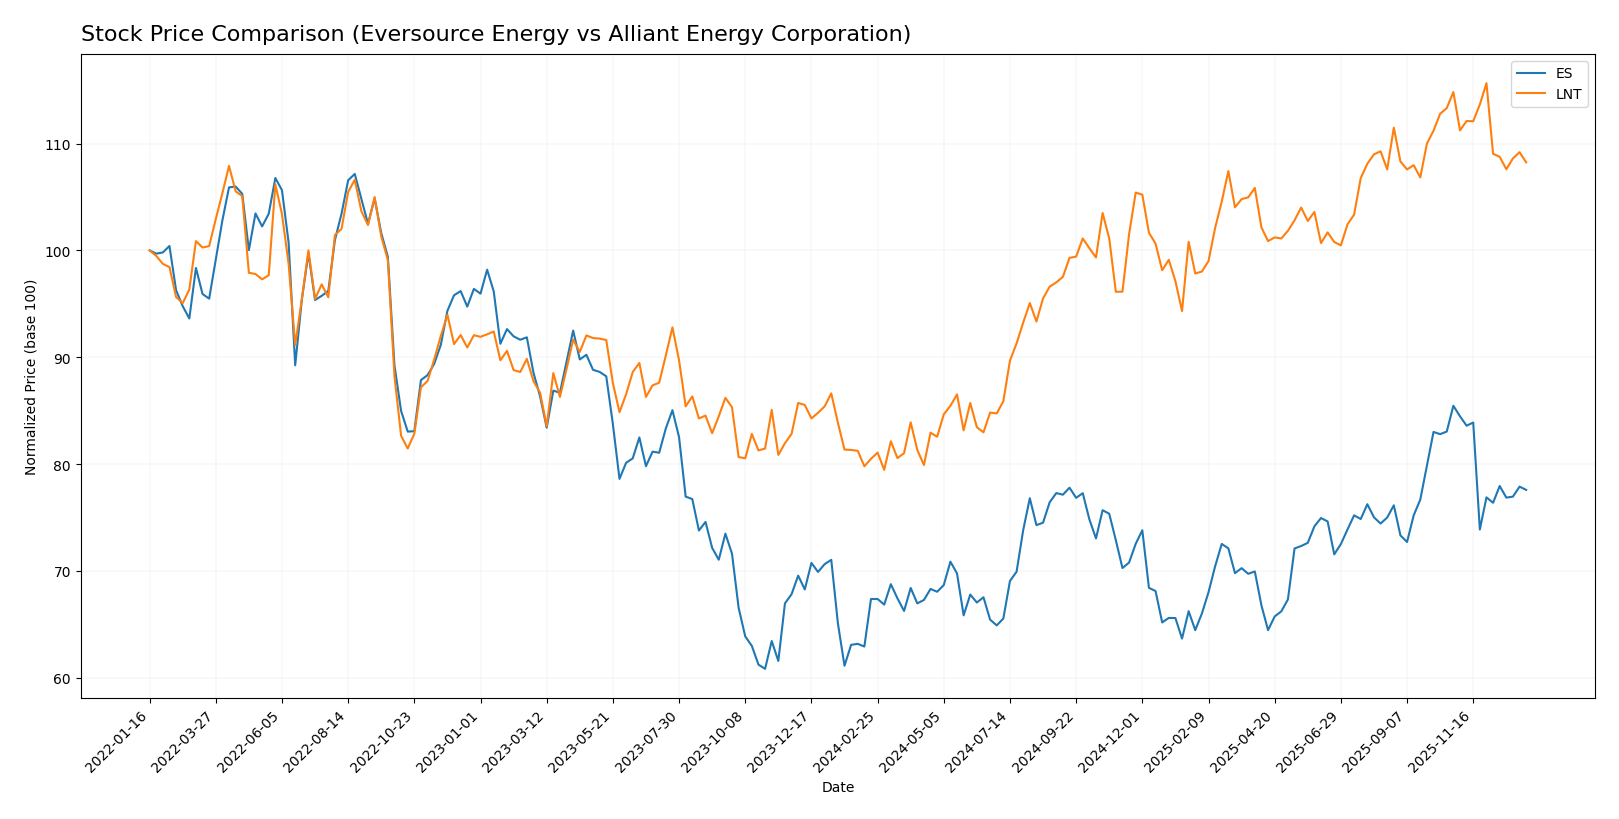
The past year reveals notable bullish trends for both Eversource Energy and Alliant Energy Corporation, with Alliant demonstrating a stronger overall price appreciation despite recent downward momentum in both stocks.
Trend Analysis
Eversource Energy’s stock gained 15.15% over the last 12 months, indicating a bullish trend with decelerating momentum; the price fluctuated between 55.63 and 74.67, showing moderate volatility (4.5 std deviation).
Alliant Energy Corporation’s stock rose by 34.48% in the same period, also bullish with deceleration in trend acceleration; its price ranged from 47.73 to 69.47, experiencing higher volatility (5.9 std deviation).
Comparing the two, Alliant Energy delivered the highest market performance over the past year, outperforming Eversource Energy by a significant margin in price appreciation.
Target Prices
The consensus target prices for Eversource Energy and Alliant Energy Corporation indicate moderate upside potential.
| Company | Target High | Target Low | Consensus |
|---|---|---|---|
| Eversource Energy | 81 | 60 | 68 |
| Alliant Energy Corporation | 78 | 65 | 73 |
Analysts expect Eversource Energy’s price to rise slightly above its current $67.79, while Alliant Energy’s consensus target at $73 suggests a moderate gain from its current $65.02.
Analyst Opinions Comparison
This section compares analysts’ ratings and grades for Eversource Energy and Alliant Energy Corporation:
Rating Comparison
Eversource Energy Rating
- Rating: C+, assessed as Very Favorable by analysts.
- Discounted Cash Flow Score: 1, indicating Very Unfavorable.
- ROE Score: 3, suggesting Moderate performance on equity use.
- ROA Score: 3, reflecting Moderate asset utilization.
- Debt To Equity Score: 1, rated Very Unfavorable risk level.
- Overall Score: 2, classified as Moderate by analysts.
Alliant Energy Corporation Rating
- Rating: C+, also assessed as Very Favorable by analysts.
- Discounted Cash Flow Score: 3, indicating Moderate favorability.
- ROE Score: 1, showing Very Unfavorable efficiency.
- ROA Score: 4, indicating a Favorable use of assets.
- Debt To Equity Score: 1, also Very Unfavorable financial risk.
- Overall Score: 2, classified as Moderate by analysts.
Which one is the best rated?
Both companies share the same overall rating of C+ and overall score of 2, categorized as Moderate. Eversource scores better on ROE, while Alliant excels in ROA and discounted cash flow. Both have equally unfavorable debt-to-equity scores.
Scores Comparison
Here is a comparison of the Altman Z-Score and Piotroski Score for Eversource Energy and Alliant Energy Corporation:
Eversource Energy Scores
- Altman Z-Score: 0.75, in distress zone indicating high bankruptcy risk
- Piotroski Score: 6, rated average financial strength
Alliant Energy Corporation Scores
- Altman Z-Score: Unavailable, no data provided
- Piotroski Score: 5, also rated average financial strength
Which company has the best scores?
Eversource Energy has a clearly defined Altman Z-Score in the distress zone, while Alliant Energy’s score is unavailable. Both have average Piotroski Scores, with Eversource slightly higher at 6 versus 5 for Alliant.
Grades Comparison
Here is a comparison of the recent grades and ratings for Eversource Energy and Alliant Energy Corporation:
Eversource Energy Grades
The following table summarizes recent grades assigned by major financial institutions for Eversource Energy:
| Grading Company | Action | New Grade | Date |
|---|---|---|---|
| UBS | Maintain | Neutral | 2025-12-17 |
| JP Morgan | Maintain | Underweight | 2025-12-12 |
| Janney Montgomery Scott | Upgrade | Buy | 2025-11-24 |
| Scotiabank | Maintain | Sector Underperform | 2025-11-20 |
| Mizuho | Downgrade | Neutral | 2025-11-20 |
| Wells Fargo | Downgrade | Equal Weight | 2025-11-20 |
| UBS | Downgrade | Neutral | 2025-11-06 |
| BMO Capital | Maintain | Market Perform | 2025-11-06 |
| Scotiabank | Maintain | Sector Underperform | 2025-11-06 |
| Mizuho | Maintain | Outperform | 2025-10-27 |
Overall, Eversource Energy’s grades show a mixed pattern with multiple downgrades to neutral or underweight and some stability at market perform or sector underperform levels.
Alliant Energy Corporation Grades
The following table presents recent grades for Alliant Energy Corporation:
| Grading Company | Action | New Grade | Date |
|---|---|---|---|
| Argus Research | Downgrade | Hold | 2026-01-09 |
| UBS | Maintain | Buy | 2025-12-17 |
| UBS | Upgrade | Buy | 2025-10-24 |
| B of A Securities | Maintain | Buy | 2025-10-17 |
| BMO Capital | Maintain | Market Perform | 2025-10-17 |
| Barclays | Maintain | Underweight | 2025-10-14 |
| UBS | Maintain | Neutral | 2025-10-10 |
| B of A Securities | Maintain | Buy | 2025-08-14 |
| BMO Capital | Maintain | Market Perform | 2025-08-11 |
| UBS | Maintain | Neutral | 2025-07-11 |
Overall, Alliant Energy’s grades predominantly range from buy to market perform, with a slight recent downgrade to hold but maintaining a generally positive outlook.
Which company has the best grades?
Alliant Energy Corporation has received generally better grades, with more buy ratings and fewer downgrades compared to Eversource Energy. This suggests a more favorable perception among analysts, which could influence investor sentiment and portfolio decisions.
Strengths and Weaknesses
Here is a comparative overview of key strengths and weaknesses for Eversource Energy (ES) and Alliant Energy Corporation (LNT) based on their recent financial and operational data.
| Criterion | Eversource Energy (ES) | Alliant Energy Corporation (LNT) |
|---|---|---|
| Diversification | Highly diversified with strong electric distribution ($9.07B) and transmission, plus natural gas and water segments | Moderate diversification, mainly electric ($3.37B) and gas segments with smaller other utilities |
| Profitability | Neutral net margin (6.82%), low ROE (5.4%), ROIC below WACC indicating value destruction | Favorable net margin (17.33%), but ROE and ROIC below WACC, showing marginal value loss |
| Innovation | Limited data on innovation, but declining ROIC suggests challenges in capital efficiency | Stable ROIC trend with slight improvement, but no clear innovation edge |
| Global presence | Primarily regional U.S. utility provider with steady core markets | Regional U.S. focus, smaller scale but consistent operations |
| Market Share | Large market share in electric distribution and transmission segments | Smaller market share, focused on electric and gas utilities |
Key takeaways: Eversource Energy offers significant scale and diversification but struggles with declining profitability and capital efficiency, signaling value destruction. Alliant Energy has better profit margins and stable ROIC trends but remains less diversified with a slightly unfavorable overall financial profile. Both require cautious analysis for long-term investment.
Risk Analysis
Below is a summary table of key risks for Eversource Energy (ES) and Alliant Energy Corporation (LNT) based on the most recent 2024 data:
| Metric | Eversource Energy (ES) | Alliant Energy Corporation (LNT) |
|---|---|---|
| Market Risk | Moderate (Beta 0.77, regulated utilities sector) | Moderate (Beta 0.67, regulated utilities sector) |
| Debt level | High (Debt/Equity 1.94, interest coverage 2.12) | Elevated (Debt/Equity 1.49, interest coverage 2.28) |
| Regulatory Risk | Significant (regulated electric and gas utilities in multiple states) | Significant (regulated electric and gas utilities in Midwestern US) |
| Operational Risk | Medium (complex operations in electricity, gas, water) | Medium (diverse utilities plus freight services) |
| Environmental Risk | Moderate (energy delivery with solar, natural gas exposure) | Moderate (natural gas and wind generation exposure) |
| Geopolitical Risk | Low (US-focused operations) | Low (US-focused operations) |
Eversource faces elevated financial risk due to high leverage and weak liquidity ratios, increasing vulnerability to interest rate hikes. Both companies operate in regulated environments, exposing them to policy changes. Environmental transition risks are moderate but growing with their natural gas assets. Geopolitical risks remain low given US-centric operations.
Which Stock to Choose?
Eversource Energy (ES) shows a mixed income evolution with a recent revenue decline but some favorable margins and strong EBIT growth. Its financial ratios reveal mostly unfavorable metrics, including low ROE and ROIC, high debt levels, and weak liquidity. The company’s rating is very favorable overall, though with moderate scores in key areas.
Alliant Energy Corporation (LNT) presents a steady income growth over the medium term despite slight recent revenue declines. Its financial ratios are slightly more balanced, with favorable net margin and some neutral statuses, but also some unfavorable leverage and liquidity measures. The rating is equally very favorable but with contrasting scores in profitability and valuation.
For investors, the choice might depend on risk appetite and investment style: those focused on income stability and recent profitability could find Alliant Energy somewhat more appealing, while investors valuing a stronger rating and potential turnaround might view Eversource Energy’s profile as interesting despite its challenges. Both stocks exhibit value destruction signals in MOAT evaluations, suggesting cautious interpretation of profitability sustainability.
Disclaimer: Investment carries a risk of loss of initial capital. The past performance is not a reliable indicator of future results. Be sure to understand risks before making an investment decision.
Go Further
I encourage you to read the complete analyses of Eversource Energy and Alliant Energy Corporation to enhance your investment decisions: