Investors seeking stable opportunities in the regulated electric utility sector will find Alliant Energy Corporation (LNT) and Evergy, Inc. (EVRG) compelling candidates. Both companies serve overlapping Midwestern US markets with diversified energy portfolios, including renewables, and emphasize innovation in sustainable power generation. This comparison explores their operational strengths, market positions, and growth potential to help you decide which utility stock could enhance your investment portfolio most effectively.
Table of contents
Companies Overview
I will begin the comparison between Alliant Energy Corporation and Evergy, Inc. by providing an overview of these two companies and their main differences.
Alliant Energy Corporation Overview
Alliant Energy Corporation is a utility holding company focused on regulated electricity and natural gas services. It operates through segments including Utility Electric and Gas Operations and serves retail customers primarily in Iowa and Wisconsin. The company also owns freight services and interests in natural gas and wind energy generation, positioning itself as a diversified utility provider in the US Midwest.
Evergy, Inc. Overview
Evergy, Inc. engages in the generation, transmission, distribution, and sale of electricity in Kansas and Missouri. Its electric generation portfolio includes coal, hydroelectric, natural gas, and various renewable sources like solar and wind. Serving over 1.6M customers, Evergy manages extensive transmission and distribution infrastructure, emphasizing a broad and diversified energy mix within the regulated utility sector.
Key similarities and differences
Both companies operate as regulated electric utilities in the US, focusing on electricity generation and distribution to retail customers. While Alliant Energy has a balanced focus on electricity and natural gas with additional freight services, Evergy emphasizes a larger customer base and a wider range of generation sources, including nuclear and landfill gas. Their geographic footprints differ, with Alliant Energy concentrated in the Midwest and Evergy primarily in Kansas and Missouri.
Income Statement Comparison
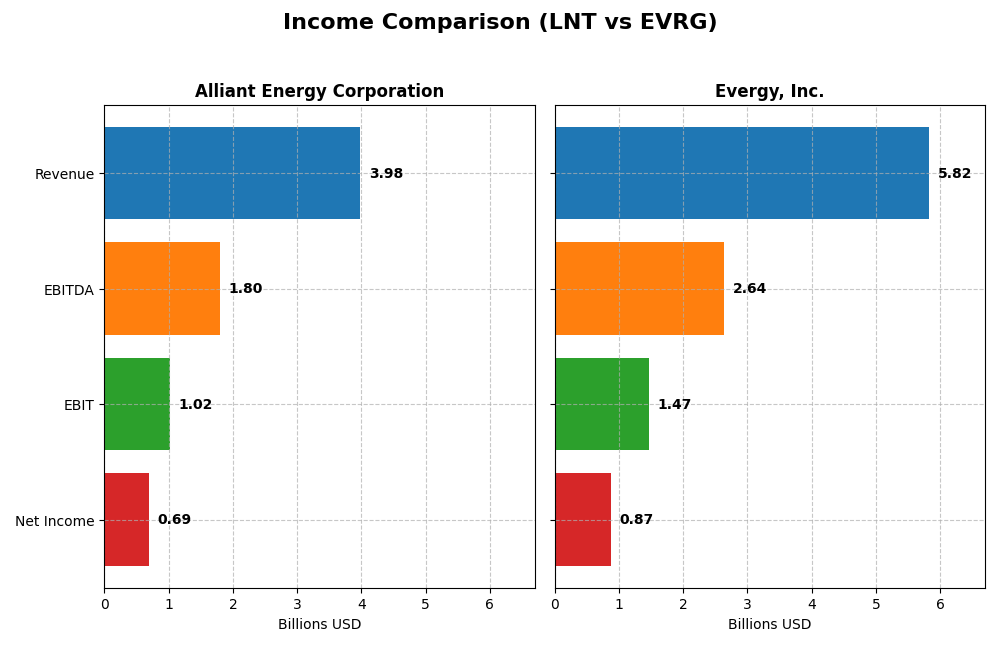
This table provides a side-by-side comparison of the key income statement metrics for Alliant Energy Corporation and Evergy, Inc. for the fiscal year 2024.
| Metric | Alliant Energy Corporation | Evergy, Inc. |
|---|---|---|
| Market Cap | 16.7B | 16.8B |
| Revenue | 3.98B | 5.82B |
| EBITDA | 1.80B | 2.64B |
| EBIT | 1.03B | 1.47B |
| Net Income | 690M | 874M |
| EPS | 2.69 | 3.79 |
| Fiscal Year | 2024 | 2024 |
Income Statement Interpretations
Alliant Energy Corporation
Over 2020-2024, Alliant Energy’s revenue grew by 16.54%, with net income up 10.58%, yet the latest year saw a 1.14% revenue decline and a 6.9% drop in EBIT. Gross margin remained stable around 44.7%, but net margin decreased slightly to 17.33%. The 2024 performance shows slowing growth and margin pressure despite solid historical gains.
Evergy, Inc.
Evergy posted an 18.53% revenue increase and a strong 41.27% net income growth over five years, with 2024 revenue rising 6.17% and EBIT up 15.15%. Gross margin improved to 32.57%, and net margin rose to 15.0%. The recent year’s results reflect accelerating profitability and expanding margins, signaling positive momentum in earnings quality.
Which one has the stronger fundamentals?
Evergy exhibits stronger fundamentals due to consistently favorable margin expansions, robust net income and EPS growth, and a positive income statement outlook. In contrast, Alliant Energy shows mixed results with some unfavorable margin trends and recent declines in revenue and EBIT. Evergy’s higher proportion of favorable income metrics suggests superior earnings strength over the period.
Financial Ratios Comparison
This table presents a side-by-side comparison of key financial ratios for Alliant Energy Corporation (LNT) and Evergy, Inc. (EVRG) based on their latest fiscal year data ending 2024.
| Ratios | Alliant Energy Corporation (LNT) | Evergy, Inc. (EVRG) |
|---|---|---|
| ROE | 9.85% | 8.77% |
| ROIC | 4.88% | 4.52% |
| P/E | 21.98 | 16.23 |
| P/B | 2.17 | 1.42 |
| Current Ratio | 0.44 | 0.50 |
| Quick Ratio | 0.33 | 0.27 |
| D/E (Debt to Equity) | 1.49 | 1.41 |
| Debt-to-Assets | 45.8% | 43.6% |
| Interest Coverage | 1.97 | 2.57 |
| Asset Turnover | 0.18 | 0.18 |
| Fixed Asset Turnover | 0.21 | 0.23 |
| Payout Ratio | 71.3% | 68.3% |
| Dividend Yield | 3.24% | 4.21% |
Interpretation of the Ratios
Alliant Energy Corporation
Alliant Energy shows strong net margin and dividend yield, indicating profitable operations and attractive shareholder returns. However, its return on equity and invested capital are weak, along with low liquidity ratios and asset turnover, which may raise concerns about efficiency and financial stability. The company pays dividends with a 3.24% yield, but coverage by free cash flow is negative, suggesting caution regarding sustainability.
Evergy, Inc.
Evergy reports favorable net margin, price-to-book ratio, and dividend yield, reflecting solid profitability and shareholder value. Still, its returns on equity and invested capital are underwhelming, and liquidity remains weak. The dividend yield stands at 4.21%, supported by share buybacks, yet free cash flow coverage appears insufficient, highlighting potential risks in distribution sustainability.
Which one has the best ratios?
Both companies face similar challenges, with half of their key ratios marked unfavorable, particularly in return metrics and liquidity. Evergy exhibits slightly better dividend yield and price-to-book ratio, while Alliant Energy benefits from superior net margin. Overall, their ratios are comparably slightly unfavorable, reflecting moderate financial caution for investors.
Strategic Positioning
This section compares the strategic positioning of Alliant Energy Corporation and Evergy, Inc., including Market position, Key segments, and exposure to technological disruption:
Alliant Energy Corporation
- Operates as a regional utility with retail and wholesale customers in Iowa, Wisconsin, and nearby states; faces regulated electric industry pressures.
- Key segments include Utility Electric Operations, Gas Operations, and Other Utility services; business driven by retail electricity and natural gas distribution.
- Owns and operates natural gas-fired unit and wind farm; no explicit mention of disruption strategies or emerging tech focus.
Evergy, Inc.
- Operates primarily in Kansas and Missouri with a large customer base; competes in regulated electric utility market.
- Focuses on electricity generation, transmission, and distribution with diverse energy sources including renewables and fossil fuels.
- Generates electricity using coal, hydro, landfill gas, uranium, natural gas, solar, and wind; diversified energy mix may mitigate disruption.
Alliant Energy Corporation vs Evergy, Inc. Positioning
Alliant Energy has a more concentrated regional focus with diversified utility segments including electric and gas operations, while Evergy operates a broader geographic footprint with a diversified energy generation mix. Alliant’s smaller scale and limited generation diversity contrast with Evergy’s extensive transmission network and renewable sources.
Which has the best competitive advantage?
Both companies are currently value destroyers as ROIC is below WACC. Evergy shows a growing ROIC trend, suggesting improving profitability, while Alliant’s ROIC trend is neutral, indicating less favorable value creation prospects despite steady operations.
Stock Comparison
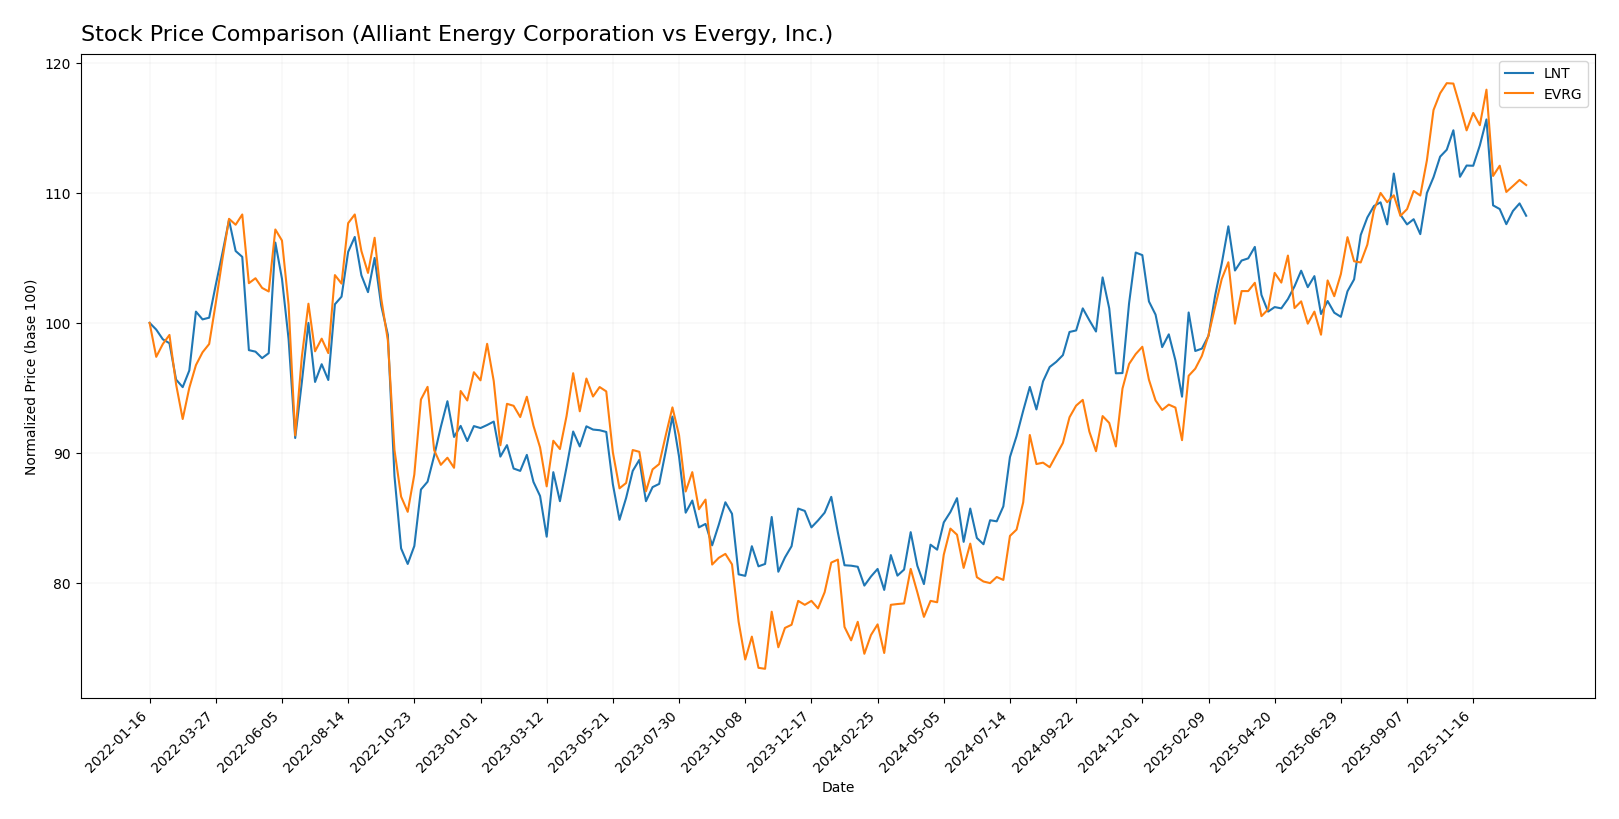
The stock prices of Alliant Energy Corporation and Evergy, Inc. have shown strong bullish trends over the past 12 months, with both companies experiencing deceleration in upward momentum and recent short-term declines in price.
Trend Analysis
Alliant Energy Corporation’s stock rose 34.48% over the past year, indicating a bullish trend with decelerating momentum. The price fluctuated between 47.73 and 69.47, with recent weeks showing a mild decline of 5.73%.
Evergy, Inc. recorded a 45.55% price increase over the last 12 months, also a bullish trend with deceleration. Its price ranged from 49.12 to 77.98, but recent performance declined by 6.59%, reflecting increased seller dominance.
Comparing the two, Evergy delivered the highest market performance over the year, outperforming Alliant Energy despite both showing recent short-term bearish corrections.
Target Prices
Analysts present a clear target price consensus for Alliant Energy Corporation and Evergy, Inc., indicating potential upside.
| Company | Target High | Target Low | Consensus |
|---|---|---|---|
| Alliant Energy Corporation | 78 | 65 | 73 |
| Evergy, Inc. | 93 | 76 | 82.67 |
The consensus target prices suggest moderate upside potential for both stocks compared to current prices: Alliant Energy trades near 65.02 USD versus a 73 USD consensus, and Evergy trades near 72.82 USD versus an 82.67 USD consensus. Analysts expect steady growth in these regulated electric utilities.
Analyst Opinions Comparison
This section compares analysts’ ratings and grades for Alliant Energy Corporation and Evergy, Inc.:
Rating Comparison
Alliant Energy Corporation Rating
- Rating: C+, evaluated as Very Favorable
- Discounted Cash Flow Score: 3, considered Moderate
- ROE Score: 1, considered Very Unfavorable
- ROA Score: 4, considered Favorable
- Debt To Equity Score: 1, considered Very Unfavorable
- Overall Score: 2, considered Moderate
Evergy, Inc. Rating
- Rating: B-, evaluated as Very Favorable
- Discounted Cash Flow Score: 1, considered Very Unfavorable
- ROE Score: 3, considered Moderate
- ROA Score: 3, considered Moderate
- Debt To Equity Score: 2, considered Moderate
- Overall Score: 2, considered Moderate
Which one is the best rated?
Based strictly on the provided data, Evergy holds a higher rating of B- compared to Alliant Energy’s C+. While both have equal Overall Scores, Evergy scores moderately in ROE, ROA, and Debt-to-Equity, unlike Alliant which has mixed favorable and very unfavorable scores.
Scores Comparison
Here is a comparison of the Altman Z-Score and Piotroski Score for Alliant Energy Corporation and Evergy, Inc.:
LNT Scores
- Altman Z-Score: Unavailable for Alliant Energy.
- Piotroski Score: 5, indicating average financial strength.
EVRG Scores
- Altman Z-Score: 0.82, in the distress zone indicating high bankruptcy risk.
- Piotroski Score: 5, indicating average financial strength.
Which company has the best scores?
Evergy has a reported Altman Z-Score of 0.82, placing it in the distress zone, while Alliant Energy’s score is unavailable. Both companies have an identical Piotroski Score of 5, reflecting average financial health.
Grades Comparison
Here is a comparison of the recent grades assigned to Alliant Energy Corporation and Evergy, Inc.:
Alliant Energy Corporation Grades
The following table summarizes recent grades from recognized grading companies for Alliant Energy Corporation:
| Grading Company | Action | New Grade | Date |
|---|---|---|---|
| Argus Research | Downgrade | Hold | 2026-01-09 |
| UBS | Maintain | Buy | 2025-12-17 |
| UBS | Upgrade | Buy | 2025-10-24 |
| B of A Securities | Maintain | Buy | 2025-10-17 |
| BMO Capital | Maintain | Market Perform | 2025-10-17 |
| Barclays | Maintain | Underweight | 2025-10-14 |
| UBS | Maintain | Neutral | 2025-10-10 |
| B of A Securities | Maintain | Buy | 2025-08-14 |
| BMO Capital | Maintain | Market Perform | 2025-08-11 |
| UBS | Maintain | Neutral | 2025-07-11 |
Overall, Alliant Energy’s grades show a mix of Buy and Hold recommendations, with some Market Perform and Underweight ratings, indicating a generally cautious outlook.
Evergy, Inc. Grades
The following table summarizes recent grades from recognized grading companies for Evergy, Inc.:
| Grading Company | Action | New Grade | Date |
|---|---|---|---|
| Mizuho | Downgrade | Neutral | 2025-12-18 |
| UBS | Maintain | Buy | 2025-12-17 |
| Citigroup | Maintain | Buy | 2025-11-10 |
| Jefferies | Maintain | Buy | 2025-10-09 |
| Mizuho | Maintain | Outperform | 2025-08-08 |
| Mizuho | Maintain | Outperform | 2025-07-18 |
| Barclays | Maintain | Overweight | 2025-05-30 |
| Citigroup | Maintain | Buy | 2025-05-16 |
| UBS | Upgrade | Buy | 2025-04-28 |
| Barclays | Maintain | Overweight | 2025-04-22 |
Evergy’s ratings are predominantly Buy and Outperform, with some Overweight designations, reflecting a generally favorable analyst sentiment.
Which company has the best grades?
Evergy, Inc. has received more consistently positive grades, including multiple Outperform and Overweight ratings, compared to Alliant Energy’s more mixed Buy and Hold grades. This may signal stronger analyst confidence in Evergy’s prospects, which could influence investor perceptions of growth potential and risk.
Strengths and Weaknesses
Below is a comparative overview of key strengths and weaknesses of Alliant Energy Corporation (LNT) and Evergy, Inc. (EVRG) based on the most recent financial and operational data.
| Criterion | Alliant Energy Corporation (LNT) | Evergy, Inc. (EVRG) |
|---|---|---|
| Diversification | Moderate diversification with Electric ($3.37B), Gas ($465M), and Other Utility segments | Primarily focused on Electric Utility segment ($2.71B) |
| Profitability | Net margin 17.33% (favorable); ROIC 4.88% (unfavorable, below WACC) | Net margin 15.0% (favorable); ROIC 4.52% (unfavorable, below WACC) |
| Innovation | Neutral; stable but destroying value with unfavorable moat rating | Growing ROIC trend indicates improving innovation and profitability |
| Global presence | Regional US utility with limited global footprint | Similar regional focus; no significant global presence |
| Market Share | Solid in regional markets with steady electric revenue growth | Strong regional market presence with steady electric utility revenue |
Key takeaways: Both companies operate mainly in regional electric utilities with similar market focus. Alliant Energy shows slightly better profitability margins but struggles with value creation, while Evergy is improving its return on invested capital despite current value destruction. Investors should weigh steady cash flows against modest growth prospects and cautious profitability trends.
Risk Analysis
The table below summarizes the key risks associated with Alliant Energy Corporation (LNT) and Evergy, Inc. (EVRG) based on the latest financial and operational data for 2024.
| Metric | Alliant Energy Corporation (LNT) | Evergy, Inc. (EVRG) |
|---|---|---|
| Market Risk | Moderate (Beta 0.671) | Moderate (Beta 0.646) |
| Debt level | High (Debt/Equity 1.49, Neutral debt-to-assets 45.81%) | High (Debt/Equity 1.41, Neutral debt-to-assets 43.58%) |
| Regulatory Risk | Elevated (Utility sector exposure) | Elevated (Utility sector exposure) |
| Operational Risk | Moderate (Asset turnover low) | Moderate (Asset turnover low) |
| Environmental Risk | Medium (Coal and natural gas exposure, wind assets) | Medium (Diverse generation including coal, natural gas, renewables) |
| Geopolitical Risk | Low (US-focused operations) | Low (US-focused operations) |
Both companies face significant debt-related risks and regulatory pressures typical of regulated utilities. Evergy’s Altman Z-score indicates financial distress, raising bankruptcy concerns, whereas Alliant Energy shows a moderate financial health profile but with unfavorable leverage ratios. Market risk remains moderate with betas under 1. Operational efficiency is low for both, impacting profitability. Environmental risks stem from reliance on fossil fuels despite renewable investments. Geopolitical risks are minimal due to domestic focus in stable regions. Investors should weigh these factors carefully with a focus on debt management and regulatory developments.
Which Stock to Choose?
Alliant Energy Corporation (LNT) shows a mixed income evolution with a slight overall revenue growth of 16.54% from 2020 to 2024 but a recent 1.14% decline. Its profitability is solid with a 17.33% net margin, though ROE and ROIC remain unfavorable. The company carries significant debt and a moderate rating of C+.
Evergy, Inc. (EVRG) demonstrates favorable income growth, including a 6.17% revenue increase in the last year and a 18.53% rise over five years. Its net margin stands at 15.0%, with slightly better ROE and ROIC metrics than LNT. Despite considerable debt, EVRG holds a slightly stronger B- rating.
From a rating and financial standpoint, LNT and EVRG are both slightly unfavorable overall, with EVRG showing stronger income growth and improving profitability. Investors focused on growth might find EVRG more appealing, while those valuing stable income quality and dividend yield could see LNT as a potential candidate to monitor.
Disclaimer: Investment carries a risk of loss of initial capital. The past performance is not a reliable indicator of future results. Be sure to understand risks before making an investment decision.
Go Further
I encourage you to read the complete analyses of Alliant Energy Corporation and Evergy, Inc. to enhance your investment decisions: