Entergy Corporation (ETR) and Alliant Energy Corporation (LNT) are two key players in the regulated electric utility sector in the United States. Both companies provide essential electricity services with overlapping commitments to innovation in clean energy and infrastructure modernization. This comparison explores their market positions, operational strategies, and growth prospects to help you, the investor, decide which utility stock could best fit your portfolio in 2026.
Table of contents
Companies Overview
I will begin the comparison between Entergy Corporation and Alliant Energy Corporation by providing an overview of these two companies and their main differences.
Entergy Corporation Overview
Entergy Corporation operates in the regulated electric industry, focusing on electricity production and retail distribution across Arkansas, Louisiana, Mississippi, and Texas. Its business segments include Utility and Entergy Wholesale Commodities, with a diversified energy mix including gas, nuclear, coal, hydro, and solar power. The company serves around 3M utility customers and has approximately 26,000 MW of electric generating capacity, including 6,000 MW from nuclear power.
Alliant Energy Corporation Overview
Alliant Energy Corporation is a utility holding company providing regulated electricity and natural gas services primarily in Iowa and Wisconsin. It operates through three segments: Utility Electric Operations, Utility Gas Operations, and Utility Other. The company serves roughly 1.4M retail customers combined through its subsidiaries and owns electric generation assets including a 347 MW natural gas unit and a 225 MW wind farm. It also operates freight and logistics services in Iowa.
Key similarities and differences
Both Entergy and Alliant Energy operate in the regulated electric sector, providing electricity and natural gas services to retail customers. Entergy has a larger scale with diversified power generation including nuclear and solar, while Alliant Energy features a more regional focus with integrated electric, gas, and freight operations. Entergy’s market cap is significantly higher at $41.8B compared to Alliant’s $16.7B, reflecting their different operational scopes and geographic footprints.
Income Statement Comparison
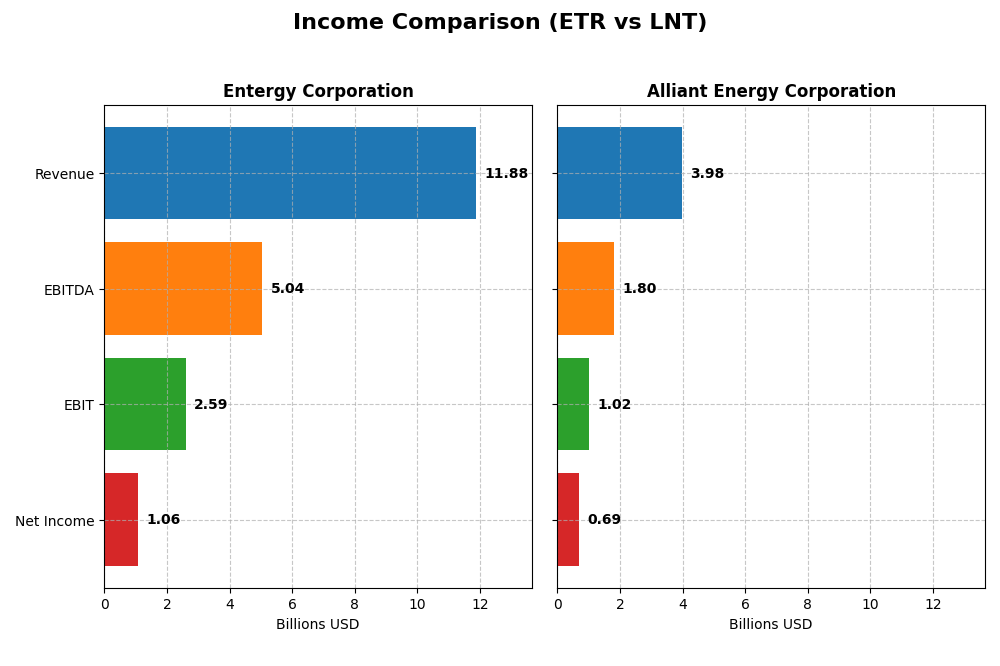
The table below presents a side-by-side comparison of key income statement metrics for Entergy Corporation and Alliant Energy Corporation for the fiscal year 2024.
| Metric | Entergy Corporation | Alliant Energy Corporation |
|---|---|---|
| Market Cap | 41.8B | 16.7B |
| Revenue | 11.9B | 4.0B |
| EBITDA | 5.0B | 1.8B |
| EBIT | 2.6B | 1.0B |
| Net Income | 1.1B | 690M |
| EPS | 2.47 | 2.69 |
| Fiscal Year | 2024 | 2024 |
Income Statement Interpretations
Entergy Corporation
Entergy’s revenue showed a mixed trend with a 17.46% growth over 2020-2024 but a 2.2% decline in 2024 alone. Net income decreased by 24.56% over the period, with a sharp 54.07% drop in net margin in 2024. Margins were generally favorable, especially gross margin at 48.3%, though recent net margin and EPS contracted significantly, indicating margin pressure in the latest year.
Alliant Energy Corporation
Alliant Energy experienced 16.54% revenue growth over five years but a slight 1.14% decline in 2024. Net income grew 10.58% overall, with a modest 0.72% net margin decrease in 2024. The company maintained favorable gross (44.7%) and EBIT margins (25.75%), though interest expense was less favorable. EPS growth was positive over the longer term, despite a small recent dip.
Which one has the stronger fundamentals?
Both companies face revenue declines and margin contractions in 2024, reflecting sector challenges. Entergy has stronger gross margins but suffered sharper net income and EPS declines recently. Alliant shows steadier net income growth and better EPS trajectory, though with higher interest expenses. Overall, both show unfavorable global income opinions, with Alliant slightly better balanced in growth and margins.
Financial Ratios Comparison
The table below presents a side-by-side comparison of key financial ratios for Entergy Corporation (ETR) and Alliant Energy Corporation (LNT) based on the most recent fiscal year data available for 2024.
| Ratios | Entergy Corporation (ETR) | Alliant Energy Corporation (LNT) |
|---|---|---|
| ROE | 7.0% | 9.9% |
| ROIC | 3.2% | 4.9% |
| P/E | 30.6 | 22.0 |
| P/B | 2.14 | 2.17 |
| Current Ratio | 0.72 | 0.44 |
| Quick Ratio | 0.43 | 0.33 |
| D/E (Debt to Equity) | 1.91 | 1.49 |
| Debt-to-Assets | 44.6% | 45.8% |
| Interest Coverage | 2.30 | 1.97 |
| Asset Turnover | 0.18 | 0.18 |
| Fixed Asset Turnover | 0.25 | 0.21 |
| Payout Ratio | 94.2% | 71.3% |
| Dividend Yield | 3.1% | 3.2% |
Interpretation of the Ratios
Entergy Corporation
Entergy Corporation exhibits several unfavorable ratios, including low return on equity (7.02%) and return on invested capital (3.2%), alongside a weak current ratio (0.72) and high debt-to-equity (1.91). Its dividend yield is favorable at 3.08%, supported by consistent dividend payments, but negative free cash flow coverage could pose sustainability risks for dividends and buybacks.
Alliant Energy Corporation
Alliant Energy shows stronger net margin (17.33%) and a slightly better dividend yield (3.24%) than Entergy. However, it also faces challenges with low return on equity (9.85%) and return on invested capital (4.88%), plus weak liquidity ratios (current ratio 0.44). Dividend payments appear supported but free cash flow remains negative, raising caution for distributions.
Which one has the best ratios?
Alliant Energy has a higher proportion of favorable ratios (21.43%) compared to Entergy’s 14.29%, with better profitability and dividend yield. However, both companies share significant weaknesses in liquidity, leverage, and returns, making their overall financial health only slightly unfavorable and requiring careful monitoring.
Strategic Positioning
This section compares the strategic positioning of Entergy Corporation and Alliant Energy Corporation in terms of market position, key segments, and exposure to technological disruption:
Entergy Corporation
- Leading regulated electric utility in southern US states facing moderate competition.
- Diverse segments including Utility and Wholesale Commodities, with electricity from gas, nuclear, coal, hydro, and solar.
- Exposure to various power generation technologies including nuclear, gas, coal, hydro, and solar.
Alliant Energy Corporation
- Regional utility focused on Midwest US markets with stable competitive environment.
- Segments include Electric, Gas, and Other Utility services focused on retail and wholesale customers.
- Involvement in natural gas-fired electric generation and wind power, with integrated freight services.
Entergy Corporation vs Alliant Energy Corporation Positioning
Entergy operates a diversified business with multiple power generation sources and wholesale commodity activities, offering broad market coverage. Alliant Energy maintains a more concentrated regional presence with a utility focus and additional logistics services, reflecting contrasting strategic breadth and specialization.
Which has the best competitive advantage?
Both companies are shedding value with ROIC below WACC; Entergy shows a declining ROIC trend, while Alliant maintains stable but unfavorable profitability, indicating neither currently holds a strong competitive moat.
Stock Comparison
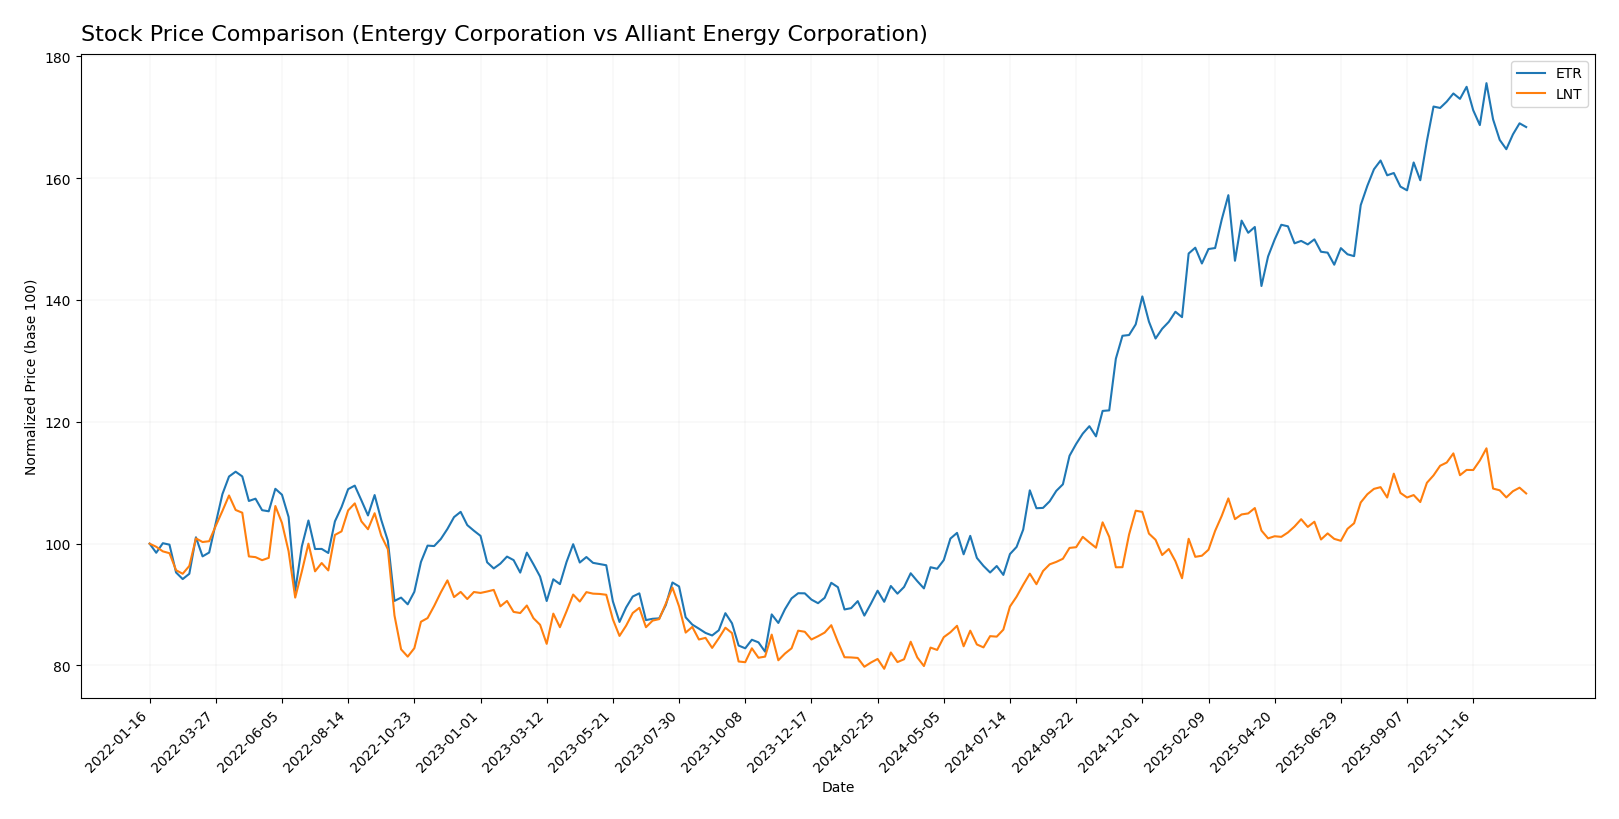
The stock prices of Entergy Corporation (ETR) and Alliant Energy Corporation (LNT) displayed significant bullish trends over the past 12 months, followed by recent declines reflecting seller dominance and decelerating momentum.
Trend Analysis
Entergy Corporation’s stock rose sharply by 86.74% over the past year, showing a bullish trend with decelerating acceleration. The price ranged from 50.08 to 97.52, with recent weeks marking a slight bearish pullback of -3.17%.
Alliant Energy Corporation’s stock gained 34.48% during the same period, also bullish with deceleration. The price moved between 47.73 and 69.47, but the last weeks showed a more pronounced decline of -5.73%, indicating increased selling pressure.
Comparing the two, Entergy Corporation delivered a higher market performance than Alliant Energy over the past year, despite both experiencing recent downward trends and decelerating momentum.
Target Prices
The current target price consensus reflects cautious optimism among analysts for these utilities.
| Company | Target High | Target Low | Consensus |
|---|---|---|---|
| Entergy Corporation | 115 | 91 | 103.17 |
| Alliant Energy Corporation | 78 | 65 | 73 |
Analysts anticipate moderate upside for Entergy, with consensus above its current price of 93.52 USD. Alliant Energy’s targets also suggest potential gains from its 65.02 USD market price.
Analyst Opinions Comparison
This section compares analysts’ ratings and grades for Entergy Corporation and Alliant Energy Corporation:
Rating Comparison
ETR Rating
- Rated B-, considered very favorable overall.
- Discounted Cash Flow Score is 1, marked very unfavorable.
- Return on Equity Score is 4, indicating a favorable efficiency in generating profit from equity.
- Return on Assets Score is 3, showing moderate effectiveness in asset utilization.
- Debt To Equity Score is 2, indicating moderate financial risk.
- Overall Score is 2, considered moderate.
LNT Rating
- Rated C+, also considered very favorable overall.
- Discounted Cash Flow Score is 3, assessed as moderate.
- Return on Equity Score is 1, rated very unfavorable.
- Return on Assets Score is 4, showing favorable asset utilization.
- Debt To Equity Score is 1, reflecting very unfavorable financial stability.
- Overall Score is 2, also considered moderate.
Which one is the best rated?
Based on the provided data, Entergy Corporation (ETR) has a better return on equity and a more favorable debt-to-equity score than Alliant Energy (LNT). However, LNT shows a superior discounted cash flow score and return on assets. Both have the same overall moderate score.
Scores Comparison
Here is a comparison of the financial scores for Entergy Corporation and Alliant Energy Corporation:
Entergy Corporation Scores
- Altman Z-Score: 1.04, indicating financial distress zone risk.
- Piotroski Score: 4, classified as average financial strength.
Alliant Energy Corporation Scores
- Altman Z-Score: Unavailable, no data provided.
- Piotroski Score: 5, classified as average financial strength.
Which company has the best scores?
Based on the available data, Entergy has a low Altman Z-Score indicating high bankruptcy risk, while Alliant Energy’s Altman score is unavailable. Both have average Piotroski scores, with Alliant slightly higher at 5 versus 4 for Entergy.
Grades Comparison
Here is a comparison of recent analyst grades for Entergy Corporation and Alliant Energy Corporation:
Entergy Corporation Grades
The following table summarizes Entergy Corporation’s recent analyst grades from recognized grading companies:
| Grading Company | Action | New Grade | Date |
|---|---|---|---|
| Argus Research | Maintain | Buy | 2026-01-06 |
| UBS | Maintain | Buy | 2025-12-17 |
| Keybanc | Maintain | Overweight | 2025-12-12 |
| JP Morgan | Maintain | Overweight | 2025-12-11 |
| Citigroup | Maintain | Neutral | 2025-11-18 |
| Evercore ISI Group | Maintain | In Line | 2025-10-30 |
| Mizuho | Maintain | Outperform | 2025-10-27 |
| Morgan Stanley | Maintain | Equal Weight | 2025-10-22 |
| B of A Securities | Maintain | Neutral | 2025-10-16 |
| Keybanc | Maintain | Overweight | 2025-10-15 |
Entergy’s grades show a consistent pattern of Buy and Overweight ratings with no downgrades, indicating stable positive analyst sentiment.
Alliant Energy Corporation Grades
The table below shows Alliant Energy Corporation’s recent analyst grades from verified grading companies:
| Grading Company | Action | New Grade | Date |
|---|---|---|---|
| Argus Research | Downgrade | Hold | 2026-01-09 |
| UBS | Maintain | Buy | 2025-12-17 |
| UBS | Upgrade | Buy | 2025-10-24 |
| B of A Securities | Maintain | Buy | 2025-10-17 |
| BMO Capital | Maintain | Market Perform | 2025-10-17 |
| Barclays | Maintain | Underweight | 2025-10-14 |
| UBS | Maintain | Neutral | 2025-10-10 |
| B of A Securities | Maintain | Buy | 2025-08-14 |
| BMO Capital | Maintain | Market Perform | 2025-08-11 |
| UBS | Maintain | Neutral | 2025-07-11 |
Alliant Energy’s grades include a recent downgrade from Argus Research to Hold, mixed with Buy and Market Perform ratings, reflecting more varied analyst opinions.
Which company has the best grades?
Entergy Corporation has received more consistent and predominantly positive grades, such as multiple Buy and Overweight ratings, compared to Alliant Energy’s more mixed profile including downgrades and Underweight ratings. This suggests Entergy may be viewed more favorably by analysts, potentially influencing investor confidence and portfolio decisions.
Strengths and Weaknesses
Below is a comparison table highlighting the main strengths and weaknesses of Entergy Corporation (ETR) and Alliant Energy Corporation (LNT) based on their recent financial and operational performance.
| Criterion | Entergy Corporation (ETR) | Alliant Energy Corporation (LNT) |
|---|---|---|
| Diversification | Moderate revenue diversity across Commercial, Industrial, Residential, and Governmental segments, but heavy reliance on electricity utility | Focused mainly on Electric and Gas utilities with smaller other utility segments; less diversified product range |
| Profitability | Net margin 8.93% (neutral), ROIC 3.2% (unfavorable), declining ROIC trend, value destroying | Net margin 17.33% (favorable), ROIC 4.88% (unfavorable), stable ROIC trend, but also value destroying |
| Innovation | Limited visible innovation; product/service growth flat or declining | Stable operations with slight improvements; innovation not a key differentiator |
| Global presence | Primarily US-regulated utility, limited global exposure | Purely domestic US utility operations with no global presence |
| Market Share | Strong regional utility position in US, significant residential and industrial customer base | Strong regional utility market share, focused on Midwest US markets |
Key takeaways: Both companies operate primarily in regulated US utility markets with limited diversification beyond electricity and natural gas. Entergy shows declining profitability and value destruction, while Alliant Energy maintains better margins and a stable profitability trend, though it also destroys value. Investors should approach both with caution, favoring Alliant Energy for its slightly stronger fundamentals.
Risk Analysis
Below is a comparative table highlighting key risks for Entergy Corporation (ETR) and Alliant Energy Corporation (LNT) based on their latest available data for 2024.
| Metric | Entergy Corporation (ETR) | Alliant Energy Corporation (LNT) |
|---|---|---|
| Market Risk | Moderate (Beta 0.65) | Moderate (Beta 0.67) |
| Debt level | High (D/E 1.91, neutral debt-to-assets 44.6%) | Elevated (D/E 1.49, neutral debt-to-assets 45.8%) |
| Regulatory Risk | Significant (Utility sector, nuclear operations) | Significant (Utility sector, multi-state operations) |
| Operational Risk | Nuclear plant decommissioning and plant maintenance risks | Dependence on regulated utility operations and fuel sources |
| Environmental Risk | Medium (Nuclear and fossil fuel generation impact) | Medium (Natural gas and wind power operations) |
| Geopolitical Risk | Low (Primarily US-based operations) | Low (Primarily US-based operations) |
The most impactful and likely risks for both companies center around regulatory and operational challenges inherent in the regulated electric utility sector, especially for Entergy with its nuclear assets. High debt levels pose financial risks, with Entergy showing a higher debt-to-equity ratio. Both companies face environmental pressures due to their generation mix but maintain moderate exposure to geopolitical risks given their US-focused operations.
Which Stock to Choose?
Entergy Corporation (ETR) shows mixed financial health with a declining income trend and unfavorable profitability ratios like ROE at 7.02% and ROIC at 3.2%, while carrying high debt levels and an overall moderate rating of B-. Its economic moat is very unfavorable due to decreasing ROIC below WACC, indicating value destruction.
Alliant Energy Corporation (LNT) exhibits a slightly better income evolution with favorable net margin at 17.33% but also faces unfavorable ROE at 9.85% and ROIC at 4.88%, with moderate debt metrics and a lower overall rating of C+. Its moat is unfavorable with a stable ROIC below WACC, suggesting consistent but non-value-creating profitability.
Investors prioritizing growth potential might find Entergy’s higher market cap and bullish long-term price trend appealing despite its financial weaknesses, whereas those seeking stability could lean towards Alliant Energy, which shows steadier profitability and a slightly more balanced ratio profile. The choice might depend on one’s tolerance for financial risk and preference for value creation signals.
Disclaimer: Investment carries a risk of loss of initial capital. The past performance is not a reliable indicator of future results. Be sure to understand risks before making an investment decision.
Go Further
I encourage you to read the complete analyses of Entergy Corporation and Alliant Energy Corporation to enhance your investment decisions: