Edison International (EIX) and Alliant Energy Corporation (LNT) are two prominent players in the regulated electric utility sector, serving millions of customers across different U.S. regions. Both companies emphasize innovation in energy distribution and sustainability, making them key competitors in a transforming industry. In this article, I will analyze their strategic approaches and financial health to help you decide which company might offer a more compelling investment opportunity.
Table of contents
Companies Overview
I will begin the comparison between Edison International and Alliant Energy Corporation by providing an overview of these two companies and their main differences.
Edison International Overview
Edison International, founded in 1886 and headquartered in Rosemead, California, is a major player in the regulated electric industry. The company generates and distributes electricity to 15M residential, commercial, industrial, and public authority customers mainly across Southern, Central, and Coastal California. With extensive transmission facilities and a large distribution system, Edison International focuses on delivering reliable electric power and energy solutions.
Alliant Energy Corporation Overview
Alliant Energy Corporation, established in 1981 and based in Madison, Wisconsin, operates as a utility holding company providing regulated electricity and natural gas services. It serves over 1.4M retail customers across Iowa and Wisconsin through its subsidiaries, offering electric and gas distribution, wholesale electricity sales, and freight logistics services. The company also owns natural gas-fired and wind power generation assets, supporting its diversified utility portfolio.
Key similarities and differences
Both companies operate in the regulated electric sector and focus on generating and distributing electricity to residential and commercial customers. Edison International primarily serves California with a large-scale electric transmission and distribution system, while Alliant Energy has a more diversified utility model including natural gas services and freight operations across Iowa and Wisconsin. Edison is larger by market cap and employee count, whereas Alliant Energy incorporates renewable energy and multimodal logistics in its business.
Income Statement Comparison
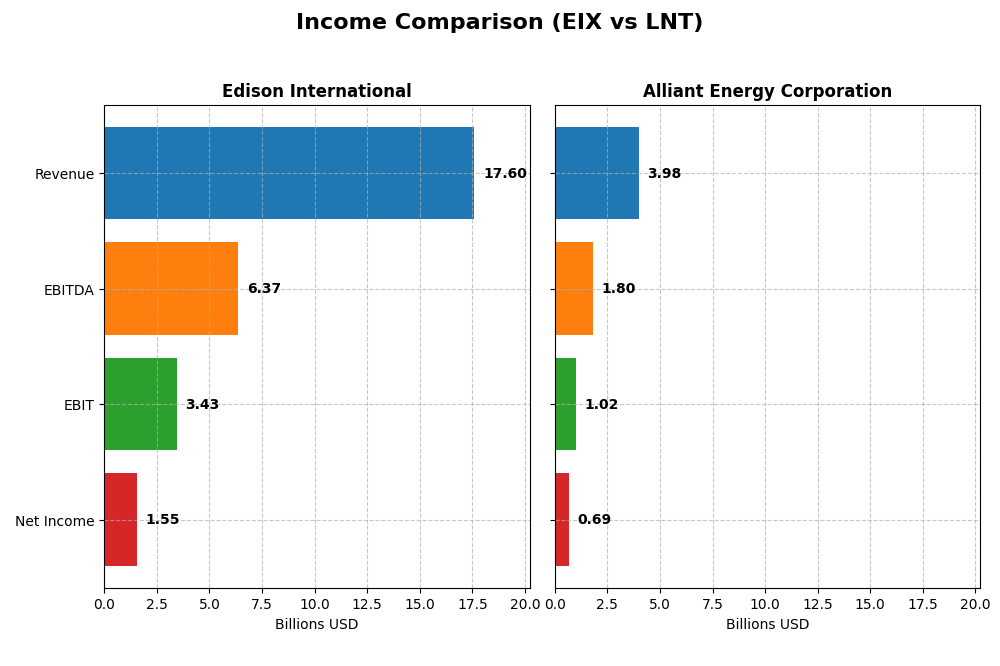
The table below compares the key income statement metrics of Edison International and Alliant Energy Corporation for the fiscal year 2024, highlighting their financial performance.
| Metric | Edison International | Alliant Energy Corporation |
|---|---|---|
| Market Cap | 23.5B | 16.7B |
| Revenue | 17.6B | 4.0B |
| EBITDA | 6.4B | 1.8B |
| EBIT | 3.4B | 1.0B |
| Net Income | 1.5B | 690M |
| EPS | 3.33 | 2.69 |
| Fiscal Year | 2024 | 2024 |
Income Statement Interpretations
Edison International
Edison International showed steady revenue growth from 2020 to 2024, with a 29.61% increase overall and a 7.72% rise in the last year. Net income grew significantly by 77.5% over the period, with a modest 2.01% net margin growth last year. Margins remained favorable, supported by a 41.01% gross and 19.5% EBIT margin in 2024, though interest expense was a downside.
Alliant Energy Corporation
Alliant Energy experienced a 16.54% revenue increase over 2020-2024 but saw a slight 1.14% decline in 2024. Net income rose 10.58% over the period, yet the recent year showed negative trends, including a 6.9% EBIT decrease and a 0.72% drop in net margin. Margins are strong overall, with a 44.71% gross and 25.75% EBIT margin, but interest expense remains relatively high.
Which one has the stronger fundamentals?
Edison International demonstrates stronger fundamentals with broad favorable margin trends and robust net income growth, despite some interest expense pressure. Alliant Energy shows solid margins but faces recent earnings and margin declines, impacting its overall income statement evaluation. Edison’s consistent growth and margin improvements suggest a more favorable income profile over the period.
Financial Ratios Comparison
This table presents the most recent key financial ratios for Edison International and Alliant Energy Corporation, illustrating their performance and financial health as of fiscal year 2024.
| Ratios | Edison International (EIX) | Alliant Energy Corporation (LNT) |
|---|---|---|
| ROE | 9.93% | 9.85% |
| ROIC | 3.61% | 4.88% |
| P/E | 19.93 | 21.98 |
| P/B | 1.98 | 2.17 |
| Current Ratio | 0.85 | 0.44 |
| Quick Ratio | 0.78 | 0.33 |
| D/E (Debt-to-Equity) | 2.43 | 1.49 |
| Debt-to-Assets | 44.1% | 45.8% |
| Interest Coverage | 1.57 | 1.97 |
| Asset Turnover | 0.21 | 0.18 |
| Fixed Asset Turnover | 0.29 | 0.21 |
| Payout Ratio | 83.2% | 71.3% |
| Dividend Yield | 4.17% | 3.24% |
Interpretation of the Ratios
Edison International
Edison International shows mostly unfavorable financial ratios, with concerns on return on equity (9.93%), return on invested capital (3.61%), and liquidity ratios below 1, indicating potential short-term financial stress. Debt-to-equity is high at 2.43, and interest coverage is weak at 1.84. The dividend yield is favorable at 4.17%, suggesting steady shareholder returns, but caution is needed due to coverage risks.
Alliant Energy Corporation
Alliant Energy presents a mixed ratio profile with a favorable net margin of 17.33% and a decent dividend yield of 3.24%. However, its return on equity (9.85%) and return on invested capital (4.88%) are unfavorable, and liquidity ratios are low, signaling potential short-term challenges. Debt-to-equity is lower than Edison’s at 1.49, with neutral interest coverage at 2.28, reflecting moderate financial risk.
Which one has the best ratios?
Alliant Energy holds a slightly more favorable ratio profile than Edison International, with better net margin and lower debt-to-equity. Both companies face liquidity and profitability challenges, but Edison’s higher debt and weaker interest coverage contribute to a less favorable overall evaluation. Neither company shows strongly positive financial health based on the ratios alone.
Strategic Positioning
This section compares the strategic positioning of Edison International and Alliant Energy Corporation in terms of market position, key segments, and exposure to technological disruption:
Edison International
- Leading regulated electric utility in California with significant market scale and competition.
- Focuses on electric utility and competitive power generation segments driving revenue.
- Exposure limited to traditional utility infrastructure with no explicit technology disruption mentioned.
Alliant Energy Corporation
- Regional utility holding company with regulated electric and gas services in Midwest states.
- Diversified utility operations including electric, gas, and other utility services segments.
- Holds interests in natural gas and wind power generation, showing some renewable energy exposure.
Edison International vs Alliant Energy Corporation Positioning
Edison International has a concentrated focus on electric utility services in California, emphasizing large-scale regulated electricity delivery. Alliant Energy has a more diversified business model across electric, gas, and other utility services in multiple states, with some renewable energy assets. Each approach reflects different geographic and segment diversification.
Which has the best competitive advantage?
Both companies are currently shedding value with ROIC below WACC. Edison shows a slightly unfavorable moat with growing profitability, while Alliant Energy has an unfavorable moat with stable profitability, indicating Edison might have a marginally stronger competitive advantage based on recent trends.
Stock Comparison
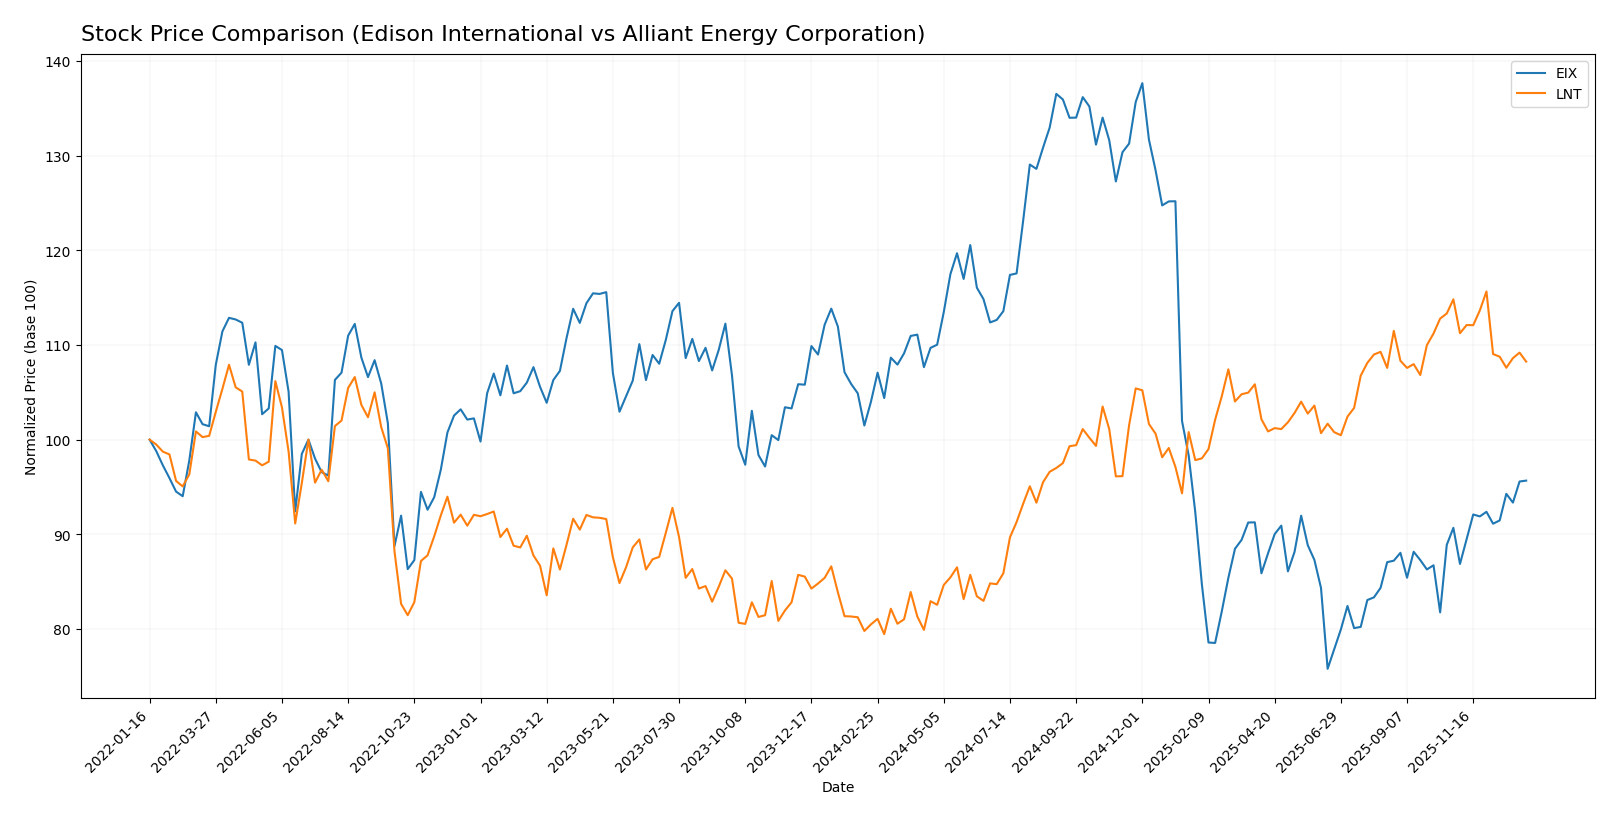
The stock price movements of Edison International (EIX) and Alliant Energy Corporation (LNT) over the past 12 months reveal contrasting trends, with EIX experiencing a notable decline and LNT showing significant gains despite recent softness.
Trend Analysis
Edison International’s stock exhibited a bearish trend over the past year, declining by 8.02% with accelerating downward momentum and a high volatility level indicated by a 12.11 standard deviation. The price ranged between 48.32 and 87.75.
Alliant Energy Corporation showed a bullish trend with a 34.48% increase over the year, though the trend decelerated and volatility was moderate at a 5.9 standard deviation. The stock’s price fluctuated between 47.73 and 69.47.
Comparing both, Alliant Energy delivered the highest market performance with a strong positive return, while Edison International underperformed with a significant negative trend during the same period.
Target Prices
Analysts show a moderate to optimistic consensus on target prices for Edison International and Alliant Energy Corporation.
| Company | Target High | Target Low | Consensus |
|---|---|---|---|
| Edison International | 70 | 56 | 62 |
| Alliant Energy Corporation | 78 | 65 | 73 |
Edison International’s consensus target price of 62 is slightly above its current price of 60.99, suggesting modest upside potential. Alliant Energy’s consensus target of 73 well exceeds its current price of 65.02, indicating stronger expected growth from analysts.
Analyst Opinions Comparison
This section compares the analysts’ ratings and financial scores for Edison International and Alliant Energy Corporation:
Rating Comparison
Edison International Rating
- Rating: B+, classified as Very Favorable by analysts.
- Discounted Cash Flow Score: 1, indicating a Very Unfavorable DCF.
- ROE Score: 5, rated Very Favorable for profit generation.
- ROA Score: 4, considered Favorable for asset utilization.
- Debt To Equity Score: 1, Very Unfavorable, indicating high risk.
- Overall Score: 3, Moderate overall financial standing.
Alliant Energy Corporation Rating
- Rating: C+, also classified as Very Favorable by analysts.
- Discounted Cash Flow Score: 3, indicating a Moderate DCF.
- ROE Score: 1, rated Very Unfavorable for profit generation.
- ROA Score: 4, also considered Favorable for asset utilization.
- Debt To Equity Score: 1, Very Unfavorable, indicating high risk.
- Overall Score: 2, Moderate overall financial standing.
Which one is the best rated?
Based strictly on the provided data, Edison International holds a better overall rating (B+) and higher scores in ROE and DCF compared to Alliant Energy Corporation’s lower overall rating (C+) and weaker ROE score. Both share similar risks in debt to equity.
Scores Comparison
Here is a comparison of the Altman Z-Score and Piotroski Score for Edison International and Alliant Energy Corporation:
EIX Scores
- Altman Z-Score: 0.72, in the distress zone, signaling high bankruptcy risk.
- Piotroski Score: 6, indicating average financial strength.
LNT Scores
- Altman Z-Score: unavailable for evaluation.
- Piotroski Score: 5, indicating average financial strength.
Which company has the best scores?
Based on the available data, Edison International has a known Altman Z-Score indicating financial distress, while Alliant Energy’s Altman Z-Score is unavailable. Both companies have similar average Piotroski Scores, with Edison slightly higher at 6 versus 5.
Grades Comparison
Here is a comparison of the latest available grades for Edison International and Alliant Energy Corporation:
Edison International Grades
The table below summarizes recent grades from recognized financial institutions for Edison International:
| Grading Company | Action | New Grade | Date |
|---|---|---|---|
| Morgan Stanley | Maintain | Underweight | 2025-12-17 |
| JP Morgan | Maintain | Neutral | 2025-12-12 |
| UBS | Maintain | Buy | 2025-12-02 |
| Ladenburg Thalmann | Maintain | Neutral | 2025-10-30 |
| Barclays | Maintain | Overweight | 2025-10-29 |
| Jefferies | Maintain | Hold | 2025-10-22 |
| Morgan Stanley | Maintain | Underweight | 2025-10-22 |
| Barclays | Maintain | Overweight | 2025-10-21 |
| Jefferies | Downgrade | Hold | 2025-10-02 |
| JP Morgan | Maintain | Neutral | 2025-09-25 |
Edison International’s grades show a mix of Buy, Hold, Neutral, and Underweight ratings, with some recent downgrades but overall a stable consensus.
Alliant Energy Corporation Grades
The table below includes recent grades from reputable firms for Alliant Energy Corporation:
| Grading Company | Action | New Grade | Date |
|---|---|---|---|
| Argus Research | Downgrade | Hold | 2026-01-09 |
| UBS | Maintain | Buy | 2025-12-17 |
| UBS | Upgrade | Buy | 2025-10-24 |
| B of A Securities | Maintain | Buy | 2025-10-17 |
| BMO Capital | Maintain | Market Perform | 2025-10-17 |
| Barclays | Maintain | Underweight | 2025-10-14 |
| UBS | Maintain | Neutral | 2025-10-10 |
| B of A Securities | Maintain | Buy | 2025-08-14 |
| BMO Capital | Maintain | Market Perform | 2025-08-11 |
| UBS | Maintain | Neutral | 2025-07-11 |
Alliant Energy’s grades mostly trend toward Buy and Market Perform, with a recent downgrade to Hold by Argus Research, indicating some cautious sentiment.
Which company has the best grades?
Both Edison International and Alliant Energy Corporation have a consensus rating of “Buy.” However, Alliant Energy shows a stronger concentration of Buy ratings and fewer Neutral or Underweight grades compared to Edison International, which has more varied ratings including Underweight. This may influence investors’ perception of relative strength and risk between the two companies.
Strengths and Weaknesses
Below is a comparison of key strengths and weaknesses for Edison International (EIX) and Alliant Energy Corporation (LNT) based on recent financial data and market positioning.
| Criterion | Edison International (EIX) | Alliant Energy Corporation (LNT) |
|---|---|---|
| Diversification | Moderate: Focused on Electric Utility and Competitive Power Generation segments | Moderate: Primarily Electric and Gas utilities with smaller segments |
| Profitability | Neutral net margin (8.78%), but unfavorable ROE (9.93%) and ROIC (3.61%) | Favorable net margin (17.33%), but unfavorable ROE (9.85%) and ROIC (4.88%) |
| Innovation | Slightly unfavorable economic moat; growing ROIC trend suggests improving operations | Unfavorable economic moat; ROIC trend is stable but low |
| Global presence | Primarily US-focused utility operations, limited global footprint | Primarily US regional utility focus, limited global presence |
| Market Share | Strong in California and competitive power markets | Strong regional market share in Midwest utilities |
Key takeaways: Edison International shows signs of improving profitability with a growing ROIC despite currently destroying value, while Alliant Energy demonstrates better net margins but a stable yet unfavorable value creation profile. Both companies have moderate diversification focused on utilities, with limited global reach. Investors should consider the improving operational efficiency at EIX against LNT’s stable but less dynamic position.
Risk Analysis
Below is a comparison table of key risks for Edison International (EIX) and Alliant Energy Corporation (LNT) based on the most recent data from 2024:
| Metric | Edison International (EIX) | Alliant Energy Corporation (LNT) |
|---|---|---|
| Market Risk | Beta 0.83, moderate market sensitivity | Beta 0.67, lower market volatility |
| Debt level | High debt-to-equity 2.43 (unfavorable) | High debt-to-equity 1.49 (unfavorable) |
| Regulatory Risk | Significant due to California energy policies | Moderate, operates in Midwestern states with stable regulation |
| Operational Risk | Large grid with 39K overhead miles, risks from outages and maintenance | Smaller scale, but exposure to natural gas and wind generation risks |
| Environmental Risk | Exposure to wildfire liabilities and emissions regulations | Exposure to emissions and renewable energy transition |
| Geopolitical Risk | Low, primarily domestic US operations | Low, primarily domestic US operations |
Edison International’s main risks stem from its high leverage and regulatory challenges in California’s evolving energy market, including wildfire liabilities. Alliant Energy carries moderately high debt and faces operational risks related to its diverse energy mix but benefits from less volatile regulatory environments. Both require cautious risk management due to financial leverage and sector-specific operational exposures.
Which Stock to Choose?
Edison International (EIX) shows favorable income growth with a 29.61% revenue increase over five years and a solid net margin of 8.78%. Its profitability ratios are mixed, with return on equity at 9.93% deemed unfavorable, and a high debt level reflected in a 2.43 debt-to-equity ratio. The company holds a very favorable B+ rating, though financial ratios overall are considered unfavorable.
Alliant Energy Corporation (LNT) reports a 16.54% revenue growth over five years but faced recent declines in key income metrics. It demonstrates stronger net margin at 17.33%, with return on equity slightly unfavorable at 9.85%, and a lower debt-to-equity ratio of 1.49. The firm’s rating is a favorable C+, with financial ratios evaluated as slightly unfavorable overall.
For investors prioritizing growth and income statement strength, Edison International’s favorable income growth and higher rating might appear more attractive, while those emphasizing stability and moderate leverage could find Alliant Energy’s profile and slightly unfavorable yet steadier ratios more aligned with cautious strategies.
Disclaimer: Investment carries a risk of loss of initial capital. The past performance is not a reliable indicator of future results. Be sure to understand risks before making an investment decision.
Go Further
I encourage you to read the complete analyses of Edison International and Alliant Energy Corporation to enhance your investment decisions: